Free Statistics

of Irreproducible Research!

Author's title

Author*Unverified author*
R Software Modulerwasp_multipleregression.wasp
Title produced by softwareMultiple Regression
Date of computationWed, 09 Jan 2008 05:06:38 -0700
Cite this page as followsStatistical Computations at FreeStatistics.org, Office for Research Development and Education, URL https://freestatistics.org/blog/index.php?v=date/2008/Jan/09/t11998807503p7gisgs84f793b.htm/, Retrieved Wed, 15 May 2024 09:25:20 +0000
Statistical Computations at FreeStatistics.org, Office for Research Development and Education, URL https://freestatistics.org/blog/index.php?pk=7933, Retrieved Wed, 15 May 2024 09:25:20 +0000
QR Codes:

Original text written by user:
IsPrivate?No (this computation is public)
User-defined keywords
Estimated Impact264
Family? (F = Feedback message, R = changed R code, M = changed R Module, P = changed Parameters, D = changed Data)
-       [Multiple Regression] [regressie 1] [2008-01-09 12:06:38] [d41d8cd98f00b204e9800998ecf8427e] [Current]
Feedback Forum

Post a new message
Dataseries X:
1,0137	89,97
0,9834	99,8
0,9643	112,99
0,947	93,69
0,906	108,02
0,9492	99,11
0,9397	94,33
0,9041	83,75
0,8721	106,37
0,8552	109,63
0,8564	105,5
0,8973	96,13
0,9383	102,48
0,9217	101,37
0,9095	112,76
0,892	95,57
0,8742	102,81
0,8532	104,13
0,8607	97,52
0,9005	85,29
0,9111	101,01
0,9059	108,48
0,8883	101,33
0,8924	87,57
0,8833	97,44
0,87	96,06
0,8758	106,67
0,8858	102,67
0,917	104,54
0,9554	102,46
0,9922	103,35
0,9778	83,27
0,9808	108,22
0,9811	115,23
1,0014	103,7
1,0183	93,61
1,0622	100,25
1,0773	100,56
1,0807	108,86
1,0848	105,43
1,1582	104,77
1,1663	109,13
1,1372	106,13
1,1139	82,27
1,1222	113,6
1,1692	117,73
1,1702	104,83
1,2286	104,61
1,2613	102,93
1,2646	106,95
1,2262	123,45
1,1985	111,99
1,2007	103,95
1,2138	122,05
1,2266	108,04
1,2176	93,72
1,2218	119,61
1,249	118,29
1,2991	117,14
1,3408	112,76
1,3119	105,97
1,3014	107,96
1,3201	122,27
1,2938	114,54
1,2694	110,15
1,2165	120,02
1,2037	103,94
1,2292	96,18
1,2256	121,01
1,2015	110,55
1,1786	120,04
1,1856	114,19


Summary of compuational transaction
Raw Inputview raw input (R code)
Raw Outputview raw output of R engine
Computing time4 seconds
R Server'Gwilym Jenkins' @ 72.249.127.135

\begin{tabular}{lllllllll}
\hline
Summary of compuational transaction \tabularnewline
Raw Input & view raw input (R code)  \tabularnewline
Raw Output & view raw output of R engine  \tabularnewline
Computing time & 4 seconds \tabularnewline
R Server & 'Gwilym Jenkins' @ 72.249.127.135 \tabularnewline
\hline
\end{tabular}
%Source: https://freestatistics.org/blog/index.php?pk=7933&T=0

[TABLE]
[ROW][C]Summary of compuational transaction[/C][/ROW]
[ROW][C]Raw Input[/C][C]view raw input (R code) [/C][/ROW]
[ROW][C]Raw Output[/C][C]view raw output of R engine [/C][/ROW]
[ROW][C]Computing time[/C][C]4 seconds[/C][/ROW]
[ROW][C]R Server[/C][C]'Gwilym Jenkins' @ 72.249.127.135[/C][/ROW]
[/TABLE]
Source: https://freestatistics.org/blog/index.php?pk=7933&T=0

Globally Unique Identifier (entire table): ba.freestatistics.org/blog/index.php?pk=7933&T=0

As an alternative you can also use a QR Code:  

The GUIDs for individual cells are displayed in the table below:

Summary of compuational transaction
Raw Inputview raw input (R code)
Raw Outputview raw output of R engine
Computing time4 seconds
R Server'Gwilym Jenkins' @ 72.249.127.135


Multiple Linear Regression - Estimated Regression Equation
uit[t] = + 76.9448945475292 + 17.9272790802276wk[t] -0.0729373360848385M1[t] + 2.24275774771011M2[t] + 14.6337467597814M3[t] + 4.22137035214254M4[t] + 5.75861868890598M5[t] + 9.33169792914856M6[t] + 1.93242931516801M7[t] -12.9390144262923M8[t] + 11.1954660667304M9[t] + 12.6753380348809M10[t] + 7.90052272628074M11[t] + 0.117237698854330t + e[t]

\begin{tabular}{lllllllll}
\hline
Multiple Linear Regression - Estimated Regression Equation \tabularnewline
uit[t] =  +  76.9448945475292 +  17.9272790802276wk[t] -0.0729373360848385M1[t] +  2.24275774771011M2[t] +  14.6337467597814M3[t] +  4.22137035214254M4[t] +  5.75861868890598M5[t] +  9.33169792914856M6[t] +  1.93242931516801M7[t] -12.9390144262923M8[t] +  11.1954660667304M9[t] +  12.6753380348809M10[t] +  7.90052272628074M11[t] +  0.117237698854330t  + e[t] \tabularnewline
\hline
\end{tabular}
%Source: https://freestatistics.org/blog/index.php?pk=7933&T=1

[TABLE]
[ROW][C]Multiple Linear Regression - Estimated Regression Equation[/C][/ROW]
[ROW][C]uit[t] =  +  76.9448945475292 +  17.9272790802276wk[t] -0.0729373360848385M1[t] +  2.24275774771011M2[t] +  14.6337467597814M3[t] +  4.22137035214254M4[t] +  5.75861868890598M5[t] +  9.33169792914856M6[t] +  1.93242931516801M7[t] -12.9390144262923M8[t] +  11.1954660667304M9[t] +  12.6753380348809M10[t] +  7.90052272628074M11[t] +  0.117237698854330t  + e[t][/C][/ROW]
[/TABLE]
Source: https://freestatistics.org/blog/index.php?pk=7933&T=1

Globally Unique Identifier (entire table): ba.freestatistics.org/blog/index.php?pk=7933&T=1

As an alternative you can also use a QR Code:  

The GUIDs for individual cells are displayed in the table below:

Multiple Linear Regression - Estimated Regression Equation
uit[t] = + 76.9448945475292 + 17.9272790802276wk[t] -0.0729373360848385M1[t] + 2.24275774771011M2[t] + 14.6337467597814M3[t] + 4.22137035214254M4[t] + 5.75861868890598M5[t] + 9.33169792914856M6[t] + 1.93242931516801M7[t] -12.9390144262923M8[t] + 11.1954660667304M9[t] + 12.6753380348809M10[t] + 7.90052272628074M11[t] + 0.117237698854330t + e[t]


Multiple Linear Regression - Ordinary Least Squares
VariableParameterS.D.T-STATH0: parameter = 02-tail p-value1-tail p-value
(Intercept)76.94489454752926.51314411.813800
wk17.92727908022767.6095082.35590.0218790.010939
M1-0.07293733608483852.600614-0.0280.9777220.488861
M22.242757747710112.5803540.86920.3883390.194169
M314.63374675978142.5667225.701300
M44.221370352142542.5558911.65160.1040160.052008
M55.758618688905982.5534272.25530.0279070.013953
M69.331697929148562.5514973.65730.0005510.000275
M71.932429315168012.5497410.75790.4515840.225792
M8-12.93901442629232.549667-5.07484e-062e-06
M911.19546606673042.55144.3884.9e-052.4e-05
M1012.67533803488092.5516454.96756e-063e-06
M117.900522726280742.5519233.09590.003020.00151
t0.1172376988543300.0572492.04790.0451110.022556

\begin{tabular}{lllllllll}
\hline
Multiple Linear Regression - Ordinary Least Squares \tabularnewline
Variable & Parameter & S.D. & T-STATH0: parameter = 0 & 2-tail p-value & 1-tail p-value \tabularnewline
(Intercept) & 76.9448945475292 & 6.513144 & 11.8138 & 0 & 0 \tabularnewline
wk & 17.9272790802276 & 7.609508 & 2.3559 & 0.021879 & 0.010939 \tabularnewline
M1 & -0.0729373360848385 & 2.600614 & -0.028 & 0.977722 & 0.488861 \tabularnewline
M2 & 2.24275774771011 & 2.580354 & 0.8692 & 0.388339 & 0.194169 \tabularnewline
M3 & 14.6337467597814 & 2.566722 & 5.7013 & 0 & 0 \tabularnewline
M4 & 4.22137035214254 & 2.555891 & 1.6516 & 0.104016 & 0.052008 \tabularnewline
M5 & 5.75861868890598 & 2.553427 & 2.2553 & 0.027907 & 0.013953 \tabularnewline
M6 & 9.33169792914856 & 2.551497 & 3.6573 & 0.000551 & 0.000275 \tabularnewline
M7 & 1.93242931516801 & 2.549741 & 0.7579 & 0.451584 & 0.225792 \tabularnewline
M8 & -12.9390144262923 & 2.549667 & -5.0748 & 4e-06 & 2e-06 \tabularnewline
M9 & 11.1954660667304 & 2.5514 & 4.388 & 4.9e-05 & 2.4e-05 \tabularnewline
M10 & 12.6753380348809 & 2.551645 & 4.9675 & 6e-06 & 3e-06 \tabularnewline
M11 & 7.90052272628074 & 2.551923 & 3.0959 & 0.00302 & 0.00151 \tabularnewline
t & 0.117237698854330 & 0.057249 & 2.0479 & 0.045111 & 0.022556 \tabularnewline
\hline
\end{tabular}
%Source: https://freestatistics.org/blog/index.php?pk=7933&T=2

[TABLE]
[ROW][C]Multiple Linear Regression - Ordinary Least Squares[/C][/ROW]
[ROW][C]Variable[/C][C]Parameter[/C][C]S.D.[/C][C]T-STATH0: parameter = 0[/C][C]2-tail p-value[/C][C]1-tail p-value[/C][/ROW]
[ROW][C](Intercept)[/C][C]76.9448945475292[/C][C]6.513144[/C][C]11.8138[/C][C]0[/C][C]0[/C][/ROW]
[ROW][C]wk[/C][C]17.9272790802276[/C][C]7.609508[/C][C]2.3559[/C][C]0.021879[/C][C]0.010939[/C][/ROW]
[ROW][C]M1[/C][C]-0.0729373360848385[/C][C]2.600614[/C][C]-0.028[/C][C]0.977722[/C][C]0.488861[/C][/ROW]
[ROW][C]M2[/C][C]2.24275774771011[/C][C]2.580354[/C][C]0.8692[/C][C]0.388339[/C][C]0.194169[/C][/ROW]
[ROW][C]M3[/C][C]14.6337467597814[/C][C]2.566722[/C][C]5.7013[/C][C]0[/C][C]0[/C][/ROW]
[ROW][C]M4[/C][C]4.22137035214254[/C][C]2.555891[/C][C]1.6516[/C][C]0.104016[/C][C]0.052008[/C][/ROW]
[ROW][C]M5[/C][C]5.75861868890598[/C][C]2.553427[/C][C]2.2553[/C][C]0.027907[/C][C]0.013953[/C][/ROW]
[ROW][C]M6[/C][C]9.33169792914856[/C][C]2.551497[/C][C]3.6573[/C][C]0.000551[/C][C]0.000275[/C][/ROW]
[ROW][C]M7[/C][C]1.93242931516801[/C][C]2.549741[/C][C]0.7579[/C][C]0.451584[/C][C]0.225792[/C][/ROW]
[ROW][C]M8[/C][C]-12.9390144262923[/C][C]2.549667[/C][C]-5.0748[/C][C]4e-06[/C][C]2e-06[/C][/ROW]
[ROW][C]M9[/C][C]11.1954660667304[/C][C]2.5514[/C][C]4.388[/C][C]4.9e-05[/C][C]2.4e-05[/C][/ROW]
[ROW][C]M10[/C][C]12.6753380348809[/C][C]2.551645[/C][C]4.9675[/C][C]6e-06[/C][C]3e-06[/C][/ROW]
[ROW][C]M11[/C][C]7.90052272628074[/C][C]2.551923[/C][C]3.0959[/C][C]0.00302[/C][C]0.00151[/C][/ROW]
[ROW][C]t[/C][C]0.117237698854330[/C][C]0.057249[/C][C]2.0479[/C][C]0.045111[/C][C]0.022556[/C][/ROW]
[/TABLE]
Source: https://freestatistics.org/blog/index.php?pk=7933&T=2

Globally Unique Identifier (entire table): ba.freestatistics.org/blog/index.php?pk=7933&T=2

As an alternative you can also use a QR Code:  

The GUIDs for individual cells are displayed in the table below:

Multiple Linear Regression - Ordinary Least Squares
VariableParameterS.D.T-STATH0: parameter = 02-tail p-value1-tail p-value
(Intercept)76.94489454752926.51314411.813800
wk17.92727908022767.6095082.35590.0218790.010939
M1-0.07293733608483852.600614-0.0280.9777220.488861
M22.242757747710112.5803540.86920.3883390.194169
M314.63374675978142.5667225.701300
M44.221370352142542.5558911.65160.1040160.052008
M55.758618688905982.5534272.25530.0279070.013953
M69.331697929148562.5514973.65730.0005510.000275
M71.932429315168012.5497410.75790.4515840.225792
M8-12.93901442629232.549667-5.07484e-062e-06
M911.19546606673042.55144.3884.9e-052.4e-05
M1012.67533803488092.5516454.96756e-063e-06
M117.900522726280742.5519233.09590.003020.00151
t0.1172376988543300.0572492.04790.0451110.022556


Multiple Linear Regression - Regression Statistics
Multiple R0.910125143298849
R-squared0.82832777646475
Adjusted R-squared0.78984951946547
F-TEST (value)21.5271647174726
F-TEST (DF numerator)13
F-TEST (DF denominator)58
p-value0
Multiple Linear Regression - Residual Statistics
Residual Standard Deviation4.41081407999703
Sum Squared Residuals1128.40628920140

\begin{tabular}{lllllllll}
\hline
Multiple Linear Regression - Regression Statistics \tabularnewline
Multiple R & 0.910125143298849 \tabularnewline
R-squared & 0.82832777646475 \tabularnewline
Adjusted R-squared & 0.78984951946547 \tabularnewline
F-TEST (value) & 21.5271647174726 \tabularnewline
F-TEST (DF numerator) & 13 \tabularnewline
F-TEST (DF denominator) & 58 \tabularnewline
p-value & 0 \tabularnewline
Multiple Linear Regression - Residual Statistics \tabularnewline
Residual Standard Deviation & 4.41081407999703 \tabularnewline
Sum Squared Residuals & 1128.40628920140 \tabularnewline
\hline
\end{tabular}
%Source: https://freestatistics.org/blog/index.php?pk=7933&T=3

[TABLE]
[ROW][C]Multiple Linear Regression - Regression Statistics[/C][/ROW]
[ROW][C]Multiple R[/C][C]0.910125143298849[/C][/ROW]
[ROW][C]R-squared[/C][C]0.82832777646475[/C][/ROW]
[ROW][C]Adjusted R-squared[/C][C]0.78984951946547[/C][/ROW]
[ROW][C]F-TEST (value)[/C][C]21.5271647174726[/C][/ROW]
[ROW][C]F-TEST (DF numerator)[/C][C]13[/C][/ROW]
[ROW][C]F-TEST (DF denominator)[/C][C]58[/C][/ROW]
[ROW][C]p-value[/C][C]0[/C][/ROW]
[ROW][C]Multiple Linear Regression - Residual Statistics[/C][/ROW]
[ROW][C]Residual Standard Deviation[/C][C]4.41081407999703[/C][/ROW]
[ROW][C]Sum Squared Residuals[/C][C]1128.40628920140[/C][/ROW]
[/TABLE]
Source: https://freestatistics.org/blog/index.php?pk=7933&T=3

Globally Unique Identifier (entire table): ba.freestatistics.org/blog/index.php?pk=7933&T=3

As an alternative you can also use a QR Code:  

The GUIDs for individual cells are displayed in the table below:

Multiple Linear Regression - Regression Statistics
Multiple R0.910125143298849
R-squared0.82832777646475
Adjusted R-squared0.78984951946547
F-TEST (value)21.5271647174726
F-TEST (DF numerator)13
F-TEST (DF denominator)58
p-value0
Multiple Linear Regression - Residual Statistics
Residual Standard Deviation4.41081407999703
Sum Squared Residuals1128.40628920140


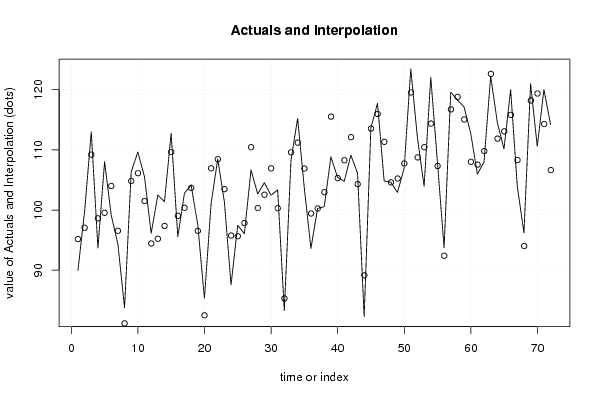
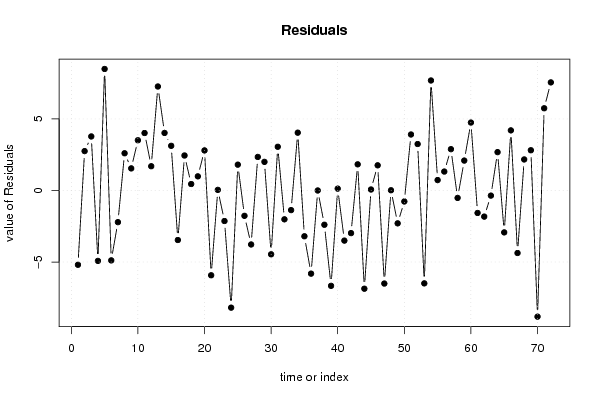
Multiple Linear Regression - Actuals, Interpolation, and Residuals
Time or IndexActualsInterpolationForecastResidualsPrediction Error
189.9795.1620777139252-5.1920777139252
299.897.05181394044382.74818605955620
3112.99109.2176296209373.77237037906297
493.6998.6123489840646-4.92234898406459
5108.0299.5318165773938.48818342260697
699.11103.996591972756-4.88659197275576
794.3396.5442519063674-2.21425190636739
883.7581.15183472850532.59816527149473
9106.37104.8298799898151.540120010185
10109.63106.1240186403643.50598135963589
11105.5101.4879537655144.01204623448553
1296.1394.43789445246941.69210554753064
13102.4895.21721325752827.2627867424718
14101.3797.35255320744574.0174467925543
15112.76109.6420671135933.1179328864075
1695.5799.033201020904-3.46320102090404
17102.81100.3685814888942.44141851110625
18104.13103.6824255673060.447574432694119
1997.5296.53484924528140.985150754718628
2085.2982.49414891006842.79585108993161
21101.01106.935896260196-5.92589626019584
22108.48108.4397840759840.0402159240164185
23101.33103.466686354426-2.1366863544257
2487.5795.7569031712282-8.18690317122823
2597.4495.63806529436761.80193470563236
2696.0697.83256526525-1.7725652652499
27106.67110.444770194841-3.77477019484081
28102.67100.3289042768592.34109572314142
29104.54102.5427214197791.99727858022055
30102.46106.921445875557-4.4614458755571
31103.35100.2991388305833.05086116941675
3283.2785.286779969222-2.01677996922196
33108.22109.592279998340-1.37227999833967
34115.23111.1947678490694.03523215093135
35103.7106.901114004651-3.20111400465140
3693.6199.4207999936808-5.81079999368084
37100.25100.252107908072-0.00210790807231687
38100.56102.955742604833-2.39574260483303
39108.86115.524922064631-6.6649220646314
40105.43105.3032852000760.126714799924179
41104.77108.273633520182-3.50363352018231
42109.13112.109161419829-2.97916141982905
43106.13104.3054466834681.82455331653179
4482.2789.1335350382929-6.86353503829289
45113.6113.5340496465360.0659503534641888
46117.73115.9737414303111.75625856968858
47104.83111.334091099646-6.50409109964577
48104.61104.5977591705050.0122408294953484
49102.93105.228281559198-2.29828155919758
50106.95107.720374362812-0.770374362811615
51123.45119.5401935570563.90980644294354
52111.99108.7484692177503.24153078225034
53103.95110.442395267344-6.49239526734394
54122.05114.3675595623927.68244043760818
55108.04107.3149978194930.725002180507494
5693.7292.39944626516441.32055373483555
57119.61116.7264590291782.88354097082157
58118.29118.811190687166-0.521190687165538
59117.14115.0517697593392.08823024066094
60112.76108.0160522695584.74394773044186
61105.97107.542254266909-1.57225426690906
62107.96109.786950619216-1.82695061921596
63122.27122.630417448942-0.360417448941798
64114.54111.8637913003472.67620869965269
65110.15113.080851726408-2.93085172640753
66120.02115.8228156021604.19718439783961
67103.94108.311315514807-4.37131551480727
6896.1894.0142550887472.16574491125296
69121.01118.2014350759352.80856492406475
70110.55119.366497317107-8.8164973171067
71120.04114.2983850164245.7416149835764
72114.19106.6405909425597.54940905744121

\begin{tabular}{lllllllll}
\hline
Multiple Linear Regression - Actuals, Interpolation, and Residuals \tabularnewline
Time or Index & Actuals & InterpolationForecast & ResidualsPrediction Error \tabularnewline
1 & 89.97 & 95.1620777139252 & -5.1920777139252 \tabularnewline
2 & 99.8 & 97.0518139404438 & 2.74818605955620 \tabularnewline
3 & 112.99 & 109.217629620937 & 3.77237037906297 \tabularnewline
4 & 93.69 & 98.6123489840646 & -4.92234898406459 \tabularnewline
5 & 108.02 & 99.531816577393 & 8.48818342260697 \tabularnewline
6 & 99.11 & 103.996591972756 & -4.88659197275576 \tabularnewline
7 & 94.33 & 96.5442519063674 & -2.21425190636739 \tabularnewline
8 & 83.75 & 81.1518347285053 & 2.59816527149473 \tabularnewline
9 & 106.37 & 104.829879989815 & 1.540120010185 \tabularnewline
10 & 109.63 & 106.124018640364 & 3.50598135963589 \tabularnewline
11 & 105.5 & 101.487953765514 & 4.01204623448553 \tabularnewline
12 & 96.13 & 94.4378944524694 & 1.69210554753064 \tabularnewline
13 & 102.48 & 95.2172132575282 & 7.2627867424718 \tabularnewline
14 & 101.37 & 97.3525532074457 & 4.0174467925543 \tabularnewline
15 & 112.76 & 109.642067113593 & 3.1179328864075 \tabularnewline
16 & 95.57 & 99.033201020904 & -3.46320102090404 \tabularnewline
17 & 102.81 & 100.368581488894 & 2.44141851110625 \tabularnewline
18 & 104.13 & 103.682425567306 & 0.447574432694119 \tabularnewline
19 & 97.52 & 96.5348492452814 & 0.985150754718628 \tabularnewline
20 & 85.29 & 82.4941489100684 & 2.79585108993161 \tabularnewline
21 & 101.01 & 106.935896260196 & -5.92589626019584 \tabularnewline
22 & 108.48 & 108.439784075984 & 0.0402159240164185 \tabularnewline
23 & 101.33 & 103.466686354426 & -2.1366863544257 \tabularnewline
24 & 87.57 & 95.7569031712282 & -8.18690317122823 \tabularnewline
25 & 97.44 & 95.6380652943676 & 1.80193470563236 \tabularnewline
26 & 96.06 & 97.83256526525 & -1.7725652652499 \tabularnewline
27 & 106.67 & 110.444770194841 & -3.77477019484081 \tabularnewline
28 & 102.67 & 100.328904276859 & 2.34109572314142 \tabularnewline
29 & 104.54 & 102.542721419779 & 1.99727858022055 \tabularnewline
30 & 102.46 & 106.921445875557 & -4.4614458755571 \tabularnewline
31 & 103.35 & 100.299138830583 & 3.05086116941675 \tabularnewline
32 & 83.27 & 85.286779969222 & -2.01677996922196 \tabularnewline
33 & 108.22 & 109.592279998340 & -1.37227999833967 \tabularnewline
34 & 115.23 & 111.194767849069 & 4.03523215093135 \tabularnewline
35 & 103.7 & 106.901114004651 & -3.20111400465140 \tabularnewline
36 & 93.61 & 99.4207999936808 & -5.81079999368084 \tabularnewline
37 & 100.25 & 100.252107908072 & -0.00210790807231687 \tabularnewline
38 & 100.56 & 102.955742604833 & -2.39574260483303 \tabularnewline
39 & 108.86 & 115.524922064631 & -6.6649220646314 \tabularnewline
40 & 105.43 & 105.303285200076 & 0.126714799924179 \tabularnewline
41 & 104.77 & 108.273633520182 & -3.50363352018231 \tabularnewline
42 & 109.13 & 112.109161419829 & -2.97916141982905 \tabularnewline
43 & 106.13 & 104.305446683468 & 1.82455331653179 \tabularnewline
44 & 82.27 & 89.1335350382929 & -6.86353503829289 \tabularnewline
45 & 113.6 & 113.534049646536 & 0.0659503534641888 \tabularnewline
46 & 117.73 & 115.973741430311 & 1.75625856968858 \tabularnewline
47 & 104.83 & 111.334091099646 & -6.50409109964577 \tabularnewline
48 & 104.61 & 104.597759170505 & 0.0122408294953484 \tabularnewline
49 & 102.93 & 105.228281559198 & -2.29828155919758 \tabularnewline
50 & 106.95 & 107.720374362812 & -0.770374362811615 \tabularnewline
51 & 123.45 & 119.540193557056 & 3.90980644294354 \tabularnewline
52 & 111.99 & 108.748469217750 & 3.24153078225034 \tabularnewline
53 & 103.95 & 110.442395267344 & -6.49239526734394 \tabularnewline
54 & 122.05 & 114.367559562392 & 7.68244043760818 \tabularnewline
55 & 108.04 & 107.314997819493 & 0.725002180507494 \tabularnewline
56 & 93.72 & 92.3994462651644 & 1.32055373483555 \tabularnewline
57 & 119.61 & 116.726459029178 & 2.88354097082157 \tabularnewline
58 & 118.29 & 118.811190687166 & -0.521190687165538 \tabularnewline
59 & 117.14 & 115.051769759339 & 2.08823024066094 \tabularnewline
60 & 112.76 & 108.016052269558 & 4.74394773044186 \tabularnewline
61 & 105.97 & 107.542254266909 & -1.57225426690906 \tabularnewline
62 & 107.96 & 109.786950619216 & -1.82695061921596 \tabularnewline
63 & 122.27 & 122.630417448942 & -0.360417448941798 \tabularnewline
64 & 114.54 & 111.863791300347 & 2.67620869965269 \tabularnewline
65 & 110.15 & 113.080851726408 & -2.93085172640753 \tabularnewline
66 & 120.02 & 115.822815602160 & 4.19718439783961 \tabularnewline
67 & 103.94 & 108.311315514807 & -4.37131551480727 \tabularnewline
68 & 96.18 & 94.014255088747 & 2.16574491125296 \tabularnewline
69 & 121.01 & 118.201435075935 & 2.80856492406475 \tabularnewline
70 & 110.55 & 119.366497317107 & -8.8164973171067 \tabularnewline
71 & 120.04 & 114.298385016424 & 5.7416149835764 \tabularnewline
72 & 114.19 & 106.640590942559 & 7.54940905744121 \tabularnewline
\hline
\end{tabular}
%Source: https://freestatistics.org/blog/index.php?pk=7933&T=4

[TABLE]
[ROW][C]Multiple Linear Regression - Actuals, Interpolation, and Residuals[/C][/ROW]
[ROW][C]Time or Index[/C][C]Actuals[/C][C]InterpolationForecast[/C][C]ResidualsPrediction Error[/C][/ROW]
[ROW][C]1[/C][C]89.97[/C][C]95.1620777139252[/C][C]-5.1920777139252[/C][/ROW]
[ROW][C]2[/C][C]99.8[/C][C]97.0518139404438[/C][C]2.74818605955620[/C][/ROW]
[ROW][C]3[/C][C]112.99[/C][C]109.217629620937[/C][C]3.77237037906297[/C][/ROW]
[ROW][C]4[/C][C]93.69[/C][C]98.6123489840646[/C][C]-4.92234898406459[/C][/ROW]
[ROW][C]5[/C][C]108.02[/C][C]99.531816577393[/C][C]8.48818342260697[/C][/ROW]
[ROW][C]6[/C][C]99.11[/C][C]103.996591972756[/C][C]-4.88659197275576[/C][/ROW]
[ROW][C]7[/C][C]94.33[/C][C]96.5442519063674[/C][C]-2.21425190636739[/C][/ROW]
[ROW][C]8[/C][C]83.75[/C][C]81.1518347285053[/C][C]2.59816527149473[/C][/ROW]
[ROW][C]9[/C][C]106.37[/C][C]104.829879989815[/C][C]1.540120010185[/C][/ROW]
[ROW][C]10[/C][C]109.63[/C][C]106.124018640364[/C][C]3.50598135963589[/C][/ROW]
[ROW][C]11[/C][C]105.5[/C][C]101.487953765514[/C][C]4.01204623448553[/C][/ROW]
[ROW][C]12[/C][C]96.13[/C][C]94.4378944524694[/C][C]1.69210554753064[/C][/ROW]
[ROW][C]13[/C][C]102.48[/C][C]95.2172132575282[/C][C]7.2627867424718[/C][/ROW]
[ROW][C]14[/C][C]101.37[/C][C]97.3525532074457[/C][C]4.0174467925543[/C][/ROW]
[ROW][C]15[/C][C]112.76[/C][C]109.642067113593[/C][C]3.1179328864075[/C][/ROW]
[ROW][C]16[/C][C]95.57[/C][C]99.033201020904[/C][C]-3.46320102090404[/C][/ROW]
[ROW][C]17[/C][C]102.81[/C][C]100.368581488894[/C][C]2.44141851110625[/C][/ROW]
[ROW][C]18[/C][C]104.13[/C][C]103.682425567306[/C][C]0.447574432694119[/C][/ROW]
[ROW][C]19[/C][C]97.52[/C][C]96.5348492452814[/C][C]0.985150754718628[/C][/ROW]
[ROW][C]20[/C][C]85.29[/C][C]82.4941489100684[/C][C]2.79585108993161[/C][/ROW]
[ROW][C]21[/C][C]101.01[/C][C]106.935896260196[/C][C]-5.92589626019584[/C][/ROW]
[ROW][C]22[/C][C]108.48[/C][C]108.439784075984[/C][C]0.0402159240164185[/C][/ROW]
[ROW][C]23[/C][C]101.33[/C][C]103.466686354426[/C][C]-2.1366863544257[/C][/ROW]
[ROW][C]24[/C][C]87.57[/C][C]95.7569031712282[/C][C]-8.18690317122823[/C][/ROW]
[ROW][C]25[/C][C]97.44[/C][C]95.6380652943676[/C][C]1.80193470563236[/C][/ROW]
[ROW][C]26[/C][C]96.06[/C][C]97.83256526525[/C][C]-1.7725652652499[/C][/ROW]
[ROW][C]27[/C][C]106.67[/C][C]110.444770194841[/C][C]-3.77477019484081[/C][/ROW]
[ROW][C]28[/C][C]102.67[/C][C]100.328904276859[/C][C]2.34109572314142[/C][/ROW]
[ROW][C]29[/C][C]104.54[/C][C]102.542721419779[/C][C]1.99727858022055[/C][/ROW]
[ROW][C]30[/C][C]102.46[/C][C]106.921445875557[/C][C]-4.4614458755571[/C][/ROW]
[ROW][C]31[/C][C]103.35[/C][C]100.299138830583[/C][C]3.05086116941675[/C][/ROW]
[ROW][C]32[/C][C]83.27[/C][C]85.286779969222[/C][C]-2.01677996922196[/C][/ROW]
[ROW][C]33[/C][C]108.22[/C][C]109.592279998340[/C][C]-1.37227999833967[/C][/ROW]
[ROW][C]34[/C][C]115.23[/C][C]111.194767849069[/C][C]4.03523215093135[/C][/ROW]
[ROW][C]35[/C][C]103.7[/C][C]106.901114004651[/C][C]-3.20111400465140[/C][/ROW]
[ROW][C]36[/C][C]93.61[/C][C]99.4207999936808[/C][C]-5.81079999368084[/C][/ROW]
[ROW][C]37[/C][C]100.25[/C][C]100.252107908072[/C][C]-0.00210790807231687[/C][/ROW]
[ROW][C]38[/C][C]100.56[/C][C]102.955742604833[/C][C]-2.39574260483303[/C][/ROW]
[ROW][C]39[/C][C]108.86[/C][C]115.524922064631[/C][C]-6.6649220646314[/C][/ROW]
[ROW][C]40[/C][C]105.43[/C][C]105.303285200076[/C][C]0.126714799924179[/C][/ROW]
[ROW][C]41[/C][C]104.77[/C][C]108.273633520182[/C][C]-3.50363352018231[/C][/ROW]
[ROW][C]42[/C][C]109.13[/C][C]112.109161419829[/C][C]-2.97916141982905[/C][/ROW]
[ROW][C]43[/C][C]106.13[/C][C]104.305446683468[/C][C]1.82455331653179[/C][/ROW]
[ROW][C]44[/C][C]82.27[/C][C]89.1335350382929[/C][C]-6.86353503829289[/C][/ROW]
[ROW][C]45[/C][C]113.6[/C][C]113.534049646536[/C][C]0.0659503534641888[/C][/ROW]
[ROW][C]46[/C][C]117.73[/C][C]115.973741430311[/C][C]1.75625856968858[/C][/ROW]
[ROW][C]47[/C][C]104.83[/C][C]111.334091099646[/C][C]-6.50409109964577[/C][/ROW]
[ROW][C]48[/C][C]104.61[/C][C]104.597759170505[/C][C]0.0122408294953484[/C][/ROW]
[ROW][C]49[/C][C]102.93[/C][C]105.228281559198[/C][C]-2.29828155919758[/C][/ROW]
[ROW][C]50[/C][C]106.95[/C][C]107.720374362812[/C][C]-0.770374362811615[/C][/ROW]
[ROW][C]51[/C][C]123.45[/C][C]119.540193557056[/C][C]3.90980644294354[/C][/ROW]
[ROW][C]52[/C][C]111.99[/C][C]108.748469217750[/C][C]3.24153078225034[/C][/ROW]
[ROW][C]53[/C][C]103.95[/C][C]110.442395267344[/C][C]-6.49239526734394[/C][/ROW]
[ROW][C]54[/C][C]122.05[/C][C]114.367559562392[/C][C]7.68244043760818[/C][/ROW]
[ROW][C]55[/C][C]108.04[/C][C]107.314997819493[/C][C]0.725002180507494[/C][/ROW]
[ROW][C]56[/C][C]93.72[/C][C]92.3994462651644[/C][C]1.32055373483555[/C][/ROW]
[ROW][C]57[/C][C]119.61[/C][C]116.726459029178[/C][C]2.88354097082157[/C][/ROW]
[ROW][C]58[/C][C]118.29[/C][C]118.811190687166[/C][C]-0.521190687165538[/C][/ROW]
[ROW][C]59[/C][C]117.14[/C][C]115.051769759339[/C][C]2.08823024066094[/C][/ROW]
[ROW][C]60[/C][C]112.76[/C][C]108.016052269558[/C][C]4.74394773044186[/C][/ROW]
[ROW][C]61[/C][C]105.97[/C][C]107.542254266909[/C][C]-1.57225426690906[/C][/ROW]
[ROW][C]62[/C][C]107.96[/C][C]109.786950619216[/C][C]-1.82695061921596[/C][/ROW]
[ROW][C]63[/C][C]122.27[/C][C]122.630417448942[/C][C]-0.360417448941798[/C][/ROW]
[ROW][C]64[/C][C]114.54[/C][C]111.863791300347[/C][C]2.67620869965269[/C][/ROW]
[ROW][C]65[/C][C]110.15[/C][C]113.080851726408[/C][C]-2.93085172640753[/C][/ROW]
[ROW][C]66[/C][C]120.02[/C][C]115.822815602160[/C][C]4.19718439783961[/C][/ROW]
[ROW][C]67[/C][C]103.94[/C][C]108.311315514807[/C][C]-4.37131551480727[/C][/ROW]
[ROW][C]68[/C][C]96.18[/C][C]94.014255088747[/C][C]2.16574491125296[/C][/ROW]
[ROW][C]69[/C][C]121.01[/C][C]118.201435075935[/C][C]2.80856492406475[/C][/ROW]
[ROW][C]70[/C][C]110.55[/C][C]119.366497317107[/C][C]-8.8164973171067[/C][/ROW]
[ROW][C]71[/C][C]120.04[/C][C]114.298385016424[/C][C]5.7416149835764[/C][/ROW]
[ROW][C]72[/C][C]114.19[/C][C]106.640590942559[/C][C]7.54940905744121[/C][/ROW]
[/TABLE]
Source: https://freestatistics.org/blog/index.php?pk=7933&T=4

Globally Unique Identifier (entire table): ba.freestatistics.org/blog/index.php?pk=7933&T=4

As an alternative you can also use a QR Code:  

The GUIDs for individual cells are displayed in the table below:

Multiple Linear Regression - Actuals, Interpolation, and Residuals
Time or IndexActualsInterpolationForecastResidualsPrediction Error
189.9795.1620777139252-5.1920777139252
299.897.05181394044382.74818605955620
3112.99109.2176296209373.77237037906297
493.6998.6123489840646-4.92234898406459
5108.0299.5318165773938.48818342260697
699.11103.996591972756-4.88659197275576
794.3396.5442519063674-2.21425190636739
883.7581.15183472850532.59816527149473
9106.37104.8298799898151.540120010185
10109.63106.1240186403643.50598135963589
11105.5101.4879537655144.01204623448553
1296.1394.43789445246941.69210554753064
13102.4895.21721325752827.2627867424718
14101.3797.35255320744574.0174467925543
15112.76109.6420671135933.1179328864075
1695.5799.033201020904-3.46320102090404
17102.81100.3685814888942.44141851110625
18104.13103.6824255673060.447574432694119
1997.5296.53484924528140.985150754718628
2085.2982.49414891006842.79585108993161
21101.01106.935896260196-5.92589626019584
22108.48108.4397840759840.0402159240164185
23101.33103.466686354426-2.1366863544257
2487.5795.7569031712282-8.18690317122823
2597.4495.63806529436761.80193470563236
2696.0697.83256526525-1.7725652652499
27106.67110.444770194841-3.77477019484081
28102.67100.3289042768592.34109572314142
29104.54102.5427214197791.99727858022055
30102.46106.921445875557-4.4614458755571
31103.35100.2991388305833.05086116941675
3283.2785.286779969222-2.01677996922196
33108.22109.592279998340-1.37227999833967
34115.23111.1947678490694.03523215093135
35103.7106.901114004651-3.20111400465140
3693.6199.4207999936808-5.81079999368084
37100.25100.252107908072-0.00210790807231687
38100.56102.955742604833-2.39574260483303
39108.86115.524922064631-6.6649220646314
40105.43105.3032852000760.126714799924179
41104.77108.273633520182-3.50363352018231
42109.13112.109161419829-2.97916141982905
43106.13104.3054466834681.82455331653179
4482.2789.1335350382929-6.86353503829289
45113.6113.5340496465360.0659503534641888
46117.73115.9737414303111.75625856968858
47104.83111.334091099646-6.50409109964577
48104.61104.5977591705050.0122408294953484
49102.93105.228281559198-2.29828155919758
50106.95107.720374362812-0.770374362811615
51123.45119.5401935570563.90980644294354
52111.99108.7484692177503.24153078225034
53103.95110.442395267344-6.49239526734394
54122.05114.3675595623927.68244043760818
55108.04107.3149978194930.725002180507494
5693.7292.39944626516441.32055373483555
57119.61116.7264590291782.88354097082157
58118.29118.811190687166-0.521190687165538
59117.14115.0517697593392.08823024066094
60112.76108.0160522695584.74394773044186
61105.97107.542254266909-1.57225426690906
62107.96109.786950619216-1.82695061921596
63122.27122.630417448942-0.360417448941798
64114.54111.8637913003472.67620869965269
65110.15113.080851726408-2.93085172640753
66120.02115.8228156021604.19718439783961
67103.94108.311315514807-4.37131551480727
6896.1894.0142550887472.16574491125296
69121.01118.2014350759352.80856492406475
70110.55119.366497317107-8.8164973171067
71120.04114.2983850164245.7416149835764
72114.19106.6405909425597.54940905744121


Parameters (Session):
par1 = 2 ; par2 = Include Monthly Dummies ; par3 = Linear Trend ;
Parameters (R input):
par1 = 2 ; par2 = Include Monthly Dummies ; par3 = Linear Trend ;
R code (references can be found in the software module):
library(lattice)
par1 <- as.numeric(par1)
x <- t(y)
k <- length(x[1,])
n <- length(x[,1])
x1 <- cbind(x[,par1], x[,1:k!=par1])
mycolnames <- c(colnames(x)[par1], colnames(x)[1:k!=par1])
colnames(x1) <- mycolnames #colnames(x)[par1]
x <- x1
if (par3 == 'First Differences'){
x2 <- array(0, dim=c(n-1,k), dimnames=list(1:(n-1), paste('(1-B)',colnames(x),sep='')))
for (i in 1:n-1) {
for (j in 1:k) {
x2[i,j] <- x[i+1,j] - x[i,j]
}
}
x <- x2
}
if (par2 == 'Include Monthly Dummies'){
x2 <- array(0, dim=c(n,11), dimnames=list(1:n, paste('M', seq(1:11), sep ='')))
for (i in 1:11){
x2[seq(i,n,12),i] <- 1
}
x <- cbind(x, x2)
}
if (par2 == 'Include Quarterly Dummies'){
x2 <- array(0, dim=c(n,3), dimnames=list(1:n, paste('Q', seq(1:3), sep ='')))
for (i in 1:3){
x2[seq(i,n,4),i] <- 1
}
x <- cbind(x, x2)
}
k <- length(x[1,])
if (par3 == 'Linear Trend'){
x <- cbind(x, c(1:n))
colnames(x)[k+1] <- 't'
}
x
k <- length(x[1,])
df <- as.data.frame(x)
(mylm <- lm(df))
(mysum <- summary(mylm))
bitmap(file='test0.png')
plot(x[,1], type='l', main='Actuals and Interpolation', ylab='value of Actuals and Interpolation (dots)', xlab='time or index')
points(x[,1]-mysum$resid)
grid()
dev.off()
bitmap(file='test1.png')
plot(mysum$resid, type='b', pch=19, main='Residuals', ylab='value of Residuals', xlab='time or index')
grid()
dev.off()
bitmap(file='test2.png')
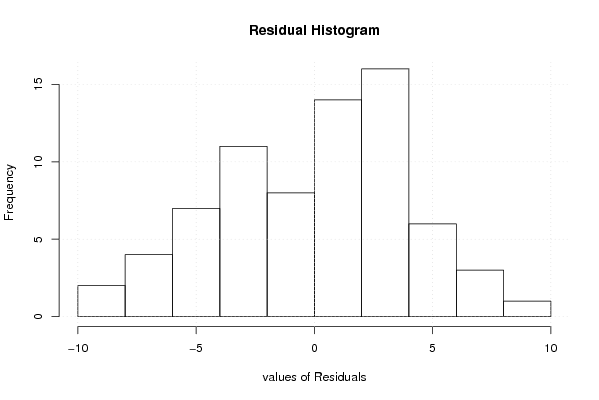
hist(mysum$resid, main='Residual Histogram', xlab='values of Residuals')
grid()
dev.off()
bitmap(file='test3.png')
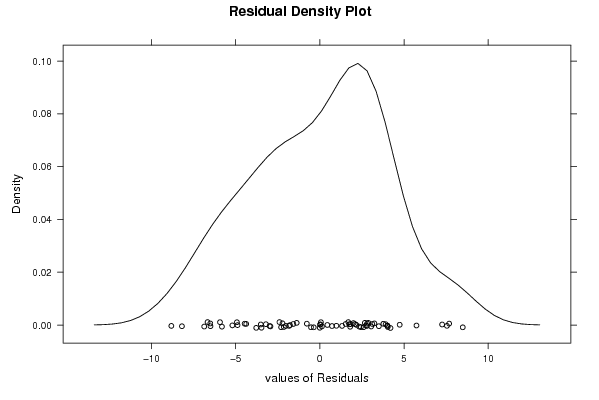
densityplot(~mysum$resid,col='black',main='Residual Density Plot', xlab='values of Residuals')
dev.off()
bitmap(file='test4.png')
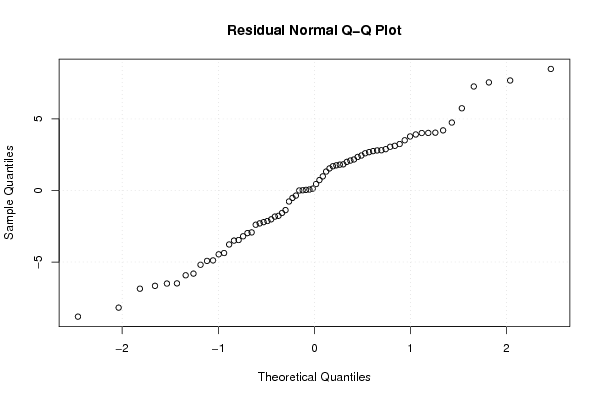
qqnorm(mysum$resid, main='Residual Normal Q-Q Plot')
grid()
dev.off()
(myerror <- as.ts(mysum$resid))
bitmap(file='test5.png')
dum <- cbind(lag(myerror,k=1),myerror)
dum
dum1 <- dum[2:length(myerror),]
dum1
z <- as.data.frame(dum1)
z
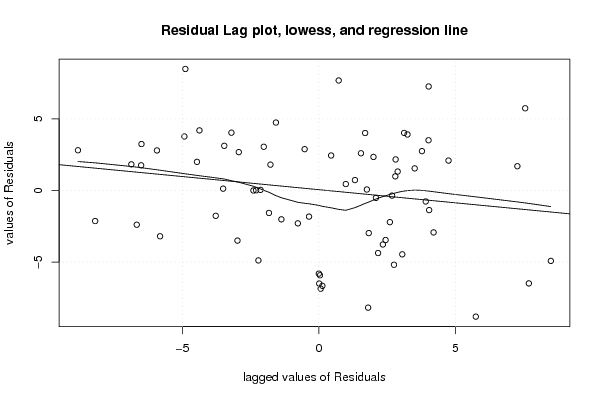
plot(z,main=paste('Residual Lag plot, lowess, and regression line'), ylab='values of Residuals', xlab='lagged values of Residuals')
lines(lowess(z))
abline(lm(z))
grid()
dev.off()
bitmap(file='test6.png')
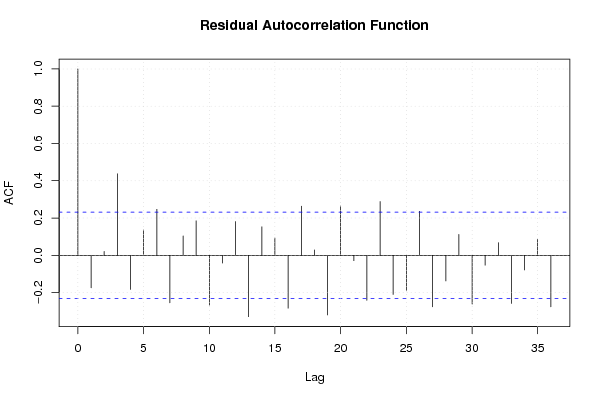
acf(mysum$resid, lag.max=length(mysum$resid)/2, main='Residual Autocorrelation Function')
grid()
dev.off()
bitmap(file='test7.png')
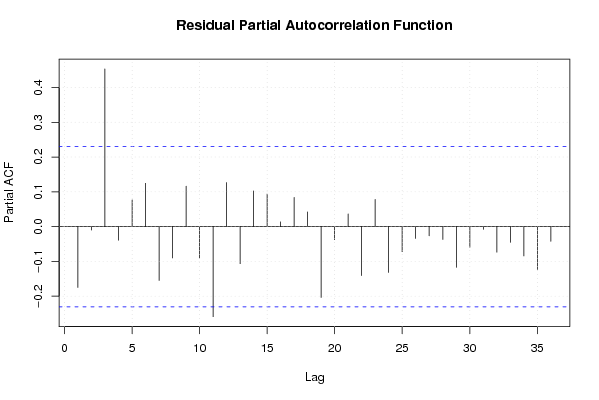
pacf(mysum$resid, lag.max=length(mysum$resid)/2, main='Residual Partial Autocorrelation Function')
grid()
dev.off()
bitmap(file='test8.png')
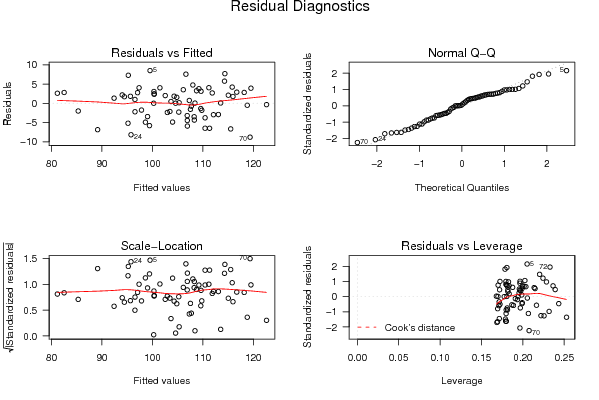
opar <- par(mfrow = c(2,2), oma = c(0, 0, 1.1, 0))
plot(mylm, las = 1, sub='Residual Diagnostics')
par(opar)
dev.off()
load(file='createtable')
a<-table.start()
a<-table.row.start(a)
a<-table.element(a, 'Multiple Linear Regression - Estimated Regression Equation', 1, TRUE)
a<-table.row.end(a)
myeq <- colnames(x)[1]
myeq <- paste(myeq, '[t] = ', sep='')
for (i in 1:k){
if (mysum$coefficients[i,1] > 0) myeq <- paste(myeq, '+', '')
myeq <- paste(myeq, mysum$coefficients[i,1], sep=' ')
if (rownames(mysum$coefficients)[i] != '(Intercept)') {
myeq <- paste(myeq, rownames(mysum$coefficients)[i], sep='')
if (rownames(mysum$coefficients)[i] != 't') myeq <- paste(myeq, '[t]', sep='')
}
}
myeq <- paste(myeq, ' + e[t]')
a<-table.row.start(a)
a<-table.element(a, myeq)
a<-table.row.end(a)
a<-table.end(a)
table.save(a,file='mytable1.tab')
a<-table.start()
a<-table.row.start(a)
a<-table.element(a,hyperlink('ols1.htm','Multiple Linear Regression - Ordinary Least Squares',''), 6, TRUE)
a<-table.row.end(a)
a<-table.row.start(a)
a<-table.element(a,'Variable',header=TRUE)
a<-table.element(a,'Parameter',header=TRUE)
a<-table.element(a,'S.D.',header=TRUE)
a<-table.element(a,'T-STAT
H0: parameter = 0',header=TRUE)
a<-table.element(a,'2-tail p-value',header=TRUE)
a<-table.element(a,'1-tail p-value',header=TRUE)
a<-table.row.end(a)
for (i in 1:k){
a<-table.row.start(a)
a<-table.element(a,rownames(mysum$coefficients)[i],header=TRUE)
a<-table.element(a,mysum$coefficients[i,1])
a<-table.element(a, round(mysum$coefficients[i,2],6))
a<-table.element(a, round(mysum$coefficients[i,3],4))
a<-table.element(a, round(mysum$coefficients[i,4],6))
a<-table.element(a, round(mysum$coefficients[i,4]/2,6))
a<-table.row.end(a)
}
a<-table.end(a)
table.save(a,file='mytable2.tab')
a<-table.start()
a<-table.row.start(a)
a<-table.element(a, 'Multiple Linear Regression - Regression Statistics', 2, TRUE)
a<-table.row.end(a)
a<-table.row.start(a)
a<-table.element(a, 'Multiple R',1,TRUE)
a<-table.element(a, sqrt(mysum$r.squared))
a<-table.row.end(a)
a<-table.row.start(a)
a<-table.element(a, 'R-squared',1,TRUE)
a<-table.element(a, mysum$r.squared)
a<-table.row.end(a)
a<-table.row.start(a)
a<-table.element(a, 'Adjusted R-squared',1,TRUE)
a<-table.element(a, mysum$adj.r.squared)
a<-table.row.end(a)
a<-table.row.start(a)
a<-table.element(a, 'F-TEST (value)',1,TRUE)
a<-table.element(a, mysum$fstatistic[1])
a<-table.row.end(a)
a<-table.row.start(a)
a<-table.element(a, 'F-TEST (DF numerator)',1,TRUE)
a<-table.element(a, mysum$fstatistic[2])
a<-table.row.end(a)
a<-table.row.start(a)
a<-table.element(a, 'F-TEST (DF denominator)',1,TRUE)
a<-table.element(a, mysum$fstatistic[3])
a<-table.row.end(a)
a<-table.row.start(a)
a<-table.element(a, 'p-value',1,TRUE)
a<-table.element(a, 1-pf(mysum$fstatistic[1],mysum$fstatistic[2],mysum$fstatistic[3]))
a<-table.row.end(a)
a<-table.row.start(a)
a<-table.element(a, 'Multiple Linear Regression - Residual Statistics', 2, TRUE)
a<-table.row.end(a)
a<-table.row.start(a)
a<-table.element(a, 'Residual Standard Deviation',1,TRUE)
a<-table.element(a, mysum$sigma)
a<-table.row.end(a)
a<-table.row.start(a)
a<-table.element(a, 'Sum Squared Residuals',1,TRUE)
a<-table.element(a, sum(myerror*myerror))
a<-table.row.end(a)
a<-table.end(a)
table.save(a,file='mytable3.tab')
a<-table.start()
a<-table.row.start(a)
a<-table.element(a, 'Multiple Linear Regression - Actuals, Interpolation, and Residuals', 4, TRUE)
a<-table.row.end(a)
a<-table.row.start(a)
a<-table.element(a, 'Time or Index', 1, TRUE)
a<-table.element(a, 'Actuals', 1, TRUE)
a<-table.element(a, 'Interpolation
Forecast', 1, TRUE)
a<-table.element(a, 'Residuals
Prediction Error', 1, TRUE)
a<-table.row.end(a)
for (i in 1:n) {
a<-table.row.start(a)
a<-table.element(a,i, 1, TRUE)
a<-table.element(a,x[i])
a<-table.element(a,x[i]-mysum$resid[i])
a<-table.element(a,mysum$resid[i])
a<-table.row.end(a)
}
a<-table.end(a)
table.save(a,file='mytable4.tab')