Free Statistics

of Irreproducible Research!

Author's title

Author*Unverified author*
R Software Modulerwasp_arimaforecasting.wasp
Title produced by softwareARIMA Forecasting
Date of computationWed, 09 Jan 2008 02:08:38 -0700
Cite this page as followsStatistical Computations at FreeStatistics.org, Office for Research Development and Education, URL https://freestatistics.org/blog/index.php?v=date/2008/Jan/09/t1199870009khyf77t4sfy2xjb.htm/, Retrieved Wed, 15 May 2024 12:34:33 +0000
Statistical Computations at FreeStatistics.org, Office for Research Development and Education, URL https://freestatistics.org/blog/index.php?pk=7931, Retrieved Wed, 15 May 2024 12:34:33 +0000
QR Codes:

Original text written by user:
IsPrivate?No (this computation is public)
User-defined keywords
Estimated Impact277
Family? (F = Feedback message, R = changed R code, M = changed R Module, P = changed Parameters, D = changed Data)
-       [ARIMA Forecasting] [BBP forecast] [2008-01-09 09:08:38] [d41d8cd98f00b204e9800998ecf8427e] [Current]
Feedback Forum

Post a new message
Dataseries X:
163414
163652
164603
165257
168731
171848
175032
179187
187369
194147
200145
203750
206464
205034
211782
244562
247059
255703
260218
268852
279436
281514
285458
288338
296369
302221
311016


Summary of compuational transaction
Raw Inputview raw input (R code)
Raw Outputview raw output of R engine
Computing time4 seconds
R Server'Gwilym Jenkins' @ 72.249.127.135

\begin{tabular}{lllllllll}
\hline
Summary of compuational transaction \tabularnewline
Raw Input & view raw input (R code)  \tabularnewline
Raw Output & view raw output of R engine  \tabularnewline
Computing time & 4 seconds \tabularnewline
R Server & 'Gwilym Jenkins' @ 72.249.127.135 \tabularnewline
\hline
\end{tabular}
%Source: https://freestatistics.org/blog/index.php?pk=7931&T=0

[TABLE]
[ROW][C]Summary of compuational transaction[/C][/ROW]
[ROW][C]Raw Input[/C][C]view raw input (R code) [/C][/ROW]
[ROW][C]Raw Output[/C][C]view raw output of R engine [/C][/ROW]
[ROW][C]Computing time[/C][C]4 seconds[/C][/ROW]
[ROW][C]R Server[/C][C]'Gwilym Jenkins' @ 72.249.127.135[/C][/ROW]
[/TABLE]
Source: https://freestatistics.org/blog/index.php?pk=7931&T=0

Globally Unique Identifier (entire table): ba.freestatistics.org/blog/index.php?pk=7931&T=0

As an alternative you can also use a QR Code:  

The GUIDs for individual cells are displayed in the table below:

Summary of compuational transaction
Raw Inputview raw input (R code)
Raw Outputview raw output of R engine
Computing time4 seconds
R Server'Gwilym Jenkins' @ 72.249.127.135


Univariate ARIMA Extrapolation Forecast
timeY[t]F[t]95% LB95% UBp-value(H0: Y[t] = F[t])P(F[t]>Y[t-1])P(F[t]>Y[t-s])P(F[t]>Y[22])
21279436-------
22281514-------
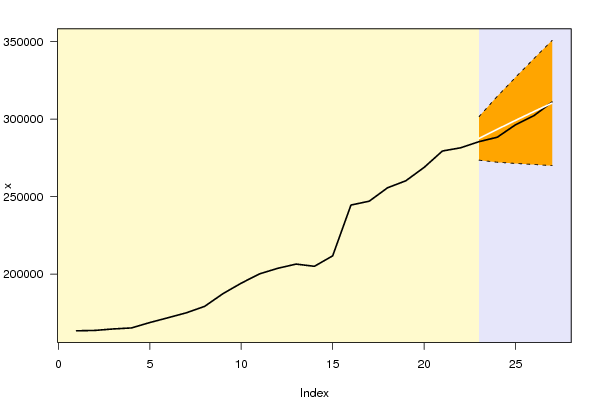
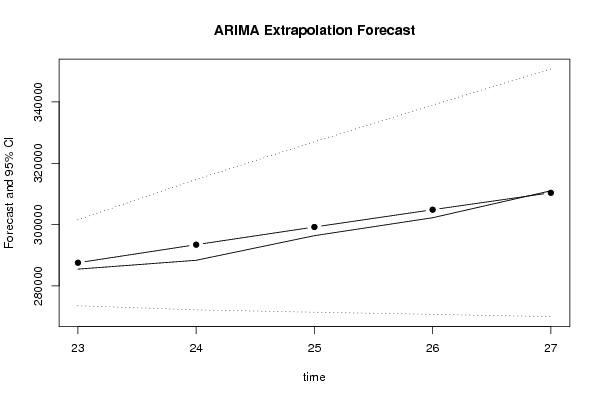
23285458287537.792273505.3734301570.21060.38570.79990.79990.7999
24288338293431.1686272153.8209314708.51620.31950.76870.76870.8638
25296369299196.9533271383.0456327010.8610.4210.77790.77790.8936
26302221304837.9085270701.6556338974.16140.44030.68660.68660.9097
27311016310356.7368269946.1073350767.36630.48720.65340.65340.9191

\begin{tabular}{lllllllll}
\hline
Univariate ARIMA Extrapolation Forecast \tabularnewline
time & Y[t] & F[t] & 95% LB & 95% UB & p-value(H0: Y[t] = F[t]) & P(F[t]>Y[t-1]) & P(F[t]>Y[t-s]) & P(F[t]>Y[22]) \tabularnewline
21 & 279436 & - & - & - & - & - & - & - \tabularnewline
22 & 281514 & - & - & - & - & - & - & - \tabularnewline
23 & 285458 & 287537.792 & 273505.3734 & 301570.2106 & 0.3857 & 0.7999 & 0.7999 & 0.7999 \tabularnewline
24 & 288338 & 293431.1686 & 272153.8209 & 314708.5162 & 0.3195 & 0.7687 & 0.7687 & 0.8638 \tabularnewline
25 & 296369 & 299196.9533 & 271383.0456 & 327010.861 & 0.421 & 0.7779 & 0.7779 & 0.8936 \tabularnewline
26 & 302221 & 304837.9085 & 270701.6556 & 338974.1614 & 0.4403 & 0.6866 & 0.6866 & 0.9097 \tabularnewline
27 & 311016 & 310356.7368 & 269946.1073 & 350767.3663 & 0.4872 & 0.6534 & 0.6534 & 0.9191 \tabularnewline
\hline
\end{tabular}
%Source: https://freestatistics.org/blog/index.php?pk=7931&T=1

[TABLE]
[ROW][C]Univariate ARIMA Extrapolation Forecast[/C][/ROW]
[ROW][C]time[/C][C]Y[t][/C][C]F[t][/C][C]95% LB[/C][C]95% UB[/C][C]p-value(H0: Y[t] = F[t])[/C][C]P(F[t]>Y[t-1])[/C][C]P(F[t]>Y[t-s])[/C][C]P(F[t]>Y[22])[/C][/ROW]
[ROW][C]21[/C][C]279436[/C][C]-[/C][C]-[/C][C]-[/C][C]-[/C][C]-[/C][C]-[/C][C]-[/C][/ROW]
[ROW][C]22[/C][C]281514[/C][C]-[/C][C]-[/C][C]-[/C][C]-[/C][C]-[/C][C]-[/C][C]-[/C][/ROW]
[ROW][C]23[/C][C]285458[/C][C]287537.792[/C][C]273505.3734[/C][C]301570.2106[/C][C]0.3857[/C][C]0.7999[/C][C]0.7999[/C][C]0.7999[/C][/ROW]
[ROW][C]24[/C][C]288338[/C][C]293431.1686[/C][C]272153.8209[/C][C]314708.5162[/C][C]0.3195[/C][C]0.7687[/C][C]0.7687[/C][C]0.8638[/C][/ROW]
[ROW][C]25[/C][C]296369[/C][C]299196.9533[/C][C]271383.0456[/C][C]327010.861[/C][C]0.421[/C][C]0.7779[/C][C]0.7779[/C][C]0.8936[/C][/ROW]
[ROW][C]26[/C][C]302221[/C][C]304837.9085[/C][C]270701.6556[/C][C]338974.1614[/C][C]0.4403[/C][C]0.6866[/C][C]0.6866[/C][C]0.9097[/C][/ROW]
[ROW][C]27[/C][C]311016[/C][C]310356.7368[/C][C]269946.1073[/C][C]350767.3663[/C][C]0.4872[/C][C]0.6534[/C][C]0.6534[/C][C]0.9191[/C][/ROW]
[/TABLE]
Source: https://freestatistics.org/blog/index.php?pk=7931&T=1

Globally Unique Identifier (entire table): ba.freestatistics.org/blog/index.php?pk=7931&T=1

As an alternative you can also use a QR Code:  

The GUIDs for individual cells are displayed in the table below:

Univariate ARIMA Extrapolation Forecast
timeY[t]F[t]95% LB95% UBp-value(H0: Y[t] = F[t])P(F[t]>Y[t-1])P(F[t]>Y[t-s])P(F[t]>Y[22])
21279436-------
22281514-------
23285458287537.792273505.3734301570.21060.38570.79990.79990.7999
24288338293431.1686272153.8209314708.51620.31950.76870.76870.8638
25296369299196.9533271383.0456327010.8610.4210.77790.77790.8936
26302221304837.9085270701.6556338974.16140.44030.68660.68660.9097
27311016310356.7368269946.1073350767.36630.48720.65340.65340.9191


Univariate ARIMA Extrapolation Forecast Performance
time% S.E.PEMAPESq.EMSERMSE
230.0249-0.00720.00144325534.6658865106.9332930.1112
240.037-0.01740.003525940366.16455188073.23292277.7342
250.0474-0.00950.00197997319.8861599463.97721264.6992
260.0571-0.00860.00176848210.21511369642.0431170.3171
270.06640.00214e-04434627.966886925.5934294.8315

\begin{tabular}{lllllllll}
\hline
Univariate ARIMA Extrapolation Forecast Performance \tabularnewline
time & % S.E. & PE & MAPE & Sq.E & MSE & RMSE \tabularnewline
23 & 0.0249 & -0.0072 & 0.0014 & 4325534.6658 & 865106.9332 & 930.1112 \tabularnewline
24 & 0.037 & -0.0174 & 0.0035 & 25940366.1645 & 5188073.2329 & 2277.7342 \tabularnewline
25 & 0.0474 & -0.0095 & 0.0019 & 7997319.886 & 1599463.9772 & 1264.6992 \tabularnewline
26 & 0.0571 & -0.0086 & 0.0017 & 6848210.2151 & 1369642.043 & 1170.3171 \tabularnewline
27 & 0.0664 & 0.0021 & 4e-04 & 434627.9668 & 86925.5934 & 294.8315 \tabularnewline
\hline
\end{tabular}
%Source: https://freestatistics.org/blog/index.php?pk=7931&T=2

[TABLE]
[ROW][C]Univariate ARIMA Extrapolation Forecast Performance[/C][/ROW]
[ROW][C]time[/C][C]% S.E.[/C][C]PE[/C][C]MAPE[/C][C]Sq.E[/C][C]MSE[/C][C]RMSE[/C][/ROW]
[ROW][C]23[/C][C]0.0249[/C][C]-0.0072[/C][C]0.0014[/C][C]4325534.6658[/C][C]865106.9332[/C][C]930.1112[/C][/ROW]
[ROW][C]24[/C][C]0.037[/C][C]-0.0174[/C][C]0.0035[/C][C]25940366.1645[/C][C]5188073.2329[/C][C]2277.7342[/C][/ROW]
[ROW][C]25[/C][C]0.0474[/C][C]-0.0095[/C][C]0.0019[/C][C]7997319.886[/C][C]1599463.9772[/C][C]1264.6992[/C][/ROW]
[ROW][C]26[/C][C]0.0571[/C][C]-0.0086[/C][C]0.0017[/C][C]6848210.2151[/C][C]1369642.043[/C][C]1170.3171[/C][/ROW]
[ROW][C]27[/C][C]0.0664[/C][C]0.0021[/C][C]4e-04[/C][C]434627.9668[/C][C]86925.5934[/C][C]294.8315[/C][/ROW]
[/TABLE]
Source: https://freestatistics.org/blog/index.php?pk=7931&T=2

Globally Unique Identifier (entire table): ba.freestatistics.org/blog/index.php?pk=7931&T=2

As an alternative you can also use a QR Code:  

The GUIDs for individual cells are displayed in the table below:

Univariate ARIMA Extrapolation Forecast Performance
time% S.E.PEMAPESq.EMSERMSE
230.0249-0.00720.00144325534.6658865106.9332930.1112
240.037-0.01740.003525940366.16455188073.23292277.7342
250.0474-0.00950.00197997319.8861599463.97721264.6992
260.0571-0.00860.00176848210.21511369642.0431170.3171
270.06640.00214e-04434627.966886925.5934294.8315


Parameters (Session):
par1 = 5 ; par2 = 1 ; par3 = 1 ; par4 = 0 ; par5 = 1 ; par6 = 1 ; par7 = 1 ; par8 = 0 ; par9 = 0 ; par10 = FALSE ;
Parameters (R input):
par1 = 5 ; par2 = 1 ; par3 = 1 ; par4 = 0 ; par5 = 1 ; par6 = 1 ; par7 = 1 ; par8 = 0 ; par9 = 0 ; par10 = FALSE ;
R code (references can be found in the software module):
par1 <- as.numeric(par1) #cut off periods
par2 <- as.numeric(par2) #lambda
par3 <- as.numeric(par3) #degree of non-seasonal differencing
par4 <- as.numeric(par4) #degree of seasonal differencing
par5 <- as.numeric(par5) #seasonal period
par6 <- as.numeric(par6) #p
par7 <- as.numeric(par7) #q
par8 <- as.numeric(par8) #P
par9 <- as.numeric(par9) #Q
if (par10 == 'TRUE') par10 <- TRUE
if (par10 == 'FALSE') par10 <- FALSE
if (par2 == 0) x <- log(x)
if (par2 != 0) x <- x^par2
lx <- length(x)
first <- lx - 2*par1
nx <- lx - par1
nx1 <- nx + 1
fx <- lx - nx
if (fx < 1) {
fx <- par5
nx1 <- lx + fx - 1
first <- lx - 2*fx
}
first <- 1
if (fx < 3) fx <- round(lx/10,0)
(arima.out <- arima(x[1:nx], order=c(par6,par3,par7), seasonal=list(order=c(par8,par4,par9), period=par5), include.mean=par10, method='ML'))
(forecast <- predict(arima.out,fx))
(lb <- forecast$pred - 1.96 * forecast$se)
(ub <- forecast$pred + 1.96 * forecast$se)
if (par2 == 0) {
x <- exp(x)
forecast$pred <- exp(forecast$pred)
lb <- exp(lb)
ub <- exp(ub)
}
if (par2 != 0) {
x <- x^(1/par2)
forecast$pred <- forecast$pred^(1/par2)
lb <- lb^(1/par2)
ub <- ub^(1/par2)
}
if (par2 < 0) {
olb <- lb
lb <- ub
ub <- olb
}
(actandfor <- c(x[1:nx], forecast$pred))
(perc.se <- (ub-forecast$pred)/1.96/forecast$pred)
bitmap(file='test1.png')
opar <- par(mar=c(4,4,2,2),las=1)
ylim <- c( min(x[first:nx],lb), max(x[first:nx],ub))
plot(x,ylim=ylim,type='n',xlim=c(first,lx))
usr <- par('usr')
rect(usr[1],usr[3],nx+1,usr[4],border=NA,col='lemonchiffon')
rect(nx1,usr[3],usr[2],usr[4],border=NA,col='lavender')
abline(h= (-3:3)*2 , col ='gray', lty =3)
polygon( c(nx1:lx,lx:nx1), c(lb,rev(ub)), col = 'orange', lty=2,border=NA)
lines(nx1:lx, lb , lty=2)
lines(nx1:lx, ub , lty=2)
lines(x, lwd=2)
lines(nx1:lx, forecast$pred , lwd=2 , col ='white')
box()
par(opar)
dev.off()
prob.dec <- array(NA, dim=fx)
prob.sdec <- array(NA, dim=fx)
prob.ldec <- array(NA, dim=fx)
prob.pval <- array(NA, dim=fx)
perf.pe <- array(0, dim=fx)
perf.mape <- array(0, dim=fx)
perf.se <- array(0, dim=fx)
perf.mse <- array(0, dim=fx)
perf.rmse <- array(0, dim=fx)
for (i in 1:fx) {
locSD <- (ub[i] - forecast$pred[i]) / 1.96
perf.pe[i] = (x[nx+i] - forecast$pred[i]) / forecast$pred[i]
perf.mape[i] = perf.mape[i] + abs(perf.pe[i])
perf.se[i] = (x[nx+i] - forecast$pred[i])^2
perf.mse[i] = perf.mse[i] + perf.se[i]
prob.dec[i] = pnorm((x[nx+i-1] - forecast$pred[i]) / locSD)
prob.sdec[i] = pnorm((x[nx+i-par5] - forecast$pred[i]) / locSD)
prob.ldec[i] = pnorm((x[nx] - forecast$pred[i]) / locSD)
prob.pval[i] = pnorm(abs(x[nx+i] - forecast$pred[i]) / locSD)
}
perf.mape = perf.mape / fx
perf.mse = perf.mse / fx
perf.rmse = sqrt(perf.mse)
bitmap(file='test2.png')
plot(forecast$pred, pch=19, type='b',main='ARIMA Extrapolation Forecast', ylab='Forecast and 95% CI', xlab='time',ylim=c(min(lb),max(ub)))
dum <- forecast$pred
dum[1:(lx-nx)] <- x[(nx+1):lx]
lines(dum, lty=1)
lines(ub,lty=3)
lines(lb,lty=3)
dev.off()
load(file='createtable')
a<-table.start()
a<-table.row.start(a)
a<-table.element(a,'Univariate ARIMA Extrapolation Forecast',9,TRUE)
a<-table.row.end(a)
a<-table.row.start(a)
a<-table.element(a,'time',1,header=TRUE)
a<-table.element(a,'Y[t]',1,header=TRUE)
a<-table.element(a,'F[t]',1,header=TRUE)
a<-table.element(a,'95% LB',1,header=TRUE)
a<-table.element(a,'95% UB',1,header=TRUE)
a<-table.element(a,'p-value
(H0: Y[t] = F[t])',1,header=TRUE)
a<-table.element(a,'P(F[t]>Y[t-1])',1,header=TRUE)
a<-table.element(a,'P(F[t]>Y[t-s])',1,header=TRUE)
mylab <- paste('P(F[t]>Y[',nx,sep='')
mylab <- paste(mylab,'])',sep='')
a<-table.element(a,mylab,1,header=TRUE)
a<-table.row.end(a)
for (i in (nx-par5):nx) {
a<-table.row.start(a)
a<-table.element(a,i,header=TRUE)
a<-table.element(a,x[i])
a<-table.element(a,'-')
a<-table.row.end(a)
}
for (i in 1:fx) {
a<-table.row.start(a)
a<-table.element(a,nx+i,header=TRUE)
a<-table.element(a,round(x[nx+i],4))
a<-table.element(a,round(forecast$pred[i],4))
a<-table.element(a,round(lb[i],4))
a<-table.element(a,round(ub[i],4))
a<-table.element(a,round((1-prob.pval[i]),4))
a<-table.element(a,round((1-prob.dec[i]),4))
a<-table.element(a,round((1-prob.sdec[i]),4))
a<-table.element(a,round((1-prob.ldec[i]),4))
a<-table.row.end(a)
}
a<-table.end(a)
table.save(a,file='mytable.tab')
a<-table.start()
a<-table.row.start(a)
a<-table.element(a,'Univariate ARIMA Extrapolation Forecast Performance',7,TRUE)
a<-table.row.end(a)
a<-table.row.start(a)
a<-table.element(a,'time',1,header=TRUE)
a<-table.element(a,'% S.E.',1,header=TRUE)
a<-table.element(a,'PE',1,header=TRUE)
a<-table.element(a,'MAPE',1,header=TRUE)
a<-table.element(a,'Sq.E',1,header=TRUE)
a<-table.element(a,'MSE',1,header=TRUE)
a<-table.element(a,'RMSE',1,header=TRUE)
a<-table.row.end(a)
for (i in 1:fx) {
a<-table.row.start(a)
a<-table.element(a,nx+i,header=TRUE)
a<-table.element(a,round(perc.se[i],4))
a<-table.element(a,round(perf.pe[i],4))
a<-table.element(a,round(perf.mape[i],4))
a<-table.element(a,round(perf.se[i],4))
a<-table.element(a,round(perf.mse[i],4))
a<-table.element(a,round(perf.rmse[i],4))
a<-table.row.end(a)
}
a<-table.end(a)
table.save(a,file='mytable1.tab')