Free Statistics
of Irreproducible Research!
Description of Statistical Computation | |||||||||||||||||||||||||||||||||||||||
|---|---|---|---|---|---|---|---|---|---|---|---|---|---|---|---|---|---|---|---|---|---|---|---|---|---|---|---|---|---|---|---|---|---|---|---|---|---|---|---|
| Author's title | |||||||||||||||||||||||||||||||||||||||
| Author | *Unverified author* | ||||||||||||||||||||||||||||||||||||||
| R Software Module | rwasp_pairs.wasp | ||||||||||||||||||||||||||||||||||||||
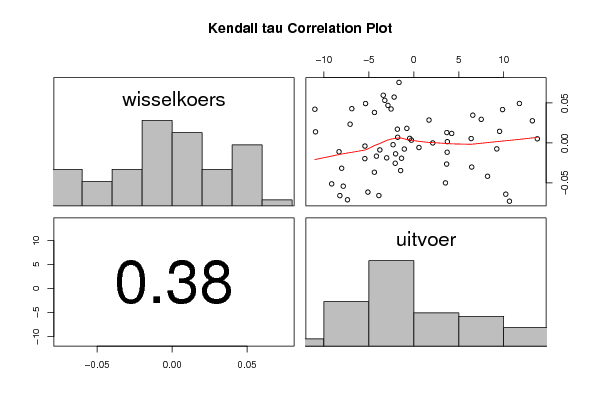
| Title produced by software | Kendall tau Correlation Matrix | ||||||||||||||||||||||||||||||||||||||
| Date of computation | Tue, 08 Jan 2008 11:11:29 -0700 | ||||||||||||||||||||||||||||||||||||||
| Cite this page as follows | Statistical Computations at FreeStatistics.org, Office for Research Development and Education, URL https://freestatistics.org/blog/index.php?v=date/2008/Jan/08/t1199815812wrpisoo2yqau5rh.htm/, Retrieved Tue, 01 Jul 2025 00:56:44 +0000 | ||||||||||||||||||||||||||||||||||||||
| Statistical Computations at FreeStatistics.org, Office for Research Development and Education, URL https://freestatistics.org/blog/index.php?pk=7930, Retrieved Tue, 01 Jul 2025 00:56:44 +0000 | |||||||||||||||||||||||||||||||||||||||
| QR Codes: | |||||||||||||||||||||||||||||||||||||||
|
| |||||||||||||||||||||||||||||||||||||||
| Original text written by user: | |||||||||||||||||||||||||||||||||||||||
| IsPrivate? | No (this computation is public) | ||||||||||||||||||||||||||||||||||||||
| User-defined keywords | |||||||||||||||||||||||||||||||||||||||
| Estimated Impact | 377 | ||||||||||||||||||||||||||||||||||||||
Tree of Dependent Computations | |||||||||||||||||||||||||||||||||||||||
| Family? (F = Feedback message, R = changed R code, M = changed R Module, P = changed Parameters, D = changed Data) | |||||||||||||||||||||||||||||||||||||||
| - [Kendall tau Correlation Matrix] [paper] [2008-01-08 18:11:29] [bd0e3b74339db15b9ec76abfe0d5b55e] [Current] | |||||||||||||||||||||||||||||||||||||||
| Feedback Forum | |||||||||||||||||||||||||||||||||||||||
Post a new message | |||||||||||||||||||||||||||||||||||||||
Dataset | |||||||||||||||||||||||||||||||||||||||
| Dataseries X: | |||||||||||||||||||||||||||||||||||||||
0,0137 -10,94 0,0069 -1,8 -0,0002 2,11 0,0232 -7,09 -0,0642 10,23 0,017 -1,83 0,0754 -1,65 0,0426 -6,9 0,0117 4,21 -0,0188 -3,02 -0,0368 -4,39 -0,0501 3,52 0,0033 -0,27 0,018 -0,78 0,0275 13,19 0,049 -5,37 0,0594 -3,4 0,0293 7,5 -0,0542 -7,85 -0,0076 9,23 0,0055 -0,46 0,0379 -4,38 0,0128 3,67 0,053 -3,23 0,0284 1,69 -0,0024 -2,31 -0,0059 0,57 0,0422 -2,53 -0,0303 6,44 -0,0659 -3,89 -0,0089 -3,78 0,0053 6,38 0,0467 -2,88 -0,0193 -1,37 0,0415 9,87 -0,0112 -8,32 -0,0118 3,71 -0,0418 8,2 -0,0318 -8,03 -0,0712 -7,38 0,005 13,74 0,0419 -11,01 0,0143 9,54 -0,0041 -5,44 -0,0198 -5,45 0,0491 11,75 -0,0167 -4,16 -0,0616 -5,11 -0,0138 -2,03 0,0571 -2,19 0,0014 3,73 -0,0266 3,65 -0,066 -8,23 -0,0256 -2,07 0,0345 6,56 -0,0078 -1,06 -0,0513 -9,14 -0,073 10,64 -0,0347 -1,47 | |||||||||||||||||||||||||||||||||||||||
Tables (Output of Computation) | |||||||||||||||||||||||||||||||||||||||
| |||||||||||||||||||||||||||||||||||||||
Figures (Output of Computation) | |||||||||||||||||||||||||||||||||||||||
Input Parameters & R Code | |||||||||||||||||||||||||||||||||||||||
| Parameters (Session): | |||||||||||||||||||||||||||||||||||||||
| Parameters (R input): | |||||||||||||||||||||||||||||||||||||||
| R code (references can be found in the software module): | |||||||||||||||||||||||||||||||||||||||
panel.tau <- function(x, y, digits=2, prefix='', cex.cor) | |||||||||||||||||||||||||||||||||||||||