Free Statistics

of Irreproducible Research!

Author's title

Author*Unverified author*
R Software Modulerwasp_correlation.wasp
Title produced by softwarePearson Correlation
Date of computationSat, 05 Jan 2008 05:03:46 -0700
Cite this page as followsStatistical Computations at FreeStatistics.org, Office for Research Development and Education, URL https://freestatistics.org/blog/index.php?v=date/2008/Jan/05/t1199534635woqcwg9e0jv4y5u.htm/, Retrieved Tue, 14 May 2024 01:16:45 +0000
Statistical Computations at FreeStatistics.org, Office for Research Development and Education, URL https://freestatistics.org/blog/index.php?pk=7779, Retrieved Tue, 14 May 2024 01:16:45 +0000
QR Codes:

Original text written by user:
IsPrivate?No (this computation is public)
User-defined keywords
Estimated Impact280
Family? (F = Feedback message, R = changed R code, M = changed R Module, P = changed Parameters, D = changed Data)
-       [Pearson Correlation] [Paper_corr_stat_o...] [2008-01-05 12:03:46] [1ea0754dc57274996703e6220e342fe8] [Current]
Feedback Forum

Post a new message
Dataseries X:
-1,48033E-05
-0,000559728
-0,001661464
-0,000206111
0,000391534
-0,001306447
-0,001030865
-0,000471111
-0,000514407
-0,000349283
-0,00163664
0,00059502
-0,001215959
-0,001610338
0,000514799
-0,001358222
-0,001649181
9,56556E-05
0,000571407
-0,002569009
0,000609157
0,000228
0,001641234
0,001548685
-0,001081926
0,000501447
-0,001669946
-0,001643796
0,000933258
0,001225474
0,000671829
-0,001156959
0,001554204
0,000697463
0,000298945
0,000118779
-0,000454979
-0,000758256
-0,001883814
0,000350195
0,000809793
-0,0002472
-0,000114181
-0,000733486
-0,000524683
0,001066399
8,9809E-05
-0,000808946
-0,000936656
-0,000496893
0,001386333
0,001422328
-0,000277787
-0,00029437
-0,001290847
-0,000512573
0,000477472
-0,000111006
8,17718E-05
1,75385E-05
-0,000274125
-0,000991596
-0,001164287
-0,001917012
0,000216283
-0,000619477
-0,000813221
-0,000210582
-0,001277084
0,000931432
0,001251757
0,00067761
-0,001415316
-0,001332513
-0,002224636
0,000261857
-0,001180315
-0,001831976
-0,000562689
-0,001427773
0,000379311
0,002175279
0,000570308
Dataseries Y:
-7315
6179
-7146
2033
3447
-2844
-178
39
-3386
1915
1602
-3011
9165
-3699
777
3033
-12392
2467
1932
-2101
3876
-1876
-1679
-893
-5942
-1194
2869
1663
5207
1902
-912
-1428
2833
-1176
280
-1575
5831
-2561
2152
-7643
-1304
1348
-2029
5939
-5121
-574
2362
-2874
-2936
2707
-3112
4182
4363
-948
1813
-1356
1373
-460
3739
-7519
5797
4664
-1047
-5647
194
-4177
3149
154
-2136
3999
-3206
3455
-5506
-3550
1790
5278
2999
-2759
1227
-1875
-2315
2307
-2419


Summary of compuational transaction
Raw Inputview raw input (R code)
Raw Outputview raw output of R engine
Computing time1 seconds
R Server'Gwilym Jenkins' @ 72.249.127.135

\begin{tabular}{lllllllll}
\hline
Summary of compuational transaction \tabularnewline
Raw Input & view raw input (R code)  \tabularnewline
Raw Output & view raw output of R engine  \tabularnewline
Computing time & 1 seconds \tabularnewline
R Server & 'Gwilym Jenkins' @ 72.249.127.135 \tabularnewline
\hline
\end{tabular}
%Source: https://freestatistics.org/blog/index.php?pk=7779&T=0

[TABLE]
[ROW][C]Summary of compuational transaction[/C][/ROW]
[ROW][C]Raw Input[/C][C]view raw input (R code) [/C][/ROW]
[ROW][C]Raw Output[/C][C]view raw output of R engine [/C][/ROW]
[ROW][C]Computing time[/C][C]1 seconds[/C][/ROW]
[ROW][C]R Server[/C][C]'Gwilym Jenkins' @ 72.249.127.135[/C][/ROW]
[/TABLE]
Source: https://freestatistics.org/blog/index.php?pk=7779&T=0

Globally Unique Identifier (entire table): ba.freestatistics.org/blog/index.php?pk=7779&T=0

As an alternative you can also use a QR Code:  

The GUIDs for individual cells are displayed in the table below:

Summary of compuational transaction
Raw Inputview raw input (R code)
Raw Outputview raw output of R engine
Computing time1 seconds
R Server'Gwilym Jenkins' @ 72.249.127.135


Pearson Product Moment Correlation - Ungrouped Data
StatisticVariable XVariable Y
Mean-0.000289543462650602-117.831325301205
Biased Variance1.03869685991774e-0614236334.3570910
Biased Standard Deviation0.001019164785458043773.10672484771
Covariance0.647170728544843
Correlation0.166268939561750
Determination0.0276453602629887
T-Test1.51754399646858
p-value (2 sided)0.133022814261591
p-value (1 sided)0.0665114071307953
Degrees of Freedom81
Number of Observations83

\begin{tabular}{lllllllll}
\hline
Pearson Product Moment Correlation - Ungrouped Data \tabularnewline
Statistic & Variable X & Variable Y \tabularnewline
Mean & -0.000289543462650602 & -117.831325301205 \tabularnewline
Biased Variance & 1.03869685991774e-06 & 14236334.3570910 \tabularnewline
Biased Standard Deviation & 0.00101916478545804 & 3773.10672484771 \tabularnewline
Covariance & 0.647170728544843 \tabularnewline
Correlation & 0.166268939561750 \tabularnewline
Determination & 0.0276453602629887 \tabularnewline
T-Test & 1.51754399646858 \tabularnewline
p-value (2 sided) & 0.133022814261591 \tabularnewline
p-value (1 sided) & 0.0665114071307953 \tabularnewline
Degrees of Freedom & 81 \tabularnewline
Number of Observations & 83 \tabularnewline
\hline
\end{tabular}
%Source: https://freestatistics.org/blog/index.php?pk=7779&T=1

[TABLE]
[ROW][C]Pearson Product Moment Correlation - Ungrouped Data[/C][/ROW]
[ROW][C]Statistic[/C][C]Variable X[/C][C]Variable Y[/C][/ROW]
[ROW][C]Mean[/C][C]-0.000289543462650602[/C][C]-117.831325301205[/C][/ROW]
[ROW][C]Biased Variance[/C][C]1.03869685991774e-06[/C][C]14236334.3570910[/C][/ROW]
[ROW][C]Biased Standard Deviation[/C][C]0.00101916478545804[/C][C]3773.10672484771[/C][/ROW]
[ROW][C]Covariance[/C][C]0.647170728544843[/C][/ROW]
[ROW][C]Correlation[/C][C]0.166268939561750[/C][/ROW]
[ROW][C]Determination[/C][C]0.0276453602629887[/C][/ROW]
[ROW][C]T-Test[/C][C]1.51754399646858[/C][/ROW]
[ROW][C]p-value (2 sided)[/C][C]0.133022814261591[/C][/ROW]
[ROW][C]p-value (1 sided)[/C][C]0.0665114071307953[/C][/ROW]
[ROW][C]Degrees of Freedom[/C][C]81[/C][/ROW]
[ROW][C]Number of Observations[/C][C]83[/C][/ROW]
[/TABLE]
Source: https://freestatistics.org/blog/index.php?pk=7779&T=1

Globally Unique Identifier (entire table): ba.freestatistics.org/blog/index.php?pk=7779&T=1

As an alternative you can also use a QR Code:  

The GUIDs for individual cells are displayed in the table below:

Pearson Product Moment Correlation - Ungrouped Data
StatisticVariable XVariable Y
Mean-0.000289543462650602-117.831325301205
Biased Variance1.03869685991774e-0614236334.3570910
Biased Standard Deviation0.001019164785458043773.10672484771
Covariance0.647170728544843
Correlation0.166268939561750
Determination0.0276453602629887
T-Test1.51754399646858
p-value (2 sided)0.133022814261591
p-value (1 sided)0.0665114071307953
Degrees of Freedom81
Number of Observations83


Parameters (Session):
Parameters (R input):
R code (references can be found in the software module):
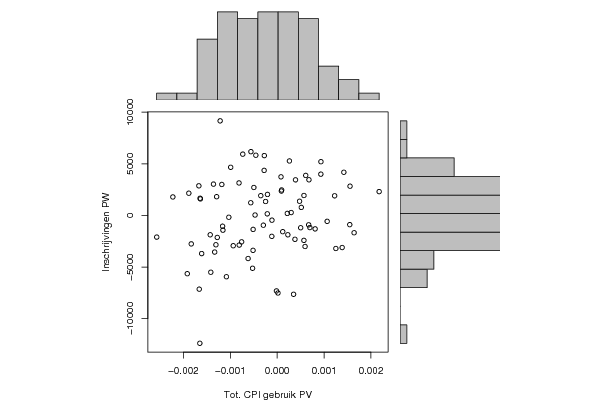
bitmap(file='test1.png')
histx <- hist(x, plot=FALSE)
histy <- hist(y, plot=FALSE)
maxcounts <- max(c(histx$counts, histx$counts))
xrange <- c(min(x),max(x))
yrange <- c(min(y),max(y))
nf <- layout(matrix(c(2,0,1,3),2,2,byrow=TRUE), c(3,1), c(1,3), TRUE)
par(mar=c(4,4,1,1))
plot(x, y, xlim=xrange, ylim=yrange, xlab=xlab, ylab=ylab)
par(mar=c(0,4,1,1))
barplot(histx$counts, axes=FALSE, ylim=c(0, maxcounts), space=0)
par(mar=c(4,0,1,1))
barplot(histy$counts, axes=FALSE, xlim=c(0, maxcounts), space=0, horiz=TRUE)
dev.off()
lx = length(x)
makebiased = (lx-1)/lx
varx = var(x)*makebiased
vary = var(y)*makebiased
corxy <- cor.test(x,y,method='pearson')
cxy <- as.matrix(corxy$estimate)[1,1]
load(file='createtable')
a<-table.start()
a<-table.row.start(a)
a<-table.element(a,'Pearson Product Moment Correlation - Ungrouped Data',3,TRUE)
a<-table.row.end(a)
a<-table.row.start(a)
a<-table.element(a,'Statistic',1,TRUE)
a<-table.element(a,'Variable X',1,TRUE)
a<-table.element(a,'Variable Y',1,TRUE)
a<-table.row.end(a)
a<-table.row.start(a)
a<-table.element(a,hyperlink('arithmetic_mean.htm','Mean',''),header=TRUE)
a<-table.element(a,mean(x))
a<-table.element(a,mean(y))
a<-table.row.end(a)
a<-table.row.start(a)
a<-table.element(a,hyperlink('biased.htm','Biased Variance',''),header=TRUE)
a<-table.element(a,varx)
a<-table.element(a,vary)
a<-table.row.end(a)
a<-table.row.start(a)
a<-table.element(a,hyperlink('biased1.htm','Biased Standard Deviation',''),header=TRUE)
a<-table.element(a,sqrt(varx))
a<-table.element(a,sqrt(vary))
a<-table.row.end(a)
a<-table.row.start(a)
a<-table.element(a,hyperlink('covariance.htm','Covariance',''),header=TRUE)
a<-table.element(a,cov(x,y),2)
a<-table.row.end(a)
a<-table.row.start(a)
a<-table.element(a,hyperlink('pearson_correlation.htm','Correlation',''),header=TRUE)
a<-table.element(a,cxy,2)
a<-table.row.end(a)
a<-table.row.start(a)
a<-table.element(a,hyperlink('coeff_of_determination.htm','Determination',''),header=TRUE)
a<-table.element(a,cxy*cxy,2)
a<-table.row.end(a)
a<-table.row.start(a)
a<-table.element(a,hyperlink('ttest_statistic.htm','T-Test',''),header=TRUE)
a<-table.element(a,as.matrix(corxy$statistic)[1,1],2)
a<-table.row.end(a)
a<-table.row.start(a)
a<-table.element(a,'p-value (2 sided)',header=TRUE)
a<-table.element(a,(p2 <- as.matrix(corxy$p.value)[1,1]),2)
a<-table.row.end(a)
a<-table.row.start(a)
a<-table.element(a,'p-value (1 sided)',header=TRUE)
a<-table.element(a,p2/2,2)
a<-table.row.end(a)
a<-table.row.start(a)
a<-table.element(a,'Degrees of Freedom',header=TRUE)
a<-table.element(a,lx-2,2)
a<-table.row.end(a)
a<-table.row.start(a)
a<-table.element(a,'Number of Observations',header=TRUE)
a<-table.element(a,lx,2)
a<-table.row.end(a)
a<-table.end(a)
table.save(a,file='mytable.tab')