Free Statistics

of Irreproducible Research!

Author's title

Author*Unverified author*
R Software Modulerwasp_arimabackwardselection.wasp
Title produced by softwareARIMA Backward Selection
Date of computationWed, 02 Jan 2008 13:27:38 -0700
Cite this page as followsStatistical Computations at FreeStatistics.org, Office for Research Development and Education, URL https://freestatistics.org/blog/index.php?v=date/2008/Jan/02/t11993057594n9h7yw95ce9dh5.htm/, Retrieved Wed, 15 May 2024 05:24:00 +0000
Statistical Computations at FreeStatistics.org, Office for Research Development and Education, URL https://freestatistics.org/blog/index.php?pk=7760, Retrieved Wed, 15 May 2024 05:24:00 +0000
QR Codes:

Original text written by user:
IsPrivate?No (this computation is public)
User-defined keywords
Estimated Impact301
Family? (F = Feedback message, R = changed R code, M = changed R Module, P = changed Parameters, D = changed Data)
-       [ARIMA Backward Selection] [PAPER-ARIMA-PARAM...] [2008-01-02 20:27:38] [6bdd947de0ee04552c8f0fc807f31807] [Current]
Feedback Forum

Post a new message
Dataseries X:
7272.2
6680.1
8427.6
8752.8
7952.7
8694.3
7787
8474.2
9154.7
8557.2
7951.1
9156.7
7865.7
7337.4
9131.7
8814.6
8598.8
8439.6
7451.8
8016.2
9544.1
8270.7
8102.2
9369
7657.7
7816.6
9391.3
9445.4
9533.1
10068.7
8955.5
10423.9
11617.2
9391.1
10872
10230.4
9221
9428.6
10934.5
10986
11724.6
11180.9
11163.2
11240.9
12107.1
10762.3
11340.4
11266.8
9542.7
9227.7
10571.9
10774.4
10392.8
9920.2
9884.9
10174.5
11395.4
10760.2
10570.1
10536
9902.6
8889
10837.3
11624.1
10509
10984.9
10649.1
10855.7
11677.4
10760.2
10046.2
10772.8
9987.7
8638.7
11063.7
11855.7
10684.5
11337.4
10478
11123.9
12909.3
11339.9
10462.2
12733.5
10519.2
10414.9
12476.8
12384.6
12266.7
12919.9
11497.3
12142
13919.4
12656.8
12034.1
13199.7
10881.3
11301.2
13643.9
12517
13981.1
14275.7
13435
13565.7
16216.3
12970
14079.9
14235
12213.4
12581
14130.4
14210.8
14378.5
13142.8
13714.7
13621.9
15379.8
13306.3
14391.2
14909.9


Summary of compuational transaction
Raw Inputview raw input (R code)
Raw Outputview raw output of R engine
Computing time23 seconds
R Server'George Udny Yule' @ 72.249.76.132

\begin{tabular}{lllllllll}
\hline
Summary of compuational transaction \tabularnewline
Raw Input & view raw input (R code)  \tabularnewline
Raw Output & view raw output of R engine  \tabularnewline
Computing time & 23 seconds \tabularnewline
R Server & 'George Udny Yule' @ 72.249.76.132 \tabularnewline
\hline
\end{tabular}
%Source: https://freestatistics.org/blog/index.php?pk=7760&T=0

[TABLE]
[ROW][C]Summary of compuational transaction[/C][/ROW]
[ROW][C]Raw Input[/C][C]view raw input (R code) [/C][/ROW]
[ROW][C]Raw Output[/C][C]view raw output of R engine [/C][/ROW]
[ROW][C]Computing time[/C][C]23 seconds[/C][/ROW]
[ROW][C]R Server[/C][C]'George Udny Yule' @ 72.249.76.132[/C][/ROW]
[/TABLE]
Source: https://freestatistics.org/blog/index.php?pk=7760&T=0

Globally Unique Identifier (entire table): ba.freestatistics.org/blog/index.php?pk=7760&T=0

As an alternative you can also use a QR Code:  

The GUIDs for individual cells are displayed in the table below:

Summary of compuational transaction
Raw Inputview raw input (R code)
Raw Outputview raw output of R engine
Computing time23 seconds
R Server'George Udny Yule' @ 72.249.76.132


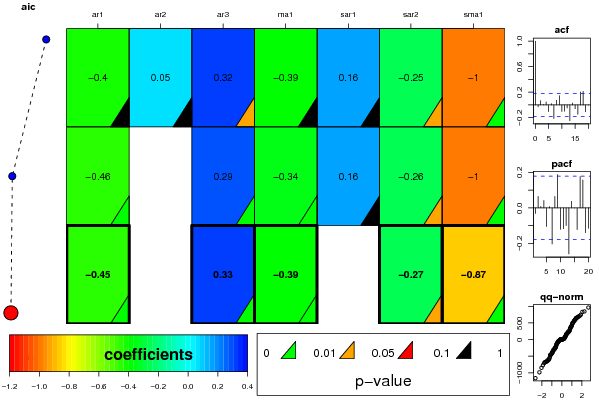
ARIMA Parameter Estimation and Backward Selection
Iterationar1ar2ar3ma1sar1sar2sma1
Estimates ( 1 )-0.40290.05130.3159-0.39430.1647-0.2546-0.9999
(p-val)(0.1526 )(0.8294 )(0.0193 )(0.1683 )(0.1587 )(0.0297 )(1e-04 )
Estimates ( 2 )-0.458200.2931-0.33950.1645-0.2559-1.0001
(p-val)(1e-04 )(NA )(8e-04 )(0.0082 )(0.1587 )(0.0284 )(1e-04 )
Estimates ( 3 )-0.449600.3294-0.39220-0.2688-0.8654
(p-val)(0 )(NA )(1e-04 )(7e-04 )(NA )(0.0216 )(0 )
Estimates ( 4 )NANANANANANANA
(p-val)(NA )(NA )(NA )(NA )(NA )(NA )(NA )
Estimates ( 5 )NANANANANANANA
(p-val)(NA )(NA )(NA )(NA )(NA )(NA )(NA )
Estimates ( 6 )NANANANANANANA
(p-val)(NA )(NA )(NA )(NA )(NA )(NA )(NA )
Estimates ( 7 )NANANANANANANA
(p-val)(NA )(NA )(NA )(NA )(NA )(NA )(NA )
Estimates ( 8 )NANANANANANANA
(p-val)(NA )(NA )(NA )(NA )(NA )(NA )(NA )
Estimates ( 9 )NANANANANANANA
(p-val)(NA )(NA )(NA )(NA )(NA )(NA )(NA )
Estimates ( 10 )NANANANANANANA
(p-val)(NA )(NA )(NA )(NA )(NA )(NA )(NA )
Estimates ( 11 )NANANANANANANA
(p-val)(NA )(NA )(NA )(NA )(NA )(NA )(NA )
Estimates ( 12 )NANANANANANANA
(p-val)(NA )(NA )(NA )(NA )(NA )(NA )(NA )
Estimates ( 13 )NANANANANANANA
(p-val)(NA )(NA )(NA )(NA )(NA )(NA )(NA )

\begin{tabular}{lllllllll}
\hline
ARIMA Parameter Estimation and Backward Selection \tabularnewline
Iteration & ar1 & ar2 & ar3 & ma1 & sar1 & sar2 & sma1 \tabularnewline
Estimates ( 1 ) & -0.4029 & 0.0513 & 0.3159 & -0.3943 & 0.1647 & -0.2546 & -0.9999 \tabularnewline
(p-val) & (0.1526 ) & (0.8294 ) & (0.0193 ) & (0.1683 ) & (0.1587 ) & (0.0297 ) & (1e-04 ) \tabularnewline
Estimates ( 2 ) & -0.4582 & 0 & 0.2931 & -0.3395 & 0.1645 & -0.2559 & -1.0001 \tabularnewline
(p-val) & (1e-04 ) & (NA ) & (8e-04 ) & (0.0082 ) & (0.1587 ) & (0.0284 ) & (1e-04 ) \tabularnewline
Estimates ( 3 ) & -0.4496 & 0 & 0.3294 & -0.3922 & 0 & -0.2688 & -0.8654 \tabularnewline
(p-val) & (0 ) & (NA ) & (1e-04 ) & (7e-04 ) & (NA ) & (0.0216 ) & (0 ) \tabularnewline
Estimates ( 4 ) & NA & NA & NA & NA & NA & NA & NA \tabularnewline
(p-val) & (NA ) & (NA ) & (NA ) & (NA ) & (NA ) & (NA ) & (NA ) \tabularnewline
Estimates ( 5 ) & NA & NA & NA & NA & NA & NA & NA \tabularnewline
(p-val) & (NA ) & (NA ) & (NA ) & (NA ) & (NA ) & (NA ) & (NA ) \tabularnewline
Estimates ( 6 ) & NA & NA & NA & NA & NA & NA & NA \tabularnewline
(p-val) & (NA ) & (NA ) & (NA ) & (NA ) & (NA ) & (NA ) & (NA ) \tabularnewline
Estimates ( 7 ) & NA & NA & NA & NA & NA & NA & NA \tabularnewline
(p-val) & (NA ) & (NA ) & (NA ) & (NA ) & (NA ) & (NA ) & (NA ) \tabularnewline
Estimates ( 8 ) & NA & NA & NA & NA & NA & NA & NA \tabularnewline
(p-val) & (NA ) & (NA ) & (NA ) & (NA ) & (NA ) & (NA ) & (NA ) \tabularnewline
Estimates ( 9 ) & NA & NA & NA & NA & NA & NA & NA \tabularnewline
(p-val) & (NA ) & (NA ) & (NA ) & (NA ) & (NA ) & (NA ) & (NA ) \tabularnewline
Estimates ( 10 ) & NA & NA & NA & NA & NA & NA & NA \tabularnewline
(p-val) & (NA ) & (NA ) & (NA ) & (NA ) & (NA ) & (NA ) & (NA ) \tabularnewline
Estimates ( 11 ) & NA & NA & NA & NA & NA & NA & NA \tabularnewline
(p-val) & (NA ) & (NA ) & (NA ) & (NA ) & (NA ) & (NA ) & (NA ) \tabularnewline
Estimates ( 12 ) & NA & NA & NA & NA & NA & NA & NA \tabularnewline
(p-val) & (NA ) & (NA ) & (NA ) & (NA ) & (NA ) & (NA ) & (NA ) \tabularnewline
Estimates ( 13 ) & NA & NA & NA & NA & NA & NA & NA \tabularnewline
(p-val) & (NA ) & (NA ) & (NA ) & (NA ) & (NA ) & (NA ) & (NA ) \tabularnewline
\hline
\end{tabular}
%Source: https://freestatistics.org/blog/index.php?pk=7760&T=1

[TABLE]
[ROW][C]ARIMA Parameter Estimation and Backward Selection[/C][/ROW]
[ROW][C]Iteration[/C][C]ar1[/C][C]ar2[/C][C]ar3[/C][C]ma1[/C][C]sar1[/C][C]sar2[/C][C]sma1[/C][/ROW]
[ROW][C]Estimates ( 1 )[/C][C]-0.4029[/C][C]0.0513[/C][C]0.3159[/C][C]-0.3943[/C][C]0.1647[/C][C]-0.2546[/C][C]-0.9999[/C][/ROW]
[ROW][C](p-val)[/C][C](0.1526 )[/C][C](0.8294 )[/C][C](0.0193 )[/C][C](0.1683 )[/C][C](0.1587 )[/C][C](0.0297 )[/C][C](1e-04 )[/C][/ROW]
[ROW][C]Estimates ( 2 )[/C][C]-0.4582[/C][C]0[/C][C]0.2931[/C][C]-0.3395[/C][C]0.1645[/C][C]-0.2559[/C][C]-1.0001[/C][/ROW]
[ROW][C](p-val)[/C][C](1e-04 )[/C][C](NA )[/C][C](8e-04 )[/C][C](0.0082 )[/C][C](0.1587 )[/C][C](0.0284 )[/C][C](1e-04 )[/C][/ROW]
[ROW][C]Estimates ( 3 )[/C][C]-0.4496[/C][C]0[/C][C]0.3294[/C][C]-0.3922[/C][C]0[/C][C]-0.2688[/C][C]-0.8654[/C][/ROW]
[ROW][C](p-val)[/C][C](0 )[/C][C](NA )[/C][C](1e-04 )[/C][C](7e-04 )[/C][C](NA )[/C][C](0.0216 )[/C][C](0 )[/C][/ROW]
[ROW][C]Estimates ( 4 )[/C][C]NA[/C][C]NA[/C][C]NA[/C][C]NA[/C][C]NA[/C][C]NA[/C][C]NA[/C][/ROW]
[ROW][C](p-val)[/C][C](NA )[/C][C](NA )[/C][C](NA )[/C][C](NA )[/C][C](NA )[/C][C](NA )[/C][C](NA )[/C][/ROW]
[ROW][C]Estimates ( 5 )[/C][C]NA[/C][C]NA[/C][C]NA[/C][C]NA[/C][C]NA[/C][C]NA[/C][C]NA[/C][/ROW]
[ROW][C](p-val)[/C][C](NA )[/C][C](NA )[/C][C](NA )[/C][C](NA )[/C][C](NA )[/C][C](NA )[/C][C](NA )[/C][/ROW]
[ROW][C]Estimates ( 6 )[/C][C]NA[/C][C]NA[/C][C]NA[/C][C]NA[/C][C]NA[/C][C]NA[/C][C]NA[/C][/ROW]
[ROW][C](p-val)[/C][C](NA )[/C][C](NA )[/C][C](NA )[/C][C](NA )[/C][C](NA )[/C][C](NA )[/C][C](NA )[/C][/ROW]
[ROW][C]Estimates ( 7 )[/C][C]NA[/C][C]NA[/C][C]NA[/C][C]NA[/C][C]NA[/C][C]NA[/C][C]NA[/C][/ROW]
[ROW][C](p-val)[/C][C](NA )[/C][C](NA )[/C][C](NA )[/C][C](NA )[/C][C](NA )[/C][C](NA )[/C][C](NA )[/C][/ROW]
[ROW][C]Estimates ( 8 )[/C][C]NA[/C][C]NA[/C][C]NA[/C][C]NA[/C][C]NA[/C][C]NA[/C][C]NA[/C][/ROW]
[ROW][C](p-val)[/C][C](NA )[/C][C](NA )[/C][C](NA )[/C][C](NA )[/C][C](NA )[/C][C](NA )[/C][C](NA )[/C][/ROW]
[ROW][C]Estimates ( 9 )[/C][C]NA[/C][C]NA[/C][C]NA[/C][C]NA[/C][C]NA[/C][C]NA[/C][C]NA[/C][/ROW]
[ROW][C](p-val)[/C][C](NA )[/C][C](NA )[/C][C](NA )[/C][C](NA )[/C][C](NA )[/C][C](NA )[/C][C](NA )[/C][/ROW]
[ROW][C]Estimates ( 10 )[/C][C]NA[/C][C]NA[/C][C]NA[/C][C]NA[/C][C]NA[/C][C]NA[/C][C]NA[/C][/ROW]
[ROW][C](p-val)[/C][C](NA )[/C][C](NA )[/C][C](NA )[/C][C](NA )[/C][C](NA )[/C][C](NA )[/C][C](NA )[/C][/ROW]
[ROW][C]Estimates ( 11 )[/C][C]NA[/C][C]NA[/C][C]NA[/C][C]NA[/C][C]NA[/C][C]NA[/C][C]NA[/C][/ROW]
[ROW][C](p-val)[/C][C](NA )[/C][C](NA )[/C][C](NA )[/C][C](NA )[/C][C](NA )[/C][C](NA )[/C][C](NA )[/C][/ROW]
[ROW][C]Estimates ( 12 )[/C][C]NA[/C][C]NA[/C][C]NA[/C][C]NA[/C][C]NA[/C][C]NA[/C][C]NA[/C][/ROW]
[ROW][C](p-val)[/C][C](NA )[/C][C](NA )[/C][C](NA )[/C][C](NA )[/C][C](NA )[/C][C](NA )[/C][C](NA )[/C][/ROW]
[ROW][C]Estimates ( 13 )[/C][C]NA[/C][C]NA[/C][C]NA[/C][C]NA[/C][C]NA[/C][C]NA[/C][C]NA[/C][/ROW]
[ROW][C](p-val)[/C][C](NA )[/C][C](NA )[/C][C](NA )[/C][C](NA )[/C][C](NA )[/C][C](NA )[/C][C](NA )[/C][/ROW]
[/TABLE]
Source: https://freestatistics.org/blog/index.php?pk=7760&T=1

Globally Unique Identifier (entire table): ba.freestatistics.org/blog/index.php?pk=7760&T=1

As an alternative you can also use a QR Code:  

The GUIDs for individual cells are displayed in the table below:

ARIMA Parameter Estimation and Backward Selection
Iterationar1ar2ar3ma1sar1sar2sma1
Estimates ( 1 )-0.40290.05130.3159-0.39430.1647-0.2546-0.9999
(p-val)(0.1526 )(0.8294 )(0.0193 )(0.1683 )(0.1587 )(0.0297 )(1e-04 )
Estimates ( 2 )-0.458200.2931-0.33950.1645-0.2559-1.0001
(p-val)(1e-04 )(NA )(8e-04 )(0.0082 )(0.1587 )(0.0284 )(1e-04 )
Estimates ( 3 )-0.449600.3294-0.39220-0.2688-0.8654
(p-val)(0 )(NA )(1e-04 )(7e-04 )(NA )(0.0216 )(0 )
Estimates ( 4 )NANANANANANANA
(p-val)(NA )(NA )(NA )(NA )(NA )(NA )(NA )
Estimates ( 5 )NANANANANANANA
(p-val)(NA )(NA )(NA )(NA )(NA )(NA )(NA )
Estimates ( 6 )NANANANANANANA
(p-val)(NA )(NA )(NA )(NA )(NA )(NA )(NA )
Estimates ( 7 )NANANANANANANA
(p-val)(NA )(NA )(NA )(NA )(NA )(NA )(NA )
Estimates ( 8 )NANANANANANANA
(p-val)(NA )(NA )(NA )(NA )(NA )(NA )(NA )
Estimates ( 9 )NANANANANANANA
(p-val)(NA )(NA )(NA )(NA )(NA )(NA )(NA )
Estimates ( 10 )NANANANANANANA
(p-val)(NA )(NA )(NA )(NA )(NA )(NA )(NA )
Estimates ( 11 )NANANANANANANA
(p-val)(NA )(NA )(NA )(NA )(NA )(NA )(NA )
Estimates ( 12 )NANANANANANANA
(p-val)(NA )(NA )(NA )(NA )(NA )(NA )(NA )
Estimates ( 13 )NANANANANANANA
(p-val)(NA )(NA )(NA )(NA )(NA )(NA )(NA )


Estimated ARIMA Residuals
Value
-26.9187469810876
32.874489387891
55.4109661945276
-411.740218895421
57.6733737633629
-449.467581034991
-373.137339219786
-371.885252056547
647.419900104101
22.1523873805244
120.184757841137
67.8888120330147
-152.178661396321
231.692050126901
145.757895879761
225.957394333699
337.679772954793
659.938431816578
220.144078002751
568.176791409846
348.725688751759
-773.427863750167
498.38970904353
-602.642890302524
-236.529593612675
-3.05556298875158
392.249606246461
-104.550624189284
682.677984138286
-319.622690005149
315.541866099491
-660.840435525499
-420.191537655717
-277.196634339462
214.812779686457
-48.212892846644
-710.905914493365
-581.694767515458
-463.052581193947
23.9970209408294
-281.457845858963
-536.338283342713
35.4711023289096
241.984285406962
380.351841879643
500.008616361698
182.200659128449
-675.434091344352
198.846676202320
-126.639122463669
186.007671918163
601.909319356326
20.3167698321624
-68.1288115494744
259.690820578064
-61.7095797836514
-647.712668790697
-295.901619150497
-605.509356504182
-98.046012972324
270.083300740681
-442.289624599786
-38.8754805600827
660.951580547094
-57.6441355331235
-231.023829802187
-252.085124727441
115.231007902820
748.358137075023
405.44716695319
-849.686777864503
695.692017672714
175.799998798506
244.333601485961
7.89489659545201
74.8741067960001
-21.1310352998892
462.378548091352
-214.580694018194
-464.829610996476
100.794657909799
517.088499003938
-359.030784626636
-227.25098999516
-634.829213278288
163.911850756588
844.727539602654
-309.728276460699
715.917713811229
831.323237867774
575.22343178314
-675.977088920678
964.105083611734
-985.20223413236
-90.6798507383488
-121.024474917569
-166.838259312123
-26.9771629104613
6.1385957833859
171.057951354712
18.1599006949306
-1161.16622559775
17.8684254754743
-34.0938501480774
413.474910175273
-307.711577223802
602.475786753365
540.065609154372

\begin{tabular}{lllllllll}
\hline
Estimated ARIMA Residuals \tabularnewline
Value \tabularnewline
-26.9187469810876 \tabularnewline
32.874489387891 \tabularnewline
55.4109661945276 \tabularnewline
-411.740218895421 \tabularnewline
57.6733737633629 \tabularnewline
-449.467581034991 \tabularnewline
-373.137339219786 \tabularnewline
-371.885252056547 \tabularnewline
647.419900104101 \tabularnewline
22.1523873805244 \tabularnewline
120.184757841137 \tabularnewline
67.8888120330147 \tabularnewline
-152.178661396321 \tabularnewline
231.692050126901 \tabularnewline
145.757895879761 \tabularnewline
225.957394333699 \tabularnewline
337.679772954793 \tabularnewline
659.938431816578 \tabularnewline
220.144078002751 \tabularnewline
568.176791409846 \tabularnewline
348.725688751759 \tabularnewline
-773.427863750167 \tabularnewline
498.38970904353 \tabularnewline
-602.642890302524 \tabularnewline
-236.529593612675 \tabularnewline
-3.05556298875158 \tabularnewline
392.249606246461 \tabularnewline
-104.550624189284 \tabularnewline
682.677984138286 \tabularnewline
-319.622690005149 \tabularnewline
315.541866099491 \tabularnewline
-660.840435525499 \tabularnewline
-420.191537655717 \tabularnewline
-277.196634339462 \tabularnewline
214.812779686457 \tabularnewline
-48.212892846644 \tabularnewline
-710.905914493365 \tabularnewline
-581.694767515458 \tabularnewline
-463.052581193947 \tabularnewline
23.9970209408294 \tabularnewline
-281.457845858963 \tabularnewline
-536.338283342713 \tabularnewline
35.4711023289096 \tabularnewline
241.984285406962 \tabularnewline
380.351841879643 \tabularnewline
500.008616361698 \tabularnewline
182.200659128449 \tabularnewline
-675.434091344352 \tabularnewline
198.846676202320 \tabularnewline
-126.639122463669 \tabularnewline
186.007671918163 \tabularnewline
601.909319356326 \tabularnewline
20.3167698321624 \tabularnewline
-68.1288115494744 \tabularnewline
259.690820578064 \tabularnewline
-61.7095797836514 \tabularnewline
-647.712668790697 \tabularnewline
-295.901619150497 \tabularnewline
-605.509356504182 \tabularnewline
-98.046012972324 \tabularnewline
270.083300740681 \tabularnewline
-442.289624599786 \tabularnewline
-38.8754805600827 \tabularnewline
660.951580547094 \tabularnewline
-57.6441355331235 \tabularnewline
-231.023829802187 \tabularnewline
-252.085124727441 \tabularnewline
115.231007902820 \tabularnewline
748.358137075023 \tabularnewline
405.44716695319 \tabularnewline
-849.686777864503 \tabularnewline
695.692017672714 \tabularnewline
175.799998798506 \tabularnewline
244.333601485961 \tabularnewline
7.89489659545201 \tabularnewline
74.8741067960001 \tabularnewline
-21.1310352998892 \tabularnewline
462.378548091352 \tabularnewline
-214.580694018194 \tabularnewline
-464.829610996476 \tabularnewline
100.794657909799 \tabularnewline
517.088499003938 \tabularnewline
-359.030784626636 \tabularnewline
-227.25098999516 \tabularnewline
-634.829213278288 \tabularnewline
163.911850756588 \tabularnewline
844.727539602654 \tabularnewline
-309.728276460699 \tabularnewline
715.917713811229 \tabularnewline
831.323237867774 \tabularnewline
575.22343178314 \tabularnewline
-675.977088920678 \tabularnewline
964.105083611734 \tabularnewline
-985.20223413236 \tabularnewline
-90.6798507383488 \tabularnewline
-121.024474917569 \tabularnewline
-166.838259312123 \tabularnewline
-26.9771629104613 \tabularnewline
6.1385957833859 \tabularnewline
171.057951354712 \tabularnewline
18.1599006949306 \tabularnewline
-1161.16622559775 \tabularnewline
17.8684254754743 \tabularnewline
-34.0938501480774 \tabularnewline
413.474910175273 \tabularnewline
-307.711577223802 \tabularnewline
602.475786753365 \tabularnewline
540.065609154372 \tabularnewline
\hline
\end{tabular}
%Source: https://freestatistics.org/blog/index.php?pk=7760&T=2

[TABLE]
[ROW][C]Estimated ARIMA Residuals[/C][/ROW]
[ROW][C]Value[/C][/ROW]
[ROW][C]-26.9187469810876[/C][/ROW]
[ROW][C]32.874489387891[/C][/ROW]
[ROW][C]55.4109661945276[/C][/ROW]
[ROW][C]-411.740218895421[/C][/ROW]
[ROW][C]57.6733737633629[/C][/ROW]
[ROW][C]-449.467581034991[/C][/ROW]
[ROW][C]-373.137339219786[/C][/ROW]
[ROW][C]-371.885252056547[/C][/ROW]
[ROW][C]647.419900104101[/C][/ROW]
[ROW][C]22.1523873805244[/C][/ROW]
[ROW][C]120.184757841137[/C][/ROW]
[ROW][C]67.8888120330147[/C][/ROW]
[ROW][C]-152.178661396321[/C][/ROW]
[ROW][C]231.692050126901[/C][/ROW]
[ROW][C]145.757895879761[/C][/ROW]
[ROW][C]225.957394333699[/C][/ROW]
[ROW][C]337.679772954793[/C][/ROW]
[ROW][C]659.938431816578[/C][/ROW]
[ROW][C]220.144078002751[/C][/ROW]
[ROW][C]568.176791409846[/C][/ROW]
[ROW][C]348.725688751759[/C][/ROW]
[ROW][C]-773.427863750167[/C][/ROW]
[ROW][C]498.38970904353[/C][/ROW]
[ROW][C]-602.642890302524[/C][/ROW]
[ROW][C]-236.529593612675[/C][/ROW]
[ROW][C]-3.05556298875158[/C][/ROW]
[ROW][C]392.249606246461[/C][/ROW]
[ROW][C]-104.550624189284[/C][/ROW]
[ROW][C]682.677984138286[/C][/ROW]
[ROW][C]-319.622690005149[/C][/ROW]
[ROW][C]315.541866099491[/C][/ROW]
[ROW][C]-660.840435525499[/C][/ROW]
[ROW][C]-420.191537655717[/C][/ROW]
[ROW][C]-277.196634339462[/C][/ROW]
[ROW][C]214.812779686457[/C][/ROW]
[ROW][C]-48.212892846644[/C][/ROW]
[ROW][C]-710.905914493365[/C][/ROW]
[ROW][C]-581.694767515458[/C][/ROW]
[ROW][C]-463.052581193947[/C][/ROW]
[ROW][C]23.9970209408294[/C][/ROW]
[ROW][C]-281.457845858963[/C][/ROW]
[ROW][C]-536.338283342713[/C][/ROW]
[ROW][C]35.4711023289096[/C][/ROW]
[ROW][C]241.984285406962[/C][/ROW]
[ROW][C]380.351841879643[/C][/ROW]
[ROW][C]500.008616361698[/C][/ROW]
[ROW][C]182.200659128449[/C][/ROW]
[ROW][C]-675.434091344352[/C][/ROW]
[ROW][C]198.846676202320[/C][/ROW]
[ROW][C]-126.639122463669[/C][/ROW]
[ROW][C]186.007671918163[/C][/ROW]
[ROW][C]601.909319356326[/C][/ROW]
[ROW][C]20.3167698321624[/C][/ROW]
[ROW][C]-68.1288115494744[/C][/ROW]
[ROW][C]259.690820578064[/C][/ROW]
[ROW][C]-61.7095797836514[/C][/ROW]
[ROW][C]-647.712668790697[/C][/ROW]
[ROW][C]-295.901619150497[/C][/ROW]
[ROW][C]-605.509356504182[/C][/ROW]
[ROW][C]-98.046012972324[/C][/ROW]
[ROW][C]270.083300740681[/C][/ROW]
[ROW][C]-442.289624599786[/C][/ROW]
[ROW][C]-38.8754805600827[/C][/ROW]
[ROW][C]660.951580547094[/C][/ROW]
[ROW][C]-57.6441355331235[/C][/ROW]
[ROW][C]-231.023829802187[/C][/ROW]
[ROW][C]-252.085124727441[/C][/ROW]
[ROW][C]115.231007902820[/C][/ROW]
[ROW][C]748.358137075023[/C][/ROW]
[ROW][C]405.44716695319[/C][/ROW]
[ROW][C]-849.686777864503[/C][/ROW]
[ROW][C]695.692017672714[/C][/ROW]
[ROW][C]175.799998798506[/C][/ROW]
[ROW][C]244.333601485961[/C][/ROW]
[ROW][C]7.89489659545201[/C][/ROW]
[ROW][C]74.8741067960001[/C][/ROW]
[ROW][C]-21.1310352998892[/C][/ROW]
[ROW][C]462.378548091352[/C][/ROW]
[ROW][C]-214.580694018194[/C][/ROW]
[ROW][C]-464.829610996476[/C][/ROW]
[ROW][C]100.794657909799[/C][/ROW]
[ROW][C]517.088499003938[/C][/ROW]
[ROW][C]-359.030784626636[/C][/ROW]
[ROW][C]-227.25098999516[/C][/ROW]
[ROW][C]-634.829213278288[/C][/ROW]
[ROW][C]163.911850756588[/C][/ROW]
[ROW][C]844.727539602654[/C][/ROW]
[ROW][C]-309.728276460699[/C][/ROW]
[ROW][C]715.917713811229[/C][/ROW]
[ROW][C]831.323237867774[/C][/ROW]
[ROW][C]575.22343178314[/C][/ROW]
[ROW][C]-675.977088920678[/C][/ROW]
[ROW][C]964.105083611734[/C][/ROW]
[ROW][C]-985.20223413236[/C][/ROW]
[ROW][C]-90.6798507383488[/C][/ROW]
[ROW][C]-121.024474917569[/C][/ROW]
[ROW][C]-166.838259312123[/C][/ROW]
[ROW][C]-26.9771629104613[/C][/ROW]
[ROW][C]6.1385957833859[/C][/ROW]
[ROW][C]171.057951354712[/C][/ROW]
[ROW][C]18.1599006949306[/C][/ROW]
[ROW][C]-1161.16622559775[/C][/ROW]
[ROW][C]17.8684254754743[/C][/ROW]
[ROW][C]-34.0938501480774[/C][/ROW]
[ROW][C]413.474910175273[/C][/ROW]
[ROW][C]-307.711577223802[/C][/ROW]
[ROW][C]602.475786753365[/C][/ROW]
[ROW][C]540.065609154372[/C][/ROW]
[/TABLE]
Source: https://freestatistics.org/blog/index.php?pk=7760&T=2

Globally Unique Identifier (entire table): ba.freestatistics.org/blog/index.php?pk=7760&T=2

As an alternative you can also use a QR Code:  

The GUIDs for individual cells are displayed in the table below:

Estimated ARIMA Residuals
Value
-26.9187469810876
32.874489387891
55.4109661945276
-411.740218895421
57.6733737633629
-449.467581034991
-373.137339219786
-371.885252056547
647.419900104101
22.1523873805244
120.184757841137
67.8888120330147
-152.178661396321
231.692050126901
145.757895879761
225.957394333699
337.679772954793
659.938431816578
220.144078002751
568.176791409846
348.725688751759
-773.427863750167
498.38970904353
-602.642890302524
-236.529593612675
-3.05556298875158
392.249606246461
-104.550624189284
682.677984138286
-319.622690005149
315.541866099491
-660.840435525499
-420.191537655717
-277.196634339462
214.812779686457
-48.212892846644
-710.905914493365
-581.694767515458
-463.052581193947
23.9970209408294
-281.457845858963
-536.338283342713
35.4711023289096
241.984285406962
380.351841879643
500.008616361698
182.200659128449
-675.434091344352
198.846676202320
-126.639122463669
186.007671918163
601.909319356326
20.3167698321624
-68.1288115494744
259.690820578064
-61.7095797836514
-647.712668790697
-295.901619150497
-605.509356504182
-98.046012972324
270.083300740681
-442.289624599786
-38.8754805600827
660.951580547094
-57.6441355331235
-231.023829802187
-252.085124727441
115.231007902820
748.358137075023
405.44716695319
-849.686777864503
695.692017672714
175.799998798506
244.333601485961
7.89489659545201
74.8741067960001
-21.1310352998892
462.378548091352
-214.580694018194
-464.829610996476
100.794657909799
517.088499003938
-359.030784626636
-227.25098999516
-634.829213278288
163.911850756588
844.727539602654
-309.728276460699
715.917713811229
831.323237867774
575.22343178314
-675.977088920678
964.105083611734
-985.20223413236
-90.6798507383488
-121.024474917569
-166.838259312123
-26.9771629104613
6.1385957833859
171.057951354712
18.1599006949306
-1161.16622559775
17.8684254754743
-34.0938501480774
413.474910175273
-307.711577223802
602.475786753365
540.065609154372


Parameters (Session):
par1 = FALSE ; par2 = 1 ; par3 = 1 ; par4 = 1 ; par5 = 12 ; par6 = 3 ; par7 = 1 ; par8 = 2 ; par9 = 1 ;
Parameters (R input):
par1 = FALSE ; par2 = 1 ; par3 = 1 ; par4 = 1 ; par5 = 12 ; par6 = 3 ; par7 = 1 ; par8 = 2 ; par9 = 1 ;
R code (references can be found in the software module):
library(lattice)
if (par1 == 'TRUE') par1 <- TRUE
if (par1 == 'FALSE') par1 <- FALSE
par2 <- as.numeric(par2) #Box-Cox lambda transformation parameter
par3 <- as.numeric(par3) #degree of non-seasonal differencing
par4 <- as.numeric(par4) #degree of seasonal differencing
par5 <- as.numeric(par5) #seasonal period
par6 <- as.numeric(par6) #degree (p) of the non-seasonal AR(p) polynomial
par7 <- as.numeric(par7) #degree (q) of the non-seasonal MA(q) polynomial
par8 <- as.numeric(par8) #degree (P) of the seasonal AR(P) polynomial
par9 <- as.numeric(par9) #degree (Q) of the seasonal MA(Q) polynomial
armaGR <- function(arima.out, names, n){
try1 <- arima.out$coef
try2 <- sqrt(diag(arima.out$var.coef))
try.data.frame <- data.frame(matrix(NA,ncol=4,nrow=length(names)))
dimnames(try.data.frame) <- list(names,c('coef','std','tstat','pv'))
try.data.frame[,1] <- try1
for(i in 1:length(try2)) try.data.frame[which(rownames(try.data.frame)==names(try2)[i]),2] <- try2[i]
try.data.frame[,3] <- try.data.frame[,1] / try.data.frame[,2]
try.data.frame[,4] <- round((1-pt(abs(try.data.frame[,3]),df=n-(length(try2)+1)))*2,5)
vector <- rep(NA,length(names))
vector[is.na(try.data.frame[,4])] <- 0
maxi <- which.max(try.data.frame[,4])
continue <- max(try.data.frame[,4],na.rm=TRUE) > .05
vector[maxi] <- 0
list(summary=try.data.frame,next.vector=vector,continue=continue)
}
arimaSelect <- function(series, order=c(13,0,0), seasonal=list(order=c(2,0,0),period=12), include.mean=F){
nrc <- order[1]+order[3]+seasonal$order[1]+seasonal$order[3]
coeff <- matrix(NA, nrow=nrc*2, ncol=nrc)
pval <- matrix(NA, nrow=nrc*2, ncol=nrc)
mylist <- rep(list(NULL), nrc)
names <- NULL
if(order[1] > 0) names <- paste('ar',1:order[1],sep='')
if(order[3] > 0) names <- c( names , paste('ma',1:order[3],sep='') )
if(seasonal$order[1] > 0) names <- c(names, paste('sar',1:seasonal$order[1],sep=''))
if(seasonal$order[3] > 0) names <- c(names, paste('sma',1:seasonal$order[3],sep=''))
arima.out <- arima(series, order=order, seasonal=seasonal, include.mean=include.mean, method='ML')
mylist[[1]] <- arima.out
last.arma <- armaGR(arima.out, names, length(series))
mystop <- FALSE
i <- 1
coeff[i,] <- last.arma[[1]][,1]
pval [i,] <- last.arma[[1]][,4]
i <- 2
aic <- arima.out$aic
while(!mystop){
mylist[[i]] <- arima.out
arima.out <- arima(series, order=order, seasonal=seasonal, include.mean=include.mean, method='ML', fixed=last.arma$next.vector)
aic <- c(aic, arima.out$aic)
last.arma <- armaGR(arima.out, names, length(series))
mystop <- !last.arma$continue
coeff[i,] <- last.arma[[1]][,1]
pval [i,] <- last.arma[[1]][,4]
i <- i+1
}
list(coeff, pval, mylist, aic=aic)
}
arimaSelectplot <- function(arimaSelect.out,noms,choix){
noms <- names(arimaSelect.out[[3]][[1]]$coef)
coeff <- arimaSelect.out[[1]]
k <- min(which(is.na(coeff[,1])))-1
coeff <- coeff[1:k,]
pval <- arimaSelect.out[[2]][1:k,]
aic <- arimaSelect.out$aic[1:k]
coeff[coeff==0] <- NA
n <- ncol(coeff)
if(missing(choix)) choix <- k
layout(matrix(c(1,1,1,2,
3,3,3,2,
3,3,3,4,
5,6,7,7),nr=4),
widths=c(10,35,45,15),
heights=c(30,30,15,15))
couleurs <- rainbow(75)[1:50]#(50)
ticks <- pretty(coeff)
par(mar=c(1,1,3,1))
plot(aic,k:1-.5,type='o',pch=21,bg='blue',cex=2,axes=F,lty=2,xpd=NA)
points(aic[choix],k-choix+.5,pch=21,cex=4,bg=2,xpd=NA)
title('aic',line=2)
par(mar=c(3,0,0,0))
plot(0,axes=F,xlab='',ylab='',xlim=range(ticks),ylim=c(.1,1))
rect(xleft = min(ticks) + (0:49)/50*(max(ticks)-min(ticks)),
xright = min(ticks) + (1:50)/50*(max(ticks)-min(ticks)),
ytop = rep(1,50),
ybottom= rep(0,50),col=couleurs,border=NA)
axis(1,ticks)
rect(xleft=min(ticks),xright=max(ticks),ytop=1,ybottom=0)
text(mean(coeff,na.rm=T),.5,'coefficients',cex=2,font=2)
par(mar=c(1,1,3,1))
image(1:n,1:k,t(coeff[k:1,]),axes=F,col=couleurs,zlim=range(ticks))
for(i in 1:n) for(j in 1:k) if(!is.na(coeff[j,i])) {
if(pval[j,i]<.01) symb = 'green'
else if( (pval[j,i]<.05) & (pval[j,i]>=.01)) symb = 'orange'
else if( (pval[j,i]<.1) & (pval[j,i]>=.05)) symb = 'red'
else symb = 'black'
polygon(c(i+.5 ,i+.2 ,i+.5 ,i+.5),
c(k-j+0.5,k-j+0.5,k-j+0.8,k-j+0.5),
col=symb)
if(j==choix) {
rect(xleft=i-.5,
xright=i+.5,
ybottom=k-j+1.5,
ytop=k-j+.5,
lwd=4)
text(i,
k-j+1,
round(coeff[j,i],2),
cex=1.2,
font=2)
}
else{
rect(xleft=i-.5,xright=i+.5,ybottom=k-j+1.5,ytop=k-j+.5)
text(i,k-j+1,round(coeff[j,i],2),cex=1.2,font=1)
}
}
axis(3,1:n,noms)
par(mar=c(0.5,0,0,0.5))
plot(0,axes=F,xlab='',ylab='',type='n',xlim=c(0,8),ylim=c(-.2,.8))
cols <- c('green','orange','red','black')
niv <- c('0','0.01','0.05','0.1')
for(i in 0:3){
polygon(c(1+2*i ,1+2*i ,1+2*i-.5 ,1+2*i),
c(.4 ,.7 , .4 , .4),
col=cols[i+1])
text(2*i,0.5,niv[i+1],cex=1.5)
}
text(8,.5,1,cex=1.5)
text(4,0,'p-value',cex=2)
box()
residus <- arimaSelect.out[[3]][[choix]]$res
par(mar=c(1,2,4,1))
acf(residus,main='')
title('acf',line=.5)
par(mar=c(1,2,4,1))
pacf(residus,main='')
title('pacf',line=.5)
par(mar=c(2,2,4,1))
qqnorm(residus,main='')
title('qq-norm',line=.5)
residus
}
if (par2 == 0) x <- log(x)
if (par2 != 0) x <- x^par2
(selection <- arimaSelect(x, order=c(par6,par3,par7), seasonal=list(order=c(par8,par4,par9), period=par5)))
bitmap(file='test1.png')
resid <- arimaSelectplot(selection)
dev.off()
resid
bitmap(file='test2.png')
acf(resid,length(resid)/2, main='Residual Autocorrelation Function')
dev.off()
bitmap(file='test3.png')
pacf(resid,length(resid)/2, main='Residual Partial Autocorrelation Function')
dev.off()
bitmap(file='test4.png')
cpgram(resid, main='Residual Cumulative Periodogram')
dev.off()
bitmap(file='test5.png')
hist(resid, main='Residual Histogram', xlab='values of Residuals')
dev.off()
bitmap(file='test6.png')
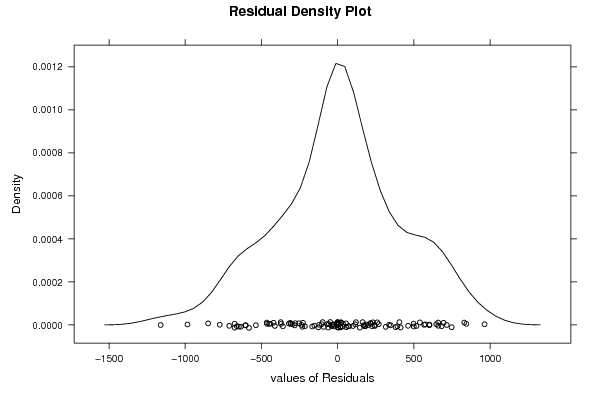
densityplot(~resid,col='black',main='Residual Density Plot', xlab='values of Residuals')
dev.off()
bitmap(file='test7.png')
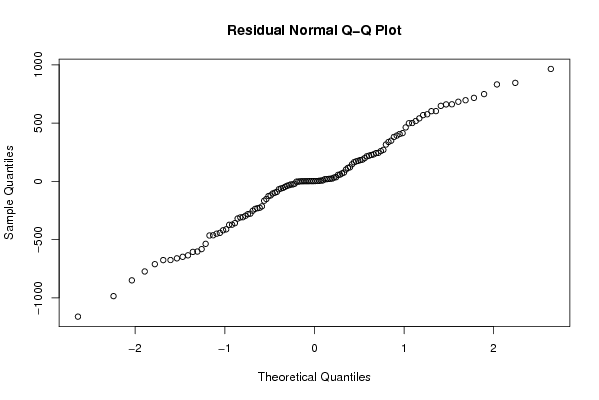
qqnorm(resid, main='Residual Normal Q-Q Plot')
dev.off()
ncols <- length(selection[[1]][1,])
nrows <- length(selection[[2]][,1])-1
load(file='createtable')
a<-table.start()
a<-table.row.start(a)
a<-table.element(a,'ARIMA Parameter Estimation and Backward Selection', ncols+1,TRUE)
a<-table.row.end(a)
a<-table.row.start(a)
a<-table.element(a,'Iteration', header=TRUE)
for (i in 1:ncols) {
a<-table.element(a,names(selection[[3]][[1]]$coef)[i],header=TRUE)
}
a<-table.row.end(a)
for (j in 1:nrows) {
a<-table.row.start(a)
mydum <- 'Estimates ('
mydum <- paste(mydum,j)
mydum <- paste(mydum,')')
a<-table.element(a,mydum, header=TRUE)
for (i in 1:ncols) {
a<-table.element(a,round(selection[[1]][j,i],4))
}
a<-table.row.end(a)
a<-table.row.start(a)
a<-table.element(a,'(p-val)', header=TRUE)
for (i in 1:ncols) {
mydum <- '('
mydum <- paste(mydum,round(selection[[2]][j,i],4),sep='')
mydum <- paste(mydum,')')
a<-table.element(a,mydum)
}
a<-table.row.end(a)
}
a<-table.end(a)
table.save(a,file='mytable.tab')
a<-table.start()
a<-table.row.start(a)
a<-table.element(a,'Estimated ARIMA Residuals', 1,TRUE)
a<-table.row.end(a)
a<-table.row.start(a)
a<-table.element(a,'Value', 1,TRUE)
a<-table.row.end(a)
for (i in (par4*par5+par3):length(resid)) {
a<-table.row.start(a)
a<-table.element(a,resid[i])
a<-table.row.end(a)
}
a<-table.end(a)
table.save(a,file='mytable1.tab')