Free Statistics

of Irreproducible Research!

Author's title

Author*Unverified author*
R Software Modulerwasp_autocorrelation.wasp
Title produced by software(Partial) Autocorrelation Function
Date of computationWed, 24 Dec 2008 07:41:27 -0700
Cite this page as followsStatistical Computations at FreeStatistics.org, Office for Research Development and Education, URL https://freestatistics.org/blog/index.php?v=date/2008/Dec/24/t1230129750a5uaj824ni9e9if.htm/, Retrieved Sun, 19 May 2024 08:45:34 +0000
Statistical Computations at FreeStatistics.org, Office for Research Development and Education, URL https://freestatistics.org/blog/index.php?pk=36595, Retrieved Sun, 19 May 2024 08:45:34 +0000
QR Codes:

Original text written by user:
IsPrivate?No (this computation is public)
User-defined keywords
Estimated Impact163
Family? (F = Feedback message, R = changed R code, M = changed R Module, P = changed Parameters, D = changed Data)
-     [(Partial) Autocorrelation Function] [] [2008-12-24 14:31:53] [74be16979710d4c4e7c6647856088456]
-   P   [(Partial) Autocorrelation Function] [] [2008-12-24 14:35:03] [74be16979710d4c4e7c6647856088456]
-   P       [(Partial) Autocorrelation Function] [] [2008-12-24 14:41:27] [d41d8cd98f00b204e9800998ecf8427e] [Current]
Feedback Forum

Post a new message
Dataseries X:
555
562
561
555
544
537
543
594
611
613
611
594
595
591
589
584
573
567
569
621
629
628
612
595
597
593
590
580
574
573
573
620
626
620
588
566
557
561
549
532
526
511
499
555
565
542
527
510
514
517
508
493
490
469
478
528
534
518
506
502


Summary of computational transaction
Raw Inputview raw input (R code)
Raw Outputview raw output of R engine
Computing time1 seconds
R Server'Gwilym Jenkins' @ 72.249.127.135

\begin{tabular}{lllllllll}
\hline
Summary of computational transaction \tabularnewline
Raw Input & view raw input (R code)  \tabularnewline
Raw Output & view raw output of R engine  \tabularnewline
Computing time & 1 seconds \tabularnewline
R Server & 'Gwilym Jenkins' @ 72.249.127.135 \tabularnewline
\hline
\end{tabular}
%Source: https://freestatistics.org/blog/index.php?pk=36595&T=0

[TABLE]
[ROW][C]Summary of computational transaction[/C][/ROW]
[ROW][C]Raw Input[/C][C]view raw input (R code) [/C][/ROW]
[ROW][C]Raw Output[/C][C]view raw output of R engine [/C][/ROW]
[ROW][C]Computing time[/C][C]1 seconds[/C][/ROW]
[ROW][C]R Server[/C][C]'Gwilym Jenkins' @ 72.249.127.135[/C][/ROW]
[/TABLE]
Source: https://freestatistics.org/blog/index.php?pk=36595&T=0

Globally Unique Identifier (entire table): ba.freestatistics.org/blog/index.php?pk=36595&T=0

As an alternative you can also use a QR Code:  

The GUIDs for individual cells are displayed in the table below:

Summary of computational transaction
Raw Inputview raw input (R code)
Raw Outputview raw output of R engine
Computing time1 seconds
R Server'Gwilym Jenkins' @ 72.249.127.135


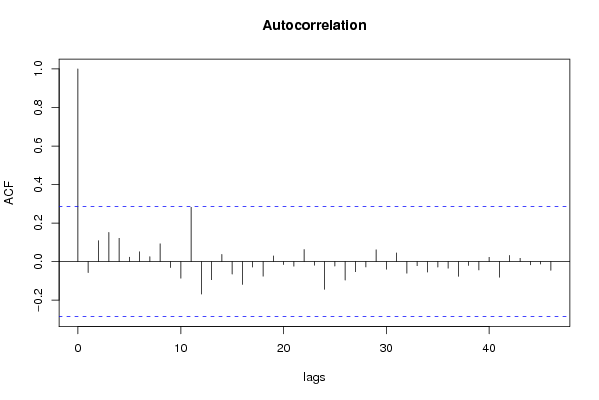
Autocorrelation Function
Time lag kACF(k)T-STATP-value
1-0.056864-0.38980.349208
20.1084310.74340.230481
30.1513071.03730.15245
40.1209680.82930.205559
50.0228290.15650.438153
60.050790.34820.364623
70.0256250.17570.430653
80.0924910.63410.264549
9-0.031185-0.21380.415817
10-0.086338-0.59190.278376
110.2817551.93160.029724
12-0.168471-1.1550.126969
13-0.09393-0.6440.261368
140.0373650.25620.399473
15-0.064856-0.44460.329314
16-0.118855-0.81480.209639
17-0.028555-0.19580.422821
18-0.075938-0.52060.302543
190.029120.19960.421314
20-0.01544-0.10590.458075
21-0.023767-0.16290.435633
220.0622810.4270.335672
23-0.018477-0.12670.44987
24-0.144269-0.98910.16385
25-0.023218-0.15920.437107
26-0.096034-0.65840.256754
27-0.052698-0.36130.359756
28-0.027835-0.19080.424742
290.0614010.42090.337858
30-0.039583-0.27140.393648
310.0449050.30790.379776
32-0.060111-0.41210.341069
33-0.021227-0.14550.44246
34-0.054286-0.37220.355722
35-0.028179-0.19320.423822
36-0.034102-0.23380.408082
37-0.076731-0.5260.300667
38-0.020162-0.13820.445326
39-0.043418-0.29770.383638
400.022480.15410.439089
41-0.081149-0.55630.290313
420.0317340.21760.414358
430.0169010.11590.454125
44-0.016666-0.11430.454759
45-0.012861-0.08820.465059
46-0.045178-0.30970.37907
47NANANA
48NANANA
49NANANA
50NANANA
51NANANA
52NANANA
53NANANA
54NANANA
55NANANA
56NANANA
57NANANA
58NANANA
59NANANA
60NANANA

\begin{tabular}{lllllllll}
\hline
Autocorrelation Function \tabularnewline
Time lag k & ACF(k) & T-STAT & P-value \tabularnewline
1 & -0.056864 & -0.3898 & 0.349208 \tabularnewline
2 & 0.108431 & 0.7434 & 0.230481 \tabularnewline
3 & 0.151307 & 1.0373 & 0.15245 \tabularnewline
4 & 0.120968 & 0.8293 & 0.205559 \tabularnewline
5 & 0.022829 & 0.1565 & 0.438153 \tabularnewline
6 & 0.05079 & 0.3482 & 0.364623 \tabularnewline
7 & 0.025625 & 0.1757 & 0.430653 \tabularnewline
8 & 0.092491 & 0.6341 & 0.264549 \tabularnewline
9 & -0.031185 & -0.2138 & 0.415817 \tabularnewline
10 & -0.086338 & -0.5919 & 0.278376 \tabularnewline
11 & 0.281755 & 1.9316 & 0.029724 \tabularnewline
12 & -0.168471 & -1.155 & 0.126969 \tabularnewline
13 & -0.09393 & -0.644 & 0.261368 \tabularnewline
14 & 0.037365 & 0.2562 & 0.399473 \tabularnewline
15 & -0.064856 & -0.4446 & 0.329314 \tabularnewline
16 & -0.118855 & -0.8148 & 0.209639 \tabularnewline
17 & -0.028555 & -0.1958 & 0.422821 \tabularnewline
18 & -0.075938 & -0.5206 & 0.302543 \tabularnewline
19 & 0.02912 & 0.1996 & 0.421314 \tabularnewline
20 & -0.01544 & -0.1059 & 0.458075 \tabularnewline
21 & -0.023767 & -0.1629 & 0.435633 \tabularnewline
22 & 0.062281 & 0.427 & 0.335672 \tabularnewline
23 & -0.018477 & -0.1267 & 0.44987 \tabularnewline
24 & -0.144269 & -0.9891 & 0.16385 \tabularnewline
25 & -0.023218 & -0.1592 & 0.437107 \tabularnewline
26 & -0.096034 & -0.6584 & 0.256754 \tabularnewline
27 & -0.052698 & -0.3613 & 0.359756 \tabularnewline
28 & -0.027835 & -0.1908 & 0.424742 \tabularnewline
29 & 0.061401 & 0.4209 & 0.337858 \tabularnewline
30 & -0.039583 & -0.2714 & 0.393648 \tabularnewline
31 & 0.044905 & 0.3079 & 0.379776 \tabularnewline
32 & -0.060111 & -0.4121 & 0.341069 \tabularnewline
33 & -0.021227 & -0.1455 & 0.44246 \tabularnewline
34 & -0.054286 & -0.3722 & 0.355722 \tabularnewline
35 & -0.028179 & -0.1932 & 0.423822 \tabularnewline
36 & -0.034102 & -0.2338 & 0.408082 \tabularnewline
37 & -0.076731 & -0.526 & 0.300667 \tabularnewline
38 & -0.020162 & -0.1382 & 0.445326 \tabularnewline
39 & -0.043418 & -0.2977 & 0.383638 \tabularnewline
40 & 0.02248 & 0.1541 & 0.439089 \tabularnewline
41 & -0.081149 & -0.5563 & 0.290313 \tabularnewline
42 & 0.031734 & 0.2176 & 0.414358 \tabularnewline
43 & 0.016901 & 0.1159 & 0.454125 \tabularnewline
44 & -0.016666 & -0.1143 & 0.454759 \tabularnewline
45 & -0.012861 & -0.0882 & 0.465059 \tabularnewline
46 & -0.045178 & -0.3097 & 0.37907 \tabularnewline
47 & NA & NA & NA \tabularnewline
48 & NA & NA & NA \tabularnewline
49 & NA & NA & NA \tabularnewline
50 & NA & NA & NA \tabularnewline
51 & NA & NA & NA \tabularnewline
52 & NA & NA & NA \tabularnewline
53 & NA & NA & NA \tabularnewline
54 & NA & NA & NA \tabularnewline
55 & NA & NA & NA \tabularnewline
56 & NA & NA & NA \tabularnewline
57 & NA & NA & NA \tabularnewline
58 & NA & NA & NA \tabularnewline
59 & NA & NA & NA \tabularnewline
60 & NA & NA & NA \tabularnewline
\hline
\end{tabular}
%Source: https://freestatistics.org/blog/index.php?pk=36595&T=1

[TABLE]
[ROW][C]Autocorrelation Function[/C][/ROW]
[ROW][C]Time lag k[/C][C]ACF(k)[/C][C]T-STAT[/C][C]P-value[/C][/ROW]
[ROW][C]1[/C][C]-0.056864[/C][C]-0.3898[/C][C]0.349208[/C][/ROW]
[ROW][C]2[/C][C]0.108431[/C][C]0.7434[/C][C]0.230481[/C][/ROW]
[ROW][C]3[/C][C]0.151307[/C][C]1.0373[/C][C]0.15245[/C][/ROW]
[ROW][C]4[/C][C]0.120968[/C][C]0.8293[/C][C]0.205559[/C][/ROW]
[ROW][C]5[/C][C]0.022829[/C][C]0.1565[/C][C]0.438153[/C][/ROW]
[ROW][C]6[/C][C]0.05079[/C][C]0.3482[/C][C]0.364623[/C][/ROW]
[ROW][C]7[/C][C]0.025625[/C][C]0.1757[/C][C]0.430653[/C][/ROW]
[ROW][C]8[/C][C]0.092491[/C][C]0.6341[/C][C]0.264549[/C][/ROW]
[ROW][C]9[/C][C]-0.031185[/C][C]-0.2138[/C][C]0.415817[/C][/ROW]
[ROW][C]10[/C][C]-0.086338[/C][C]-0.5919[/C][C]0.278376[/C][/ROW]
[ROW][C]11[/C][C]0.281755[/C][C]1.9316[/C][C]0.029724[/C][/ROW]
[ROW][C]12[/C][C]-0.168471[/C][C]-1.155[/C][C]0.126969[/C][/ROW]
[ROW][C]13[/C][C]-0.09393[/C][C]-0.644[/C][C]0.261368[/C][/ROW]
[ROW][C]14[/C][C]0.037365[/C][C]0.2562[/C][C]0.399473[/C][/ROW]
[ROW][C]15[/C][C]-0.064856[/C][C]-0.4446[/C][C]0.329314[/C][/ROW]
[ROW][C]16[/C][C]-0.118855[/C][C]-0.8148[/C][C]0.209639[/C][/ROW]
[ROW][C]17[/C][C]-0.028555[/C][C]-0.1958[/C][C]0.422821[/C][/ROW]
[ROW][C]18[/C][C]-0.075938[/C][C]-0.5206[/C][C]0.302543[/C][/ROW]
[ROW][C]19[/C][C]0.02912[/C][C]0.1996[/C][C]0.421314[/C][/ROW]
[ROW][C]20[/C][C]-0.01544[/C][C]-0.1059[/C][C]0.458075[/C][/ROW]
[ROW][C]21[/C][C]-0.023767[/C][C]-0.1629[/C][C]0.435633[/C][/ROW]
[ROW][C]22[/C][C]0.062281[/C][C]0.427[/C][C]0.335672[/C][/ROW]
[ROW][C]23[/C][C]-0.018477[/C][C]-0.1267[/C][C]0.44987[/C][/ROW]
[ROW][C]24[/C][C]-0.144269[/C][C]-0.9891[/C][C]0.16385[/C][/ROW]
[ROW][C]25[/C][C]-0.023218[/C][C]-0.1592[/C][C]0.437107[/C][/ROW]
[ROW][C]26[/C][C]-0.096034[/C][C]-0.6584[/C][C]0.256754[/C][/ROW]
[ROW][C]27[/C][C]-0.052698[/C][C]-0.3613[/C][C]0.359756[/C][/ROW]
[ROW][C]28[/C][C]-0.027835[/C][C]-0.1908[/C][C]0.424742[/C][/ROW]
[ROW][C]29[/C][C]0.061401[/C][C]0.4209[/C][C]0.337858[/C][/ROW]
[ROW][C]30[/C][C]-0.039583[/C][C]-0.2714[/C][C]0.393648[/C][/ROW]
[ROW][C]31[/C][C]0.044905[/C][C]0.3079[/C][C]0.379776[/C][/ROW]
[ROW][C]32[/C][C]-0.060111[/C][C]-0.4121[/C][C]0.341069[/C][/ROW]
[ROW][C]33[/C][C]-0.021227[/C][C]-0.1455[/C][C]0.44246[/C][/ROW]
[ROW][C]34[/C][C]-0.054286[/C][C]-0.3722[/C][C]0.355722[/C][/ROW]
[ROW][C]35[/C][C]-0.028179[/C][C]-0.1932[/C][C]0.423822[/C][/ROW]
[ROW][C]36[/C][C]-0.034102[/C][C]-0.2338[/C][C]0.408082[/C][/ROW]
[ROW][C]37[/C][C]-0.076731[/C][C]-0.526[/C][C]0.300667[/C][/ROW]
[ROW][C]38[/C][C]-0.020162[/C][C]-0.1382[/C][C]0.445326[/C][/ROW]
[ROW][C]39[/C][C]-0.043418[/C][C]-0.2977[/C][C]0.383638[/C][/ROW]
[ROW][C]40[/C][C]0.02248[/C][C]0.1541[/C][C]0.439089[/C][/ROW]
[ROW][C]41[/C][C]-0.081149[/C][C]-0.5563[/C][C]0.290313[/C][/ROW]
[ROW][C]42[/C][C]0.031734[/C][C]0.2176[/C][C]0.414358[/C][/ROW]
[ROW][C]43[/C][C]0.016901[/C][C]0.1159[/C][C]0.454125[/C][/ROW]
[ROW][C]44[/C][C]-0.016666[/C][C]-0.1143[/C][C]0.454759[/C][/ROW]
[ROW][C]45[/C][C]-0.012861[/C][C]-0.0882[/C][C]0.465059[/C][/ROW]
[ROW][C]46[/C][C]-0.045178[/C][C]-0.3097[/C][C]0.37907[/C][/ROW]
[ROW][C]47[/C][C]NA[/C][C]NA[/C][C]NA[/C][/ROW]
[ROW][C]48[/C][C]NA[/C][C]NA[/C][C]NA[/C][/ROW]
[ROW][C]49[/C][C]NA[/C][C]NA[/C][C]NA[/C][/ROW]
[ROW][C]50[/C][C]NA[/C][C]NA[/C][C]NA[/C][/ROW]
[ROW][C]51[/C][C]NA[/C][C]NA[/C][C]NA[/C][/ROW]
[ROW][C]52[/C][C]NA[/C][C]NA[/C][C]NA[/C][/ROW]
[ROW][C]53[/C][C]NA[/C][C]NA[/C][C]NA[/C][/ROW]
[ROW][C]54[/C][C]NA[/C][C]NA[/C][C]NA[/C][/ROW]
[ROW][C]55[/C][C]NA[/C][C]NA[/C][C]NA[/C][/ROW]
[ROW][C]56[/C][C]NA[/C][C]NA[/C][C]NA[/C][/ROW]
[ROW][C]57[/C][C]NA[/C][C]NA[/C][C]NA[/C][/ROW]
[ROW][C]58[/C][C]NA[/C][C]NA[/C][C]NA[/C][/ROW]
[ROW][C]59[/C][C]NA[/C][C]NA[/C][C]NA[/C][/ROW]
[ROW][C]60[/C][C]NA[/C][C]NA[/C][C]NA[/C][/ROW]
[/TABLE]
Source: https://freestatistics.org/blog/index.php?pk=36595&T=1

Globally Unique Identifier (entire table): ba.freestatistics.org/blog/index.php?pk=36595&T=1

As an alternative you can also use a QR Code:  

The GUIDs for individual cells are displayed in the table below:

Autocorrelation Function
Time lag kACF(k)T-STATP-value
1-0.056864-0.38980.349208
20.1084310.74340.230481
30.1513071.03730.15245
40.1209680.82930.205559
50.0228290.15650.438153
60.050790.34820.364623
70.0256250.17570.430653
80.0924910.63410.264549
9-0.031185-0.21380.415817
10-0.086338-0.59190.278376
110.2817551.93160.029724
12-0.168471-1.1550.126969
13-0.09393-0.6440.261368
140.0373650.25620.399473
15-0.064856-0.44460.329314
16-0.118855-0.81480.209639
17-0.028555-0.19580.422821
18-0.075938-0.52060.302543
190.029120.19960.421314
20-0.01544-0.10590.458075
21-0.023767-0.16290.435633
220.0622810.4270.335672
23-0.018477-0.12670.44987
24-0.144269-0.98910.16385
25-0.023218-0.15920.437107
26-0.096034-0.65840.256754
27-0.052698-0.36130.359756
28-0.027835-0.19080.424742
290.0614010.42090.337858
30-0.039583-0.27140.393648
310.0449050.30790.379776
32-0.060111-0.41210.341069
33-0.021227-0.14550.44246
34-0.054286-0.37220.355722
35-0.028179-0.19320.423822
36-0.034102-0.23380.408082
37-0.076731-0.5260.300667
38-0.020162-0.13820.445326
39-0.043418-0.29770.383638
400.022480.15410.439089
41-0.081149-0.55630.290313
420.0317340.21760.414358
430.0169010.11590.454125
44-0.016666-0.11430.454759
45-0.012861-0.08820.465059
46-0.045178-0.30970.37907
47NANANA
48NANANA
49NANANA
50NANANA
51NANANA
52NANANA
53NANANA
54NANANA
55NANANA
56NANANA
57NANANA
58NANANA
59NANANA
60NANANA


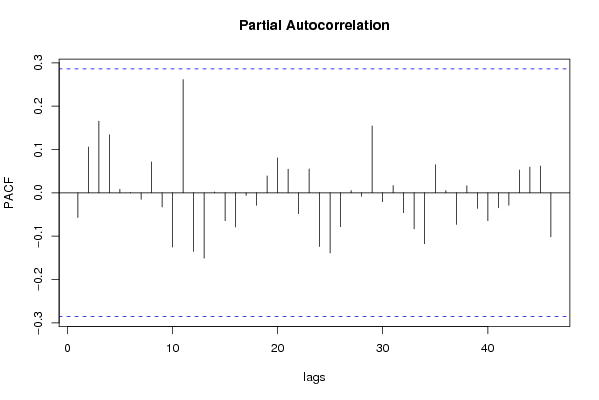
Partial Autocorrelation Function
Time lag kPACF(k)T-STATP-value
1-0.056864-0.38980.349208
20.1055380.72350.236468
30.1651921.13250.131585
40.133860.91770.18173
50.008010.05490.478221
60.0007570.00520.49794
7-0.014987-0.10270.459302
80.0712550.48850.313733
9-0.032705-0.22420.411782
10-0.12535-0.85940.197253
110.2615031.79280.039723
12-0.135284-0.92750.179213
13-0.151025-1.03540.152896
140.001910.01310.494803
15-0.064394-0.44150.330452
16-0.07876-0.540.29589
17-0.006102-0.04180.483403
18-0.028869-0.19790.421982
190.038880.26650.395492
200.0805490.55220.291708
210.0544560.37330.35529
22-0.048346-0.33140.370892
230.054990.3770.353938
24-0.124127-0.8510.199549
25-0.138743-0.95120.17319
26-0.07828-0.53670.297018
270.0051550.03530.48598
28-0.008023-0.0550.478185
290.1542331.05740.147875
30-0.020381-0.13970.444738
310.0166540.11420.454794
32-0.045855-0.31440.377318
33-0.083178-0.57020.285616
34-0.11739-0.80480.212498
350.064940.44520.329107
360.0051250.03510.486061
37-0.072993-0.50040.309559
380.0161570.11080.456137
39-0.035729-0.24490.403782
40-0.0643-0.44080.330682
41-0.034741-0.23820.406392
42-0.028678-0.19660.422491
430.0526150.36070.359967
440.0595530.40830.342464
450.0615930.42230.33738
46-0.101722-0.69740.244502
47NANANA
48NANANA
49NANANA
50NANANA
51NANANA
52NANANA
53NANANA
54NANANA
55NANANA
56NANANA
57NANANA
58NANANA
59NANANA
60NANANA

\begin{tabular}{lllllllll}
\hline
Partial Autocorrelation Function \tabularnewline
Time lag k & PACF(k) & T-STAT & P-value \tabularnewline
1 & -0.056864 & -0.3898 & 0.349208 \tabularnewline
2 & 0.105538 & 0.7235 & 0.236468 \tabularnewline
3 & 0.165192 & 1.1325 & 0.131585 \tabularnewline
4 & 0.13386 & 0.9177 & 0.18173 \tabularnewline
5 & 0.00801 & 0.0549 & 0.478221 \tabularnewline
6 & 0.000757 & 0.0052 & 0.49794 \tabularnewline
7 & -0.014987 & -0.1027 & 0.459302 \tabularnewline
8 & 0.071255 & 0.4885 & 0.313733 \tabularnewline
9 & -0.032705 & -0.2242 & 0.411782 \tabularnewline
10 & -0.12535 & -0.8594 & 0.197253 \tabularnewline
11 & 0.261503 & 1.7928 & 0.039723 \tabularnewline
12 & -0.135284 & -0.9275 & 0.179213 \tabularnewline
13 & -0.151025 & -1.0354 & 0.152896 \tabularnewline
14 & 0.00191 & 0.0131 & 0.494803 \tabularnewline
15 & -0.064394 & -0.4415 & 0.330452 \tabularnewline
16 & -0.07876 & -0.54 & 0.29589 \tabularnewline
17 & -0.006102 & -0.0418 & 0.483403 \tabularnewline
18 & -0.028869 & -0.1979 & 0.421982 \tabularnewline
19 & 0.03888 & 0.2665 & 0.395492 \tabularnewline
20 & 0.080549 & 0.5522 & 0.291708 \tabularnewline
21 & 0.054456 & 0.3733 & 0.35529 \tabularnewline
22 & -0.048346 & -0.3314 & 0.370892 \tabularnewline
23 & 0.05499 & 0.377 & 0.353938 \tabularnewline
24 & -0.124127 & -0.851 & 0.199549 \tabularnewline
25 & -0.138743 & -0.9512 & 0.17319 \tabularnewline
26 & -0.07828 & -0.5367 & 0.297018 \tabularnewline
27 & 0.005155 & 0.0353 & 0.48598 \tabularnewline
28 & -0.008023 & -0.055 & 0.478185 \tabularnewline
29 & 0.154233 & 1.0574 & 0.147875 \tabularnewline
30 & -0.020381 & -0.1397 & 0.444738 \tabularnewline
31 & 0.016654 & 0.1142 & 0.454794 \tabularnewline
32 & -0.045855 & -0.3144 & 0.377318 \tabularnewline
33 & -0.083178 & -0.5702 & 0.285616 \tabularnewline
34 & -0.11739 & -0.8048 & 0.212498 \tabularnewline
35 & 0.06494 & 0.4452 & 0.329107 \tabularnewline
36 & 0.005125 & 0.0351 & 0.486061 \tabularnewline
37 & -0.072993 & -0.5004 & 0.309559 \tabularnewline
38 & 0.016157 & 0.1108 & 0.456137 \tabularnewline
39 & -0.035729 & -0.2449 & 0.403782 \tabularnewline
40 & -0.0643 & -0.4408 & 0.330682 \tabularnewline
41 & -0.034741 & -0.2382 & 0.406392 \tabularnewline
42 & -0.028678 & -0.1966 & 0.422491 \tabularnewline
43 & 0.052615 & 0.3607 & 0.359967 \tabularnewline
44 & 0.059553 & 0.4083 & 0.342464 \tabularnewline
45 & 0.061593 & 0.4223 & 0.33738 \tabularnewline
46 & -0.101722 & -0.6974 & 0.244502 \tabularnewline
47 & NA & NA & NA \tabularnewline
48 & NA & NA & NA \tabularnewline
49 & NA & NA & NA \tabularnewline
50 & NA & NA & NA \tabularnewline
51 & NA & NA & NA \tabularnewline
52 & NA & NA & NA \tabularnewline
53 & NA & NA & NA \tabularnewline
54 & NA & NA & NA \tabularnewline
55 & NA & NA & NA \tabularnewline
56 & NA & NA & NA \tabularnewline
57 & NA & NA & NA \tabularnewline
58 & NA & NA & NA \tabularnewline
59 & NA & NA & NA \tabularnewline
60 & NA & NA & NA \tabularnewline
\hline
\end{tabular}
%Source: https://freestatistics.org/blog/index.php?pk=36595&T=2

[TABLE]
[ROW][C]Partial Autocorrelation Function[/C][/ROW]
[ROW][C]Time lag k[/C][C]PACF(k)[/C][C]T-STAT[/C][C]P-value[/C][/ROW]
[ROW][C]1[/C][C]-0.056864[/C][C]-0.3898[/C][C]0.349208[/C][/ROW]
[ROW][C]2[/C][C]0.105538[/C][C]0.7235[/C][C]0.236468[/C][/ROW]
[ROW][C]3[/C][C]0.165192[/C][C]1.1325[/C][C]0.131585[/C][/ROW]
[ROW][C]4[/C][C]0.13386[/C][C]0.9177[/C][C]0.18173[/C][/ROW]
[ROW][C]5[/C][C]0.00801[/C][C]0.0549[/C][C]0.478221[/C][/ROW]
[ROW][C]6[/C][C]0.000757[/C][C]0.0052[/C][C]0.49794[/C][/ROW]
[ROW][C]7[/C][C]-0.014987[/C][C]-0.1027[/C][C]0.459302[/C][/ROW]
[ROW][C]8[/C][C]0.071255[/C][C]0.4885[/C][C]0.313733[/C][/ROW]
[ROW][C]9[/C][C]-0.032705[/C][C]-0.2242[/C][C]0.411782[/C][/ROW]
[ROW][C]10[/C][C]-0.12535[/C][C]-0.8594[/C][C]0.197253[/C][/ROW]
[ROW][C]11[/C][C]0.261503[/C][C]1.7928[/C][C]0.039723[/C][/ROW]
[ROW][C]12[/C][C]-0.135284[/C][C]-0.9275[/C][C]0.179213[/C][/ROW]
[ROW][C]13[/C][C]-0.151025[/C][C]-1.0354[/C][C]0.152896[/C][/ROW]
[ROW][C]14[/C][C]0.00191[/C][C]0.0131[/C][C]0.494803[/C][/ROW]
[ROW][C]15[/C][C]-0.064394[/C][C]-0.4415[/C][C]0.330452[/C][/ROW]
[ROW][C]16[/C][C]-0.07876[/C][C]-0.54[/C][C]0.29589[/C][/ROW]
[ROW][C]17[/C][C]-0.006102[/C][C]-0.0418[/C][C]0.483403[/C][/ROW]
[ROW][C]18[/C][C]-0.028869[/C][C]-0.1979[/C][C]0.421982[/C][/ROW]
[ROW][C]19[/C][C]0.03888[/C][C]0.2665[/C][C]0.395492[/C][/ROW]
[ROW][C]20[/C][C]0.080549[/C][C]0.5522[/C][C]0.291708[/C][/ROW]
[ROW][C]21[/C][C]0.054456[/C][C]0.3733[/C][C]0.35529[/C][/ROW]
[ROW][C]22[/C][C]-0.048346[/C][C]-0.3314[/C][C]0.370892[/C][/ROW]
[ROW][C]23[/C][C]0.05499[/C][C]0.377[/C][C]0.353938[/C][/ROW]
[ROW][C]24[/C][C]-0.124127[/C][C]-0.851[/C][C]0.199549[/C][/ROW]
[ROW][C]25[/C][C]-0.138743[/C][C]-0.9512[/C][C]0.17319[/C][/ROW]
[ROW][C]26[/C][C]-0.07828[/C][C]-0.5367[/C][C]0.297018[/C][/ROW]
[ROW][C]27[/C][C]0.005155[/C][C]0.0353[/C][C]0.48598[/C][/ROW]
[ROW][C]28[/C][C]-0.008023[/C][C]-0.055[/C][C]0.478185[/C][/ROW]
[ROW][C]29[/C][C]0.154233[/C][C]1.0574[/C][C]0.147875[/C][/ROW]
[ROW][C]30[/C][C]-0.020381[/C][C]-0.1397[/C][C]0.444738[/C][/ROW]
[ROW][C]31[/C][C]0.016654[/C][C]0.1142[/C][C]0.454794[/C][/ROW]
[ROW][C]32[/C][C]-0.045855[/C][C]-0.3144[/C][C]0.377318[/C][/ROW]
[ROW][C]33[/C][C]-0.083178[/C][C]-0.5702[/C][C]0.285616[/C][/ROW]
[ROW][C]34[/C][C]-0.11739[/C][C]-0.8048[/C][C]0.212498[/C][/ROW]
[ROW][C]35[/C][C]0.06494[/C][C]0.4452[/C][C]0.329107[/C][/ROW]
[ROW][C]36[/C][C]0.005125[/C][C]0.0351[/C][C]0.486061[/C][/ROW]
[ROW][C]37[/C][C]-0.072993[/C][C]-0.5004[/C][C]0.309559[/C][/ROW]
[ROW][C]38[/C][C]0.016157[/C][C]0.1108[/C][C]0.456137[/C][/ROW]
[ROW][C]39[/C][C]-0.035729[/C][C]-0.2449[/C][C]0.403782[/C][/ROW]
[ROW][C]40[/C][C]-0.0643[/C][C]-0.4408[/C][C]0.330682[/C][/ROW]
[ROW][C]41[/C][C]-0.034741[/C][C]-0.2382[/C][C]0.406392[/C][/ROW]
[ROW][C]42[/C][C]-0.028678[/C][C]-0.1966[/C][C]0.422491[/C][/ROW]
[ROW][C]43[/C][C]0.052615[/C][C]0.3607[/C][C]0.359967[/C][/ROW]
[ROW][C]44[/C][C]0.059553[/C][C]0.4083[/C][C]0.342464[/C][/ROW]
[ROW][C]45[/C][C]0.061593[/C][C]0.4223[/C][C]0.33738[/C][/ROW]
[ROW][C]46[/C][C]-0.101722[/C][C]-0.6974[/C][C]0.244502[/C][/ROW]
[ROW][C]47[/C][C]NA[/C][C]NA[/C][C]NA[/C][/ROW]
[ROW][C]48[/C][C]NA[/C][C]NA[/C][C]NA[/C][/ROW]
[ROW][C]49[/C][C]NA[/C][C]NA[/C][C]NA[/C][/ROW]
[ROW][C]50[/C][C]NA[/C][C]NA[/C][C]NA[/C][/ROW]
[ROW][C]51[/C][C]NA[/C][C]NA[/C][C]NA[/C][/ROW]
[ROW][C]52[/C][C]NA[/C][C]NA[/C][C]NA[/C][/ROW]
[ROW][C]53[/C][C]NA[/C][C]NA[/C][C]NA[/C][/ROW]
[ROW][C]54[/C][C]NA[/C][C]NA[/C][C]NA[/C][/ROW]
[ROW][C]55[/C][C]NA[/C][C]NA[/C][C]NA[/C][/ROW]
[ROW][C]56[/C][C]NA[/C][C]NA[/C][C]NA[/C][/ROW]
[ROW][C]57[/C][C]NA[/C][C]NA[/C][C]NA[/C][/ROW]
[ROW][C]58[/C][C]NA[/C][C]NA[/C][C]NA[/C][/ROW]
[ROW][C]59[/C][C]NA[/C][C]NA[/C][C]NA[/C][/ROW]
[ROW][C]60[/C][C]NA[/C][C]NA[/C][C]NA[/C][/ROW]
[/TABLE]
Source: https://freestatistics.org/blog/index.php?pk=36595&T=2

Globally Unique Identifier (entire table): ba.freestatistics.org/blog/index.php?pk=36595&T=2

As an alternative you can also use a QR Code:  

The GUIDs for individual cells are displayed in the table below:

Partial Autocorrelation Function
Time lag kPACF(k)T-STATP-value
1-0.056864-0.38980.349208
20.1055380.72350.236468
30.1651921.13250.131585
40.133860.91770.18173
50.008010.05490.478221
60.0007570.00520.49794
7-0.014987-0.10270.459302
80.0712550.48850.313733
9-0.032705-0.22420.411782
10-0.12535-0.85940.197253
110.2615031.79280.039723
12-0.135284-0.92750.179213
13-0.151025-1.03540.152896
140.001910.01310.494803
15-0.064394-0.44150.330452
16-0.07876-0.540.29589
17-0.006102-0.04180.483403
18-0.028869-0.19790.421982
190.038880.26650.395492
200.0805490.55220.291708
210.0544560.37330.35529
22-0.048346-0.33140.370892
230.054990.3770.353938
24-0.124127-0.8510.199549
25-0.138743-0.95120.17319
26-0.07828-0.53670.297018
270.0051550.03530.48598
28-0.008023-0.0550.478185
290.1542331.05740.147875
30-0.020381-0.13970.444738
310.0166540.11420.454794
32-0.045855-0.31440.377318
33-0.083178-0.57020.285616
34-0.11739-0.80480.212498
350.064940.44520.329107
360.0051250.03510.486061
37-0.072993-0.50040.309559
380.0161570.11080.456137
39-0.035729-0.24490.403782
40-0.0643-0.44080.330682
41-0.034741-0.23820.406392
42-0.028678-0.19660.422491
430.0526150.36070.359967
440.0595530.40830.342464
450.0615930.42230.33738
46-0.101722-0.69740.244502
47NANANA
48NANANA
49NANANA
50NANANA
51NANANA
52NANANA
53NANANA
54NANANA
55NANANA
56NANANA
57NANANA
58NANANA
59NANANA
60NANANA


Parameters (Session):
par1 = 60 ; par2 = 1 ; par3 = 1 ; par4 = 1 ; par5 = 12 ;
Parameters (R input):
par1 = 60 ; par2 = 1 ; par3 = 1 ; par4 = 1 ; par5 = 12 ;
R code (references can be found in the software module):
if (par1 == 'Default') {
par1 = 10*log10(length(x))
} else {
par1 <- as.numeric(par1)
}
par2 <- as.numeric(par2)
par3 <- as.numeric(par3)
par4 <- as.numeric(par4)
par5 <- as.numeric(par5)
if (par2 == 0) {
x <- log(x)
} else {
x <- (x ^ par2 - 1) / par2
}
if (par3 > 0) x <- diff(x,lag=1,difference=par3)
if (par4 > 0) x <- diff(x,lag=par5,difference=par4)
bitmap(file='pic1.png')
racf <- acf(x,par1,main='Autocorrelation',xlab='lags',ylab='ACF')
dev.off()
bitmap(file='pic2.png')
rpacf <- pacf(x,par1,main='Partial Autocorrelation',xlab='lags',ylab='PACF')
dev.off()
(myacf <- c(racf$acf))
(mypacf <- c(rpacf$acf))
lengthx <- length(x)
sqrtn <- sqrt(lengthx)
load(file='createtable')
a<-table.start()
a<-table.row.start(a)
a<-table.element(a,'Autocorrelation Function',4,TRUE)
a<-table.row.end(a)
a<-table.row.start(a)
a<-table.element(a,'Time lag k',header=TRUE)
a<-table.element(a,hyperlink('basics.htm','ACF(k)','click here for more information about the Autocorrelation Function'),header=TRUE)
a<-table.element(a,'T-STAT',header=TRUE)
a<-table.element(a,'P-value',header=TRUE)
a<-table.row.end(a)
for (i in 2:(par1+1)) {
a<-table.row.start(a)
a<-table.element(a,i-1,header=TRUE)
a<-table.element(a,round(myacf[i],6))
mytstat <- myacf[i]*sqrtn
a<-table.element(a,round(mytstat,4))
a<-table.element(a,round(1-pt(abs(mytstat),lengthx),6))
a<-table.row.end(a)
}
a<-table.end(a)
table.save(a,file='mytable.tab')
a<-table.start()
a<-table.row.start(a)
a<-table.element(a,'Partial Autocorrelation Function',4,TRUE)
a<-table.row.end(a)
a<-table.row.start(a)
a<-table.element(a,'Time lag k',header=TRUE)
a<-table.element(a,hyperlink('basics.htm','PACF(k)','click here for more information about the Partial Autocorrelation Function'),header=TRUE)
a<-table.element(a,'T-STAT',header=TRUE)
a<-table.element(a,'P-value',header=TRUE)
a<-table.row.end(a)
for (i in 1:par1) {
a<-table.row.start(a)
a<-table.element(a,i,header=TRUE)
a<-table.element(a,round(mypacf[i],6))
mytstat <- mypacf[i]*sqrtn
a<-table.element(a,round(mytstat,4))
a<-table.element(a,round(1-pt(abs(mytstat),lengthx),6))
a<-table.row.end(a)
}
a<-table.end(a)
table.save(a,file='mytable1.tab')