Free Statistics

of Irreproducible Research!

Author's title

Author*Unverified author*
R Software Modulerwasp_cross.wasp
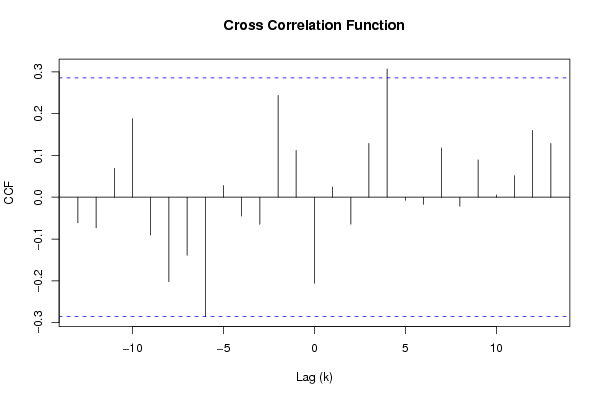
Title produced by softwareCross Correlation Function
Date of computationTue, 23 Dec 2008 15:19:50 -0700
Cite this page as followsStatistical Computations at FreeStatistics.org, Office for Research Development and Education, URL https://freestatistics.org/blog/index.php?v=date/2008/Dec/23/t1230070884c9eal90tszotd4q.htm/, Retrieved Sun, 19 May 2024 09:15:49 +0000
Statistical Computations at FreeStatistics.org, Office for Research Development and Education, URL https://freestatistics.org/blog/index.php?pk=36427, Retrieved Sun, 19 May 2024 09:15:49 +0000
QR Codes:

Original text written by user:
IsPrivate?No (this computation is public)
User-defined keywords
Estimated Impact130
Family? (F = Feedback message, R = changed R code, M = changed R Module, P = changed Parameters, D = changed Data)
-       [Cross Correlation Function] [Cross-correlation] [2008-12-23 22:19:50] [af8fa2ce3787e7eb62013778260b011d] [Current]
Feedback Forum

Post a new message
Dataseries X:
98.6
98
106.8
96.6
100.1
107.7
91.5
97.8
107.4
117.5
105.6
97.4
99.5
98
104.3
100.6
101.1
103.9
96.9
95.5
108.4
117
103.8
100.8
110.6
104
112.6
107.3
98.9
109.8
104.9
102.2
123.9
124.9
112.7
121.9
100.6
104.3
120.4
107.5
102.9
125.6
107.5
108.8
128.4
121.1
119.5
128.7
108.7
105.5
119.8
111.3
110.6
120.1
97.5
107.7
127.3
117.2
119.8
116.2
Dataseries Y:
467
460
448
443
436
431
484
510
513
503
471
471
476
475
470
461
455
456
517
525
523
519
509
512
519
517
510
509
501
507
569
580
578
565
547
555
562
561
555
544
537
543
594
611
613
611
594
595
591
589
584
573
567
569
621
629
628
612
595
597


Summary of computational transaction
Raw Inputview raw input (R code)
Raw Outputview raw output of R engine
Computing time1 seconds
R Server'Sir Ronald Aylmer Fisher' @ 193.190.124.24

\begin{tabular}{lllllllll}
\hline
Summary of computational transaction \tabularnewline
Raw Input & view raw input (R code)  \tabularnewline
Raw Output & view raw output of R engine  \tabularnewline
Computing time & 1 seconds \tabularnewline
R Server & 'Sir Ronald Aylmer Fisher' @ 193.190.124.24 \tabularnewline
\hline
\end{tabular}
%Source: https://freestatistics.org/blog/index.php?pk=36427&T=0

[TABLE]
[ROW][C]Summary of computational transaction[/C][/ROW]
[ROW][C]Raw Input[/C][C]view raw input (R code) [/C][/ROW]
[ROW][C]Raw Output[/C][C]view raw output of R engine [/C][/ROW]
[ROW][C]Computing time[/C][C]1 seconds[/C][/ROW]
[ROW][C]R Server[/C][C]'Sir Ronald Aylmer Fisher' @ 193.190.124.24[/C][/ROW]
[/TABLE]
Source: https://freestatistics.org/blog/index.php?pk=36427&T=0

Globally Unique Identifier (entire table): ba.freestatistics.org/blog/index.php?pk=36427&T=0

As an alternative you can also use a QR Code:  

The GUIDs for individual cells are displayed in the table below:

Summary of computational transaction
Raw Inputview raw input (R code)
Raw Outputview raw output of R engine
Computing time1 seconds
R Server'Sir Ronald Aylmer Fisher' @ 193.190.124.24


Cross Correlation Function
ParameterValue
Box-Cox transformation parameter (lambda) of X series1
Degree of non-seasonal differencing (d) of X series0
Degree of seasonal differencing (D) of X series1
Seasonal Period (s)12
Box-Cox transformation parameter (lambda) of Y series1
Degree of non-seasonal differencing (d) of Y series1
Degree of seasonal differencing (D) of Y series1
krho(Y[t],X[t+k])
-13-0.0613653853702532
-12-0.0731128898664149
-110.0689995115973226
-100.1882173907453
-9-0.0903319646468536
-8-0.202082665333543
-7-0.139088340237663
-6-0.28578890479988
-50.0280651526944697
-4-0.0447887968479469
-3-0.0647724900884862
-20.243556783948636
-10.112097408488649
0-0.205773763959778
10.0247882261246565
2-0.0644206436754052
30.128651821049179
40.307170071882847
5-0.0074074563809164
6-0.0166835401484553
70.117901572523004
8-0.0216475526835237
90.0894043654054088
100.0055174066954841
110.0515106254755788
120.159850064878594
130.128973977709113

\begin{tabular}{lllllllll}
\hline
Cross Correlation Function \tabularnewline
Parameter & Value \tabularnewline
Box-Cox transformation parameter (lambda) of X series & 1 \tabularnewline
Degree of non-seasonal differencing (d) of X series & 0 \tabularnewline
Degree of seasonal differencing (D) of X series & 1 \tabularnewline
Seasonal Period (s) & 12 \tabularnewline
Box-Cox transformation parameter (lambda) of Y series & 1 \tabularnewline
Degree of non-seasonal differencing (d) of Y series & 1 \tabularnewline
Degree of seasonal differencing (D) of Y series & 1 \tabularnewline
k & rho(Y[t],X[t+k]) \tabularnewline
-13 & -0.0613653853702532 \tabularnewline
-12 & -0.0731128898664149 \tabularnewline
-11 & 0.0689995115973226 \tabularnewline
-10 & 0.1882173907453 \tabularnewline
-9 & -0.0903319646468536 \tabularnewline
-8 & -0.202082665333543 \tabularnewline
-7 & -0.139088340237663 \tabularnewline
-6 & -0.28578890479988 \tabularnewline
-5 & 0.0280651526944697 \tabularnewline
-4 & -0.0447887968479469 \tabularnewline
-3 & -0.0647724900884862 \tabularnewline
-2 & 0.243556783948636 \tabularnewline
-1 & 0.112097408488649 \tabularnewline
0 & -0.205773763959778 \tabularnewline
1 & 0.0247882261246565 \tabularnewline
2 & -0.0644206436754052 \tabularnewline
3 & 0.128651821049179 \tabularnewline
4 & 0.307170071882847 \tabularnewline
5 & -0.0074074563809164 \tabularnewline
6 & -0.0166835401484553 \tabularnewline
7 & 0.117901572523004 \tabularnewline
8 & -0.0216475526835237 \tabularnewline
9 & 0.0894043654054088 \tabularnewline
10 & 0.0055174066954841 \tabularnewline
11 & 0.0515106254755788 \tabularnewline
12 & 0.159850064878594 \tabularnewline
13 & 0.128973977709113 \tabularnewline
\hline
\end{tabular}
%Source: https://freestatistics.org/blog/index.php?pk=36427&T=1

[TABLE]
[ROW][C]Cross Correlation Function[/C][/ROW]
[ROW][C]Parameter[/C][C]Value[/C][/ROW]
[ROW][C]Box-Cox transformation parameter (lambda) of X series[/C][C]1[/C][/ROW]
[ROW][C]Degree of non-seasonal differencing (d) of X series[/C][C]0[/C][/ROW]
[ROW][C]Degree of seasonal differencing (D) of X series[/C][C]1[/C][/ROW]
[ROW][C]Seasonal Period (s)[/C][C]12[/C][/ROW]
[ROW][C]Box-Cox transformation parameter (lambda) of Y series[/C][C]1[/C][/ROW]
[ROW][C]Degree of non-seasonal differencing (d) of Y series[/C][C]1[/C][/ROW]
[ROW][C]Degree of seasonal differencing (D) of Y series[/C][C]1[/C][/ROW]
[ROW][C]k[/C][C]rho(Y[t],X[t+k])[/C][/ROW]
[ROW][C]-13[/C][C]-0.0613653853702532[/C][/ROW]
[ROW][C]-12[/C][C]-0.0731128898664149[/C][/ROW]
[ROW][C]-11[/C][C]0.0689995115973226[/C][/ROW]
[ROW][C]-10[/C][C]0.1882173907453[/C][/ROW]
[ROW][C]-9[/C][C]-0.0903319646468536[/C][/ROW]
[ROW][C]-8[/C][C]-0.202082665333543[/C][/ROW]
[ROW][C]-7[/C][C]-0.139088340237663[/C][/ROW]
[ROW][C]-6[/C][C]-0.28578890479988[/C][/ROW]
[ROW][C]-5[/C][C]0.0280651526944697[/C][/ROW]
[ROW][C]-4[/C][C]-0.0447887968479469[/C][/ROW]
[ROW][C]-3[/C][C]-0.0647724900884862[/C][/ROW]
[ROW][C]-2[/C][C]0.243556783948636[/C][/ROW]
[ROW][C]-1[/C][C]0.112097408488649[/C][/ROW]
[ROW][C]0[/C][C]-0.205773763959778[/C][/ROW]
[ROW][C]1[/C][C]0.0247882261246565[/C][/ROW]
[ROW][C]2[/C][C]-0.0644206436754052[/C][/ROW]
[ROW][C]3[/C][C]0.128651821049179[/C][/ROW]
[ROW][C]4[/C][C]0.307170071882847[/C][/ROW]
[ROW][C]5[/C][C]-0.0074074563809164[/C][/ROW]
[ROW][C]6[/C][C]-0.0166835401484553[/C][/ROW]
[ROW][C]7[/C][C]0.117901572523004[/C][/ROW]
[ROW][C]8[/C][C]-0.0216475526835237[/C][/ROW]
[ROW][C]9[/C][C]0.0894043654054088[/C][/ROW]
[ROW][C]10[/C][C]0.0055174066954841[/C][/ROW]
[ROW][C]11[/C][C]0.0515106254755788[/C][/ROW]
[ROW][C]12[/C][C]0.159850064878594[/C][/ROW]
[ROW][C]13[/C][C]0.128973977709113[/C][/ROW]
[/TABLE]
Source: https://freestatistics.org/blog/index.php?pk=36427&T=1

Globally Unique Identifier (entire table): ba.freestatistics.org/blog/index.php?pk=36427&T=1

As an alternative you can also use a QR Code:  

The GUIDs for individual cells are displayed in the table below:

Cross Correlation Function
ParameterValue
Box-Cox transformation parameter (lambda) of X series1
Degree of non-seasonal differencing (d) of X series0
Degree of seasonal differencing (D) of X series1
Seasonal Period (s)12
Box-Cox transformation parameter (lambda) of Y series1
Degree of non-seasonal differencing (d) of Y series1
Degree of seasonal differencing (D) of Y series1
krho(Y[t],X[t+k])
-13-0.0613653853702532
-12-0.0731128898664149
-110.0689995115973226
-100.1882173907453
-9-0.0903319646468536
-8-0.202082665333543
-7-0.139088340237663
-6-0.28578890479988
-50.0280651526944697
-4-0.0447887968479469
-3-0.0647724900884862
-20.243556783948636
-10.112097408488649
0-0.205773763959778
10.0247882261246565
2-0.0644206436754052
30.128651821049179
40.307170071882847
5-0.0074074563809164
6-0.0166835401484553
70.117901572523004
8-0.0216475526835237
90.0894043654054088
100.0055174066954841
110.0515106254755788
120.159850064878594
130.128973977709113


Parameters (Session):
par1 = 1 ; par2 = 0 ; par3 = 1 ; par4 = 12 ; par5 = 1 ; par6 = 1 ; par7 = 1 ;
Parameters (R input):
par1 = 1 ; par2 = 0 ; par3 = 1 ; par4 = 12 ; par5 = 1 ; par6 = 1 ; par7 = 1 ;
R code (references can be found in the software module):
par1 <- as.numeric(par1)
par2 <- as.numeric(par2)
par3 <- as.numeric(par3)
par4 <- as.numeric(par4)
par5 <- as.numeric(par5)
par6 <- as.numeric(par6)
par7 <- as.numeric(par7)
if (par1 == 0) {
x <- log(x)
} else {
x <- (x ^ par1 - 1) / par1
}
if (par5 == 0) {
y <- log(y)
} else {
y <- (y ^ par5 - 1) / par5
}
if (par2 > 0) x <- diff(x,lag=1,difference=par2)
if (par6 > 0) y <- diff(y,lag=1,difference=par6)
if (par3 > 0) x <- diff(x,lag=par4,difference=par3)
if (par7 > 0) y <- diff(y,lag=par4,difference=par7)
x
y
bitmap(file='test1.png')
(r <- ccf(x,y,main='Cross Correlation Function',ylab='CCF',xlab='Lag (k)'))
dev.off()
load(file='createtable')
a<-table.start()
a<-table.row.start(a)
a<-table.element(a,'Cross Correlation Function',2,TRUE)
a<-table.row.end(a)
a<-table.row.start(a)
a<-table.element(a,'Parameter',header=TRUE)
a<-table.element(a,'Value',header=TRUE)
a<-table.row.end(a)
a<-table.row.start(a)
a<-table.element(a,'Box-Cox transformation parameter (lambda) of X series',header=TRUE)
a<-table.element(a,par1)
a<-table.row.end(a)
a<-table.row.start(a)
a<-table.element(a,'Degree of non-seasonal differencing (d) of X series',header=TRUE)
a<-table.element(a,par2)
a<-table.row.end(a)
a<-table.row.start(a)
a<-table.element(a,'Degree of seasonal differencing (D) of X series',header=TRUE)
a<-table.element(a,par3)
a<-table.row.end(a)
a<-table.row.start(a)
a<-table.element(a,'Seasonal Period (s)',header=TRUE)
a<-table.element(a,par4)
a<-table.row.end(a)
a<-table.row.start(a)
a<-table.element(a,'Box-Cox transformation parameter (lambda) of Y series',header=TRUE)
a<-table.element(a,par5)
a<-table.row.end(a)
a<-table.row.start(a)
a<-table.element(a,'Degree of non-seasonal differencing (d) of Y series',header=TRUE)
a<-table.element(a,par6)
a<-table.row.end(a)
a<-table.row.start(a)
a<-table.element(a,'Degree of seasonal differencing (D) of Y series',header=TRUE)
a<-table.element(a,par7)
a<-table.row.end(a)
a<-table.row.start(a)
a<-table.element(a,'k',header=TRUE)
a<-table.element(a,'rho(Y[t],X[t+k])',header=TRUE)
a<-table.row.end(a)
mylength <- length(r$acf)
myhalf <- floor((mylength-1)/2)
for (i in 1:mylength) {
a<-table.row.start(a)
a<-table.element(a,i-myhalf-1,header=TRUE)
a<-table.element(a,r$acf[i])
a<-table.row.end(a)
}
a<-table.end(a)
table.save(a,file='mytable.tab')