Free Statistics

of Irreproducible Research!

Author's title

Author*Unverified author*
R Software Modulerwasp_autocorrelation.wasp
Title produced by software(Partial) Autocorrelation Function
Date of computationTue, 23 Dec 2008 13:47:36 -0700
Cite this page as followsStatistical Computations at FreeStatistics.org, Office for Research Development and Education, URL https://freestatistics.org/blog/index.php?v=date/2008/Dec/23/t1230065315q6irab927uqw06o.htm/, Retrieved Sun, 19 May 2024 09:16:37 +0000
Statistical Computations at FreeStatistics.org, Office for Research Development and Education, URL https://freestatistics.org/blog/index.php?pk=36416, Retrieved Sun, 19 May 2024 09:16:37 +0000
QR Codes:

Original text written by user:
IsPrivate?No (this computation is public)
User-defined keywords
Estimated Impact125
Family? (F = Feedback message, R = changed R code, M = changed R Module, P = changed Parameters, D = changed Data)
-       [(Partial) Autocorrelation Function] [(P)ACF Mannen (d=1) ] [2008-12-23 20:47:36] [f0e1dc59aca2fa8d78080b39899f316a] [Current]
Feedback Forum

Post a new message
Dataseries X:
54156
53661
52441
50648
48141
46127
45623
56527
60205
61321
58088
54623
53495
51824
50518
49050
47111
45264
44357
54862
57871
59070
56273
52837
51702
49447
48965
46922
46256
45200
44471
53119
55016
56641
51847
47990
45744
46390
44461
41582
40813
38096
35461
44375
46255
45610
43375
40167
40628
40590
39473
36735
36634
32806
32907
41076
42254
43215
41116
40373


Summary of computational transaction
Raw Inputview raw input (R code)
Raw Outputview raw output of R engine
Computing time1 seconds
R Server'George Udny Yule' @ 72.249.76.132

\begin{tabular}{lllllllll}
\hline
Summary of computational transaction \tabularnewline
Raw Input & view raw input (R code)  \tabularnewline
Raw Output & view raw output of R engine  \tabularnewline
Computing time & 1 seconds \tabularnewline
R Server & 'George Udny Yule' @ 72.249.76.132 \tabularnewline
\hline
\end{tabular}
%Source: https://freestatistics.org/blog/index.php?pk=36416&T=0

[TABLE]
[ROW][C]Summary of computational transaction[/C][/ROW]
[ROW][C]Raw Input[/C][C]view raw input (R code) [/C][/ROW]
[ROW][C]Raw Output[/C][C]view raw output of R engine [/C][/ROW]
[ROW][C]Computing time[/C][C]1 seconds[/C][/ROW]
[ROW][C]R Server[/C][C]'George Udny Yule' @ 72.249.76.132[/C][/ROW]
[/TABLE]
Source: https://freestatistics.org/blog/index.php?pk=36416&T=0

Globally Unique Identifier (entire table): ba.freestatistics.org/blog/index.php?pk=36416&T=0

As an alternative you can also use a QR Code:  

The GUIDs for individual cells are displayed in the table below:

Summary of computational transaction
Raw Inputview raw input (R code)
Raw Outputview raw output of R engine
Computing time1 seconds
R Server'George Udny Yule' @ 72.249.76.132


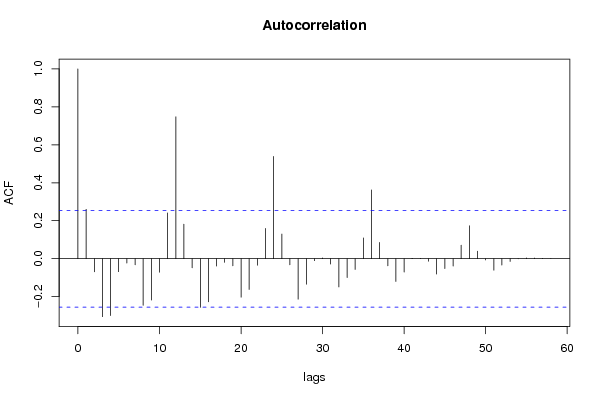
Autocorrelation Function
Time lag kACF(k)T-STATP-value
10.2604892.00090.025008
2-0.069363-0.53280.29809
3-0.305592-2.34730.011143
4-0.30005-2.30470.012359
5-0.068677-0.52750.299907
6-0.023131-0.17770.429795
7-0.032621-0.25060.401508
8-0.245779-1.88790.031983
9-0.217912-1.67380.04973
10-0.070991-0.54530.293804
110.2412271.85290.03445
120.7478915.74470
130.1821.3980.083678
14-0.048345-0.37130.355854
15-0.25633-1.96890.026833
16-0.227097-1.74440.043151
17-0.038793-0.2980.383385
18-0.018928-0.14540.44245
19-0.037415-0.28740.387411
20-0.203284-1.56150.061882
21-0.16246-1.24790.108502
22-0.034561-0.26550.395788
230.1591891.22280.113142
240.5388794.13925.6e-05
250.1300560.9990.160942
26-0.03262-0.25060.401513
27-0.213299-1.63840.053333
28-0.134523-1.03330.152843
29-0.010905-0.08380.466764
300.0036440.0280.488884
31-0.028209-0.21670.414603
32-0.149133-1.14550.128312
33-0.09949-0.76420.223897
34-0.057082-0.43850.331328
350.1091210.83820.202657
360.3625782.7850.003592
370.0852980.65520.257447
38-0.037632-0.28910.386775
39-0.120291-0.9240.179632
40-0.070645-0.54260.294714
410.0018960.01460.494214
420.001490.01140.495453
43-0.01308-0.10050.460157
44-0.081276-0.62430.267422
45-0.051884-0.39850.34584
46-0.039192-0.3010.382222
470.0712540.54730.293113
480.1731931.33030.094266
490.0396940.30490.380759
50-0.006789-0.05210.479294
51-0.060874-0.46760.320904
52-0.033559-0.25780.398741
53-0.014349-0.11020.456305
54-0.000444-0.00340.498647
550.0036760.02820.488783
560.0033880.0260.489662
570.0014450.01110.495592
580.0001940.00150.499407
59NANANA
60NANANA

\begin{tabular}{lllllllll}
\hline
Autocorrelation Function \tabularnewline
Time lag k & ACF(k) & T-STAT & P-value \tabularnewline
1 & 0.260489 & 2.0009 & 0.025008 \tabularnewline
2 & -0.069363 & -0.5328 & 0.29809 \tabularnewline
3 & -0.305592 & -2.3473 & 0.011143 \tabularnewline
4 & -0.30005 & -2.3047 & 0.012359 \tabularnewline
5 & -0.068677 & -0.5275 & 0.299907 \tabularnewline
6 & -0.023131 & -0.1777 & 0.429795 \tabularnewline
7 & -0.032621 & -0.2506 & 0.401508 \tabularnewline
8 & -0.245779 & -1.8879 & 0.031983 \tabularnewline
9 & -0.217912 & -1.6738 & 0.04973 \tabularnewline
10 & -0.070991 & -0.5453 & 0.293804 \tabularnewline
11 & 0.241227 & 1.8529 & 0.03445 \tabularnewline
12 & 0.747891 & 5.7447 & 0 \tabularnewline
13 & 0.182 & 1.398 & 0.083678 \tabularnewline
14 & -0.048345 & -0.3713 & 0.355854 \tabularnewline
15 & -0.25633 & -1.9689 & 0.026833 \tabularnewline
16 & -0.227097 & -1.7444 & 0.043151 \tabularnewline
17 & -0.038793 & -0.298 & 0.383385 \tabularnewline
18 & -0.018928 & -0.1454 & 0.44245 \tabularnewline
19 & -0.037415 & -0.2874 & 0.387411 \tabularnewline
20 & -0.203284 & -1.5615 & 0.061882 \tabularnewline
21 & -0.16246 & -1.2479 & 0.108502 \tabularnewline
22 & -0.034561 & -0.2655 & 0.395788 \tabularnewline
23 & 0.159189 & 1.2228 & 0.113142 \tabularnewline
24 & 0.538879 & 4.1392 & 5.6e-05 \tabularnewline
25 & 0.130056 & 0.999 & 0.160942 \tabularnewline
26 & -0.03262 & -0.2506 & 0.401513 \tabularnewline
27 & -0.213299 & -1.6384 & 0.053333 \tabularnewline
28 & -0.134523 & -1.0333 & 0.152843 \tabularnewline
29 & -0.010905 & -0.0838 & 0.466764 \tabularnewline
30 & 0.003644 & 0.028 & 0.488884 \tabularnewline
31 & -0.028209 & -0.2167 & 0.414603 \tabularnewline
32 & -0.149133 & -1.1455 & 0.128312 \tabularnewline
33 & -0.09949 & -0.7642 & 0.223897 \tabularnewline
34 & -0.057082 & -0.4385 & 0.331328 \tabularnewline
35 & 0.109121 & 0.8382 & 0.202657 \tabularnewline
36 & 0.362578 & 2.785 & 0.003592 \tabularnewline
37 & 0.085298 & 0.6552 & 0.257447 \tabularnewline
38 & -0.037632 & -0.2891 & 0.386775 \tabularnewline
39 & -0.120291 & -0.924 & 0.179632 \tabularnewline
40 & -0.070645 & -0.5426 & 0.294714 \tabularnewline
41 & 0.001896 & 0.0146 & 0.494214 \tabularnewline
42 & 0.00149 & 0.0114 & 0.495453 \tabularnewline
43 & -0.01308 & -0.1005 & 0.460157 \tabularnewline
44 & -0.081276 & -0.6243 & 0.267422 \tabularnewline
45 & -0.051884 & -0.3985 & 0.34584 \tabularnewline
46 & -0.039192 & -0.301 & 0.382222 \tabularnewline
47 & 0.071254 & 0.5473 & 0.293113 \tabularnewline
48 & 0.173193 & 1.3303 & 0.094266 \tabularnewline
49 & 0.039694 & 0.3049 & 0.380759 \tabularnewline
50 & -0.006789 & -0.0521 & 0.479294 \tabularnewline
51 & -0.060874 & -0.4676 & 0.320904 \tabularnewline
52 & -0.033559 & -0.2578 & 0.398741 \tabularnewline
53 & -0.014349 & -0.1102 & 0.456305 \tabularnewline
54 & -0.000444 & -0.0034 & 0.498647 \tabularnewline
55 & 0.003676 & 0.0282 & 0.488783 \tabularnewline
56 & 0.003388 & 0.026 & 0.489662 \tabularnewline
57 & 0.001445 & 0.0111 & 0.495592 \tabularnewline
58 & 0.000194 & 0.0015 & 0.499407 \tabularnewline
59 & NA & NA & NA \tabularnewline
60 & NA & NA & NA \tabularnewline
\hline
\end{tabular}
%Source: https://freestatistics.org/blog/index.php?pk=36416&T=1

[TABLE]
[ROW][C]Autocorrelation Function[/C][/ROW]
[ROW][C]Time lag k[/C][C]ACF(k)[/C][C]T-STAT[/C][C]P-value[/C][/ROW]
[ROW][C]1[/C][C]0.260489[/C][C]2.0009[/C][C]0.025008[/C][/ROW]
[ROW][C]2[/C][C]-0.069363[/C][C]-0.5328[/C][C]0.29809[/C][/ROW]
[ROW][C]3[/C][C]-0.305592[/C][C]-2.3473[/C][C]0.011143[/C][/ROW]
[ROW][C]4[/C][C]-0.30005[/C][C]-2.3047[/C][C]0.012359[/C][/ROW]
[ROW][C]5[/C][C]-0.068677[/C][C]-0.5275[/C][C]0.299907[/C][/ROW]
[ROW][C]6[/C][C]-0.023131[/C][C]-0.1777[/C][C]0.429795[/C][/ROW]
[ROW][C]7[/C][C]-0.032621[/C][C]-0.2506[/C][C]0.401508[/C][/ROW]
[ROW][C]8[/C][C]-0.245779[/C][C]-1.8879[/C][C]0.031983[/C][/ROW]
[ROW][C]9[/C][C]-0.217912[/C][C]-1.6738[/C][C]0.04973[/C][/ROW]
[ROW][C]10[/C][C]-0.070991[/C][C]-0.5453[/C][C]0.293804[/C][/ROW]
[ROW][C]11[/C][C]0.241227[/C][C]1.8529[/C][C]0.03445[/C][/ROW]
[ROW][C]12[/C][C]0.747891[/C][C]5.7447[/C][C]0[/C][/ROW]
[ROW][C]13[/C][C]0.182[/C][C]1.398[/C][C]0.083678[/C][/ROW]
[ROW][C]14[/C][C]-0.048345[/C][C]-0.3713[/C][C]0.355854[/C][/ROW]
[ROW][C]15[/C][C]-0.25633[/C][C]-1.9689[/C][C]0.026833[/C][/ROW]
[ROW][C]16[/C][C]-0.227097[/C][C]-1.7444[/C][C]0.043151[/C][/ROW]
[ROW][C]17[/C][C]-0.038793[/C][C]-0.298[/C][C]0.383385[/C][/ROW]
[ROW][C]18[/C][C]-0.018928[/C][C]-0.1454[/C][C]0.44245[/C][/ROW]
[ROW][C]19[/C][C]-0.037415[/C][C]-0.2874[/C][C]0.387411[/C][/ROW]
[ROW][C]20[/C][C]-0.203284[/C][C]-1.5615[/C][C]0.061882[/C][/ROW]
[ROW][C]21[/C][C]-0.16246[/C][C]-1.2479[/C][C]0.108502[/C][/ROW]
[ROW][C]22[/C][C]-0.034561[/C][C]-0.2655[/C][C]0.395788[/C][/ROW]
[ROW][C]23[/C][C]0.159189[/C][C]1.2228[/C][C]0.113142[/C][/ROW]
[ROW][C]24[/C][C]0.538879[/C][C]4.1392[/C][C]5.6e-05[/C][/ROW]
[ROW][C]25[/C][C]0.130056[/C][C]0.999[/C][C]0.160942[/C][/ROW]
[ROW][C]26[/C][C]-0.03262[/C][C]-0.2506[/C][C]0.401513[/C][/ROW]
[ROW][C]27[/C][C]-0.213299[/C][C]-1.6384[/C][C]0.053333[/C][/ROW]
[ROW][C]28[/C][C]-0.134523[/C][C]-1.0333[/C][C]0.152843[/C][/ROW]
[ROW][C]29[/C][C]-0.010905[/C][C]-0.0838[/C][C]0.466764[/C][/ROW]
[ROW][C]30[/C][C]0.003644[/C][C]0.028[/C][C]0.488884[/C][/ROW]
[ROW][C]31[/C][C]-0.028209[/C][C]-0.2167[/C][C]0.414603[/C][/ROW]
[ROW][C]32[/C][C]-0.149133[/C][C]-1.1455[/C][C]0.128312[/C][/ROW]
[ROW][C]33[/C][C]-0.09949[/C][C]-0.7642[/C][C]0.223897[/C][/ROW]
[ROW][C]34[/C][C]-0.057082[/C][C]-0.4385[/C][C]0.331328[/C][/ROW]
[ROW][C]35[/C][C]0.109121[/C][C]0.8382[/C][C]0.202657[/C][/ROW]
[ROW][C]36[/C][C]0.362578[/C][C]2.785[/C][C]0.003592[/C][/ROW]
[ROW][C]37[/C][C]0.085298[/C][C]0.6552[/C][C]0.257447[/C][/ROW]
[ROW][C]38[/C][C]-0.037632[/C][C]-0.2891[/C][C]0.386775[/C][/ROW]
[ROW][C]39[/C][C]-0.120291[/C][C]-0.924[/C][C]0.179632[/C][/ROW]
[ROW][C]40[/C][C]-0.070645[/C][C]-0.5426[/C][C]0.294714[/C][/ROW]
[ROW][C]41[/C][C]0.001896[/C][C]0.0146[/C][C]0.494214[/C][/ROW]
[ROW][C]42[/C][C]0.00149[/C][C]0.0114[/C][C]0.495453[/C][/ROW]
[ROW][C]43[/C][C]-0.01308[/C][C]-0.1005[/C][C]0.460157[/C][/ROW]
[ROW][C]44[/C][C]-0.081276[/C][C]-0.6243[/C][C]0.267422[/C][/ROW]
[ROW][C]45[/C][C]-0.051884[/C][C]-0.3985[/C][C]0.34584[/C][/ROW]
[ROW][C]46[/C][C]-0.039192[/C][C]-0.301[/C][C]0.382222[/C][/ROW]
[ROW][C]47[/C][C]0.071254[/C][C]0.5473[/C][C]0.293113[/C][/ROW]
[ROW][C]48[/C][C]0.173193[/C][C]1.3303[/C][C]0.094266[/C][/ROW]
[ROW][C]49[/C][C]0.039694[/C][C]0.3049[/C][C]0.380759[/C][/ROW]
[ROW][C]50[/C][C]-0.006789[/C][C]-0.0521[/C][C]0.479294[/C][/ROW]
[ROW][C]51[/C][C]-0.060874[/C][C]-0.4676[/C][C]0.320904[/C][/ROW]
[ROW][C]52[/C][C]-0.033559[/C][C]-0.2578[/C][C]0.398741[/C][/ROW]
[ROW][C]53[/C][C]-0.014349[/C][C]-0.1102[/C][C]0.456305[/C][/ROW]
[ROW][C]54[/C][C]-0.000444[/C][C]-0.0034[/C][C]0.498647[/C][/ROW]
[ROW][C]55[/C][C]0.003676[/C][C]0.0282[/C][C]0.488783[/C][/ROW]
[ROW][C]56[/C][C]0.003388[/C][C]0.026[/C][C]0.489662[/C][/ROW]
[ROW][C]57[/C][C]0.001445[/C][C]0.0111[/C][C]0.495592[/C][/ROW]
[ROW][C]58[/C][C]0.000194[/C][C]0.0015[/C][C]0.499407[/C][/ROW]
[ROW][C]59[/C][C]NA[/C][C]NA[/C][C]NA[/C][/ROW]
[ROW][C]60[/C][C]NA[/C][C]NA[/C][C]NA[/C][/ROW]
[/TABLE]
Source: https://freestatistics.org/blog/index.php?pk=36416&T=1

Globally Unique Identifier (entire table): ba.freestatistics.org/blog/index.php?pk=36416&T=1

As an alternative you can also use a QR Code:  

The GUIDs for individual cells are displayed in the table below:

Autocorrelation Function
Time lag kACF(k)T-STATP-value
10.2604892.00090.025008
2-0.069363-0.53280.29809
3-0.305592-2.34730.011143
4-0.30005-2.30470.012359
5-0.068677-0.52750.299907
6-0.023131-0.17770.429795
7-0.032621-0.25060.401508
8-0.245779-1.88790.031983
9-0.217912-1.67380.04973
10-0.070991-0.54530.293804
110.2412271.85290.03445
120.7478915.74470
130.1821.3980.083678
14-0.048345-0.37130.355854
15-0.25633-1.96890.026833
16-0.227097-1.74440.043151
17-0.038793-0.2980.383385
18-0.018928-0.14540.44245
19-0.037415-0.28740.387411
20-0.203284-1.56150.061882
21-0.16246-1.24790.108502
22-0.034561-0.26550.395788
230.1591891.22280.113142
240.5388794.13925.6e-05
250.1300560.9990.160942
26-0.03262-0.25060.401513
27-0.213299-1.63840.053333
28-0.134523-1.03330.152843
29-0.010905-0.08380.466764
300.0036440.0280.488884
31-0.028209-0.21670.414603
32-0.149133-1.14550.128312
33-0.09949-0.76420.223897
34-0.057082-0.43850.331328
350.1091210.83820.202657
360.3625782.7850.003592
370.0852980.65520.257447
38-0.037632-0.28910.386775
39-0.120291-0.9240.179632
40-0.070645-0.54260.294714
410.0018960.01460.494214
420.001490.01140.495453
43-0.01308-0.10050.460157
44-0.081276-0.62430.267422
45-0.051884-0.39850.34584
46-0.039192-0.3010.382222
470.0712540.54730.293113
480.1731931.33030.094266
490.0396940.30490.380759
50-0.006789-0.05210.479294
51-0.060874-0.46760.320904
52-0.033559-0.25780.398741
53-0.014349-0.11020.456305
54-0.000444-0.00340.498647
550.0036760.02820.488783
560.0033880.0260.489662
570.0014450.01110.495592
580.0001940.00150.499407
59NANANA
60NANANA


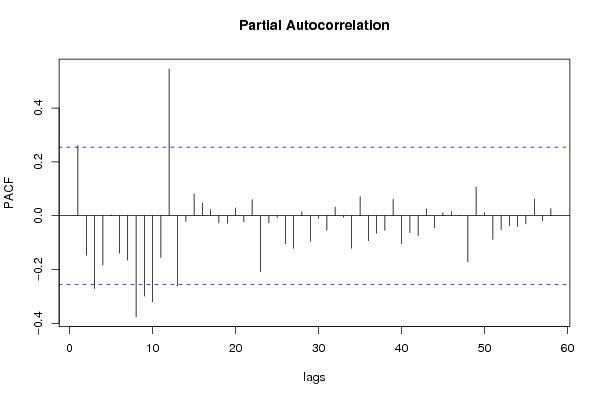
Partial Autocorrelation Function
Time lag kPACF(k)T-STATP-value
10.2604892.00090.025008
2-0.147206-1.13070.131376
3-0.270321-2.07640.021112
4-0.183461-1.40920.082014
50.0030370.02330.490734
6-0.139151-1.06880.144748
7-0.164818-1.2660.105246
8-0.375034-2.88070.002762
9-0.29861-2.29370.012694
10-0.319547-2.45450.008539
11-0.154943-1.19010.119379
120.5452324.1884.8e-05
13-0.259852-1.9960.02528
14-0.021381-0.16420.435057
150.0803020.61680.269867
160.0474380.36440.35844
170.0218080.16750.433771
18-0.026301-0.2020.420297
19-0.028465-0.21860.413842
200.0281970.21660.414639
21-0.022105-0.16980.432878
220.0594250.45650.32487
23-0.208496-1.60150.057305
24-0.025404-0.19510.42298
25-0.00667-0.05120.479656
26-0.104034-0.79910.213719
27-0.120669-0.92690.178884
280.0142030.10910.456748
29-0.094617-0.72680.235122
30-0.009017-0.06930.472509
31-0.053972-0.41460.339981
320.0323440.24840.402328
33-0.00577-0.04430.482401
34-0.120737-0.92740.178749
350.0708730.54440.294114
36-0.092688-0.7120.23965
37-0.0654-0.50230.308647
38-0.054532-0.41890.338416
390.0603860.46380.322237
40-0.103313-0.79360.215316
41-0.062492-0.480.316499
42-0.073847-0.56720.286356
430.0254050.19510.422976
44-0.044287-0.34020.367465
450.0106830.08210.467438
460.0153810.11810.453177
470.0014850.01140.495468
48-0.170937-1.3130.097135
490.1058590.81310.20971
500.0114980.08830.464962
51-0.088312-0.67830.250104
52-0.051493-0.39550.346941
53-0.03796-0.29160.385816
54-0.040362-0.310.378815
55-0.030254-0.23240.408521
560.0622730.47830.317092
57-0.019837-0.15240.439708
580.0267160.20520.419057
59NANANA
60NANANA

\begin{tabular}{lllllllll}
\hline
Partial Autocorrelation Function \tabularnewline
Time lag k & PACF(k) & T-STAT & P-value \tabularnewline
1 & 0.260489 & 2.0009 & 0.025008 \tabularnewline
2 & -0.147206 & -1.1307 & 0.131376 \tabularnewline
3 & -0.270321 & -2.0764 & 0.021112 \tabularnewline
4 & -0.183461 & -1.4092 & 0.082014 \tabularnewline
5 & 0.003037 & 0.0233 & 0.490734 \tabularnewline
6 & -0.139151 & -1.0688 & 0.144748 \tabularnewline
7 & -0.164818 & -1.266 & 0.105246 \tabularnewline
8 & -0.375034 & -2.8807 & 0.002762 \tabularnewline
9 & -0.29861 & -2.2937 & 0.012694 \tabularnewline
10 & -0.319547 & -2.4545 & 0.008539 \tabularnewline
11 & -0.154943 & -1.1901 & 0.119379 \tabularnewline
12 & 0.545232 & 4.188 & 4.8e-05 \tabularnewline
13 & -0.259852 & -1.996 & 0.02528 \tabularnewline
14 & -0.021381 & -0.1642 & 0.435057 \tabularnewline
15 & 0.080302 & 0.6168 & 0.269867 \tabularnewline
16 & 0.047438 & 0.3644 & 0.35844 \tabularnewline
17 & 0.021808 & 0.1675 & 0.433771 \tabularnewline
18 & -0.026301 & -0.202 & 0.420297 \tabularnewline
19 & -0.028465 & -0.2186 & 0.413842 \tabularnewline
20 & 0.028197 & 0.2166 & 0.414639 \tabularnewline
21 & -0.022105 & -0.1698 & 0.432878 \tabularnewline
22 & 0.059425 & 0.4565 & 0.32487 \tabularnewline
23 & -0.208496 & -1.6015 & 0.057305 \tabularnewline
24 & -0.025404 & -0.1951 & 0.42298 \tabularnewline
25 & -0.00667 & -0.0512 & 0.479656 \tabularnewline
26 & -0.104034 & -0.7991 & 0.213719 \tabularnewline
27 & -0.120669 & -0.9269 & 0.178884 \tabularnewline
28 & 0.014203 & 0.1091 & 0.456748 \tabularnewline
29 & -0.094617 & -0.7268 & 0.235122 \tabularnewline
30 & -0.009017 & -0.0693 & 0.472509 \tabularnewline
31 & -0.053972 & -0.4146 & 0.339981 \tabularnewline
32 & 0.032344 & 0.2484 & 0.402328 \tabularnewline
33 & -0.00577 & -0.0443 & 0.482401 \tabularnewline
34 & -0.120737 & -0.9274 & 0.178749 \tabularnewline
35 & 0.070873 & 0.5444 & 0.294114 \tabularnewline
36 & -0.092688 & -0.712 & 0.23965 \tabularnewline
37 & -0.0654 & -0.5023 & 0.308647 \tabularnewline
38 & -0.054532 & -0.4189 & 0.338416 \tabularnewline
39 & 0.060386 & 0.4638 & 0.322237 \tabularnewline
40 & -0.103313 & -0.7936 & 0.215316 \tabularnewline
41 & -0.062492 & -0.48 & 0.316499 \tabularnewline
42 & -0.073847 & -0.5672 & 0.286356 \tabularnewline
43 & 0.025405 & 0.1951 & 0.422976 \tabularnewline
44 & -0.044287 & -0.3402 & 0.367465 \tabularnewline
45 & 0.010683 & 0.0821 & 0.467438 \tabularnewline
46 & 0.015381 & 0.1181 & 0.453177 \tabularnewline
47 & 0.001485 & 0.0114 & 0.495468 \tabularnewline
48 & -0.170937 & -1.313 & 0.097135 \tabularnewline
49 & 0.105859 & 0.8131 & 0.20971 \tabularnewline
50 & 0.011498 & 0.0883 & 0.464962 \tabularnewline
51 & -0.088312 & -0.6783 & 0.250104 \tabularnewline
52 & -0.051493 & -0.3955 & 0.346941 \tabularnewline
53 & -0.03796 & -0.2916 & 0.385816 \tabularnewline
54 & -0.040362 & -0.31 & 0.378815 \tabularnewline
55 & -0.030254 & -0.2324 & 0.408521 \tabularnewline
56 & 0.062273 & 0.4783 & 0.317092 \tabularnewline
57 & -0.019837 & -0.1524 & 0.439708 \tabularnewline
58 & 0.026716 & 0.2052 & 0.419057 \tabularnewline
59 & NA & NA & NA \tabularnewline
60 & NA & NA & NA \tabularnewline
\hline
\end{tabular}
%Source: https://freestatistics.org/blog/index.php?pk=36416&T=2

[TABLE]
[ROW][C]Partial Autocorrelation Function[/C][/ROW]
[ROW][C]Time lag k[/C][C]PACF(k)[/C][C]T-STAT[/C][C]P-value[/C][/ROW]
[ROW][C]1[/C][C]0.260489[/C][C]2.0009[/C][C]0.025008[/C][/ROW]
[ROW][C]2[/C][C]-0.147206[/C][C]-1.1307[/C][C]0.131376[/C][/ROW]
[ROW][C]3[/C][C]-0.270321[/C][C]-2.0764[/C][C]0.021112[/C][/ROW]
[ROW][C]4[/C][C]-0.183461[/C][C]-1.4092[/C][C]0.082014[/C][/ROW]
[ROW][C]5[/C][C]0.003037[/C][C]0.0233[/C][C]0.490734[/C][/ROW]
[ROW][C]6[/C][C]-0.139151[/C][C]-1.0688[/C][C]0.144748[/C][/ROW]
[ROW][C]7[/C][C]-0.164818[/C][C]-1.266[/C][C]0.105246[/C][/ROW]
[ROW][C]8[/C][C]-0.375034[/C][C]-2.8807[/C][C]0.002762[/C][/ROW]
[ROW][C]9[/C][C]-0.29861[/C][C]-2.2937[/C][C]0.012694[/C][/ROW]
[ROW][C]10[/C][C]-0.319547[/C][C]-2.4545[/C][C]0.008539[/C][/ROW]
[ROW][C]11[/C][C]-0.154943[/C][C]-1.1901[/C][C]0.119379[/C][/ROW]
[ROW][C]12[/C][C]0.545232[/C][C]4.188[/C][C]4.8e-05[/C][/ROW]
[ROW][C]13[/C][C]-0.259852[/C][C]-1.996[/C][C]0.02528[/C][/ROW]
[ROW][C]14[/C][C]-0.021381[/C][C]-0.1642[/C][C]0.435057[/C][/ROW]
[ROW][C]15[/C][C]0.080302[/C][C]0.6168[/C][C]0.269867[/C][/ROW]
[ROW][C]16[/C][C]0.047438[/C][C]0.3644[/C][C]0.35844[/C][/ROW]
[ROW][C]17[/C][C]0.021808[/C][C]0.1675[/C][C]0.433771[/C][/ROW]
[ROW][C]18[/C][C]-0.026301[/C][C]-0.202[/C][C]0.420297[/C][/ROW]
[ROW][C]19[/C][C]-0.028465[/C][C]-0.2186[/C][C]0.413842[/C][/ROW]
[ROW][C]20[/C][C]0.028197[/C][C]0.2166[/C][C]0.414639[/C][/ROW]
[ROW][C]21[/C][C]-0.022105[/C][C]-0.1698[/C][C]0.432878[/C][/ROW]
[ROW][C]22[/C][C]0.059425[/C][C]0.4565[/C][C]0.32487[/C][/ROW]
[ROW][C]23[/C][C]-0.208496[/C][C]-1.6015[/C][C]0.057305[/C][/ROW]
[ROW][C]24[/C][C]-0.025404[/C][C]-0.1951[/C][C]0.42298[/C][/ROW]
[ROW][C]25[/C][C]-0.00667[/C][C]-0.0512[/C][C]0.479656[/C][/ROW]
[ROW][C]26[/C][C]-0.104034[/C][C]-0.7991[/C][C]0.213719[/C][/ROW]
[ROW][C]27[/C][C]-0.120669[/C][C]-0.9269[/C][C]0.178884[/C][/ROW]
[ROW][C]28[/C][C]0.014203[/C][C]0.1091[/C][C]0.456748[/C][/ROW]
[ROW][C]29[/C][C]-0.094617[/C][C]-0.7268[/C][C]0.235122[/C][/ROW]
[ROW][C]30[/C][C]-0.009017[/C][C]-0.0693[/C][C]0.472509[/C][/ROW]
[ROW][C]31[/C][C]-0.053972[/C][C]-0.4146[/C][C]0.339981[/C][/ROW]
[ROW][C]32[/C][C]0.032344[/C][C]0.2484[/C][C]0.402328[/C][/ROW]
[ROW][C]33[/C][C]-0.00577[/C][C]-0.0443[/C][C]0.482401[/C][/ROW]
[ROW][C]34[/C][C]-0.120737[/C][C]-0.9274[/C][C]0.178749[/C][/ROW]
[ROW][C]35[/C][C]0.070873[/C][C]0.5444[/C][C]0.294114[/C][/ROW]
[ROW][C]36[/C][C]-0.092688[/C][C]-0.712[/C][C]0.23965[/C][/ROW]
[ROW][C]37[/C][C]-0.0654[/C][C]-0.5023[/C][C]0.308647[/C][/ROW]
[ROW][C]38[/C][C]-0.054532[/C][C]-0.4189[/C][C]0.338416[/C][/ROW]
[ROW][C]39[/C][C]0.060386[/C][C]0.4638[/C][C]0.322237[/C][/ROW]
[ROW][C]40[/C][C]-0.103313[/C][C]-0.7936[/C][C]0.215316[/C][/ROW]
[ROW][C]41[/C][C]-0.062492[/C][C]-0.48[/C][C]0.316499[/C][/ROW]
[ROW][C]42[/C][C]-0.073847[/C][C]-0.5672[/C][C]0.286356[/C][/ROW]
[ROW][C]43[/C][C]0.025405[/C][C]0.1951[/C][C]0.422976[/C][/ROW]
[ROW][C]44[/C][C]-0.044287[/C][C]-0.3402[/C][C]0.367465[/C][/ROW]
[ROW][C]45[/C][C]0.010683[/C][C]0.0821[/C][C]0.467438[/C][/ROW]
[ROW][C]46[/C][C]0.015381[/C][C]0.1181[/C][C]0.453177[/C][/ROW]
[ROW][C]47[/C][C]0.001485[/C][C]0.0114[/C][C]0.495468[/C][/ROW]
[ROW][C]48[/C][C]-0.170937[/C][C]-1.313[/C][C]0.097135[/C][/ROW]
[ROW][C]49[/C][C]0.105859[/C][C]0.8131[/C][C]0.20971[/C][/ROW]
[ROW][C]50[/C][C]0.011498[/C][C]0.0883[/C][C]0.464962[/C][/ROW]
[ROW][C]51[/C][C]-0.088312[/C][C]-0.6783[/C][C]0.250104[/C][/ROW]
[ROW][C]52[/C][C]-0.051493[/C][C]-0.3955[/C][C]0.346941[/C][/ROW]
[ROW][C]53[/C][C]-0.03796[/C][C]-0.2916[/C][C]0.385816[/C][/ROW]
[ROW][C]54[/C][C]-0.040362[/C][C]-0.31[/C][C]0.378815[/C][/ROW]
[ROW][C]55[/C][C]-0.030254[/C][C]-0.2324[/C][C]0.408521[/C][/ROW]
[ROW][C]56[/C][C]0.062273[/C][C]0.4783[/C][C]0.317092[/C][/ROW]
[ROW][C]57[/C][C]-0.019837[/C][C]-0.1524[/C][C]0.439708[/C][/ROW]
[ROW][C]58[/C][C]0.026716[/C][C]0.2052[/C][C]0.419057[/C][/ROW]
[ROW][C]59[/C][C]NA[/C][C]NA[/C][C]NA[/C][/ROW]
[ROW][C]60[/C][C]NA[/C][C]NA[/C][C]NA[/C][/ROW]
[/TABLE]
Source: https://freestatistics.org/blog/index.php?pk=36416&T=2

Globally Unique Identifier (entire table): ba.freestatistics.org/blog/index.php?pk=36416&T=2

As an alternative you can also use a QR Code:  

The GUIDs for individual cells are displayed in the table below:

Partial Autocorrelation Function
Time lag kPACF(k)T-STATP-value
10.2604892.00090.025008
2-0.147206-1.13070.131376
3-0.270321-2.07640.021112
4-0.183461-1.40920.082014
50.0030370.02330.490734
6-0.139151-1.06880.144748
7-0.164818-1.2660.105246
8-0.375034-2.88070.002762
9-0.29861-2.29370.012694
10-0.319547-2.45450.008539
11-0.154943-1.19010.119379
120.5452324.1884.8e-05
13-0.259852-1.9960.02528
14-0.021381-0.16420.435057
150.0803020.61680.269867
160.0474380.36440.35844
170.0218080.16750.433771
18-0.026301-0.2020.420297
19-0.028465-0.21860.413842
200.0281970.21660.414639
21-0.022105-0.16980.432878
220.0594250.45650.32487
23-0.208496-1.60150.057305
24-0.025404-0.19510.42298
25-0.00667-0.05120.479656
26-0.104034-0.79910.213719
27-0.120669-0.92690.178884
280.0142030.10910.456748
29-0.094617-0.72680.235122
30-0.009017-0.06930.472509
31-0.053972-0.41460.339981
320.0323440.24840.402328
33-0.00577-0.04430.482401
34-0.120737-0.92740.178749
350.0708730.54440.294114
36-0.092688-0.7120.23965
37-0.0654-0.50230.308647
38-0.054532-0.41890.338416
390.0603860.46380.322237
40-0.103313-0.79360.215316
41-0.062492-0.480.316499
42-0.073847-0.56720.286356
430.0254050.19510.422976
44-0.044287-0.34020.367465
450.0106830.08210.467438
460.0153810.11810.453177
470.0014850.01140.495468
48-0.170937-1.3130.097135
490.1058590.81310.20971
500.0114980.08830.464962
51-0.088312-0.67830.250104
52-0.051493-0.39550.346941
53-0.03796-0.29160.385816
54-0.040362-0.310.378815
55-0.030254-0.23240.408521
560.0622730.47830.317092
57-0.019837-0.15240.439708
580.0267160.20520.419057
59NANANA
60NANANA


Parameters (Session):
par1 = 60 ; par2 = 1 ; par3 = 1 ; par4 = 0 ; par5 = 12 ;
Parameters (R input):
par1 = 60 ; par2 = 1 ; par3 = 1 ; par4 = 0 ; par5 = 12 ;
R code (references can be found in the software module):
if (par1 == 'Default') {
par1 = 10*log10(length(x))
} else {
par1 <- as.numeric(par1)
}
par2 <- as.numeric(par2)
par3 <- as.numeric(par3)
par4 <- as.numeric(par4)
par5 <- as.numeric(par5)
if (par2 == 0) {
x <- log(x)
} else {
x <- (x ^ par2 - 1) / par2
}
if (par3 > 0) x <- diff(x,lag=1,difference=par3)
if (par4 > 0) x <- diff(x,lag=par5,difference=par4)
bitmap(file='pic1.png')
racf <- acf(x,par1,main='Autocorrelation',xlab='lags',ylab='ACF')
dev.off()
bitmap(file='pic2.png')
rpacf <- pacf(x,par1,main='Partial Autocorrelation',xlab='lags',ylab='PACF')
dev.off()
(myacf <- c(racf$acf))
(mypacf <- c(rpacf$acf))
lengthx <- length(x)
sqrtn <- sqrt(lengthx)
load(file='createtable')
a<-table.start()
a<-table.row.start(a)
a<-table.element(a,'Autocorrelation Function',4,TRUE)
a<-table.row.end(a)
a<-table.row.start(a)
a<-table.element(a,'Time lag k',header=TRUE)
a<-table.element(a,hyperlink('basics.htm','ACF(k)','click here for more information about the Autocorrelation Function'),header=TRUE)
a<-table.element(a,'T-STAT',header=TRUE)
a<-table.element(a,'P-value',header=TRUE)
a<-table.row.end(a)
for (i in 2:(par1+1)) {
a<-table.row.start(a)
a<-table.element(a,i-1,header=TRUE)
a<-table.element(a,round(myacf[i],6))
mytstat <- myacf[i]*sqrtn
a<-table.element(a,round(mytstat,4))
a<-table.element(a,round(1-pt(abs(mytstat),lengthx),6))
a<-table.row.end(a)
}
a<-table.end(a)
table.save(a,file='mytable.tab')
a<-table.start()
a<-table.row.start(a)
a<-table.element(a,'Partial Autocorrelation Function',4,TRUE)
a<-table.row.end(a)
a<-table.row.start(a)
a<-table.element(a,'Time lag k',header=TRUE)
a<-table.element(a,hyperlink('basics.htm','PACF(k)','click here for more information about the Partial Autocorrelation Function'),header=TRUE)
a<-table.element(a,'T-STAT',header=TRUE)
a<-table.element(a,'P-value',header=TRUE)
a<-table.row.end(a)
for (i in 1:par1) {
a<-table.row.start(a)
a<-table.element(a,i,header=TRUE)
a<-table.element(a,round(mypacf[i],6))
mytstat <- mypacf[i]*sqrtn
a<-table.element(a,round(mytstat,4))
a<-table.element(a,round(1-pt(abs(mytstat),lengthx),6))
a<-table.row.end(a)
}
a<-table.end(a)
table.save(a,file='mytable1.tab')