Free Statistics

of Irreproducible Research!

Author's title

Author*Unverified author*
R Software Modulerwasp_autocorrelation.wasp
Title produced by software(Partial) Autocorrelation Function
Date of computationTue, 23 Dec 2008 13:18:55 -0700
Cite this page as followsStatistical Computations at FreeStatistics.org, Office for Research Development and Education, URL https://freestatistics.org/blog/index.php?v=date/2008/Dec/23/t1230063668ookkzudzul12jym.htm/, Retrieved Sun, 19 May 2024 12:38:31 +0000
Statistical Computations at FreeStatistics.org, Office for Research Development and Education, URL https://freestatistics.org/blog/index.php?pk=36402, Retrieved Sun, 19 May 2024 12:38:31 +0000
QR Codes:

Original text written by user:
IsPrivate?No (this computation is public)
User-defined keywords
Estimated Impact119
Family? (F = Feedback message, R = changed R code, M = changed R Module, P = changed Parameters, D = changed Data)
-       [(Partial) Autocorrelation Function] [(P)ACF Vrouwen ] [2008-12-23 20:18:55] [f0e1dc59aca2fa8d78080b39899f316a] [Current]
Feedback Forum

Post a new message
Dataseries X:
54327
53476
52258
50156
47925
45844
47605
63617
67028
65845
60106
55317
53188
51010
49364
47616
45429
43480
44964
61008
64530
62960
57529
52954
51374
49211
47980
45575
44431
43596
45544
60109
63695
60819
54709
49357
46913
46728
44576
41988
40880
37860
38532
52713
56139
50939
46352
42169
42025
41713
40123
37737
36928
33812
36122
48823
51520
47090
42683
39947


Summary of computational transaction
Raw Inputview raw input (R code)
Raw Outputview raw output of R engine
Computing time2 seconds
R Server'Sir Ronald Aylmer Fisher' @ 193.190.124.24

\begin{tabular}{lllllllll}
\hline
Summary of computational transaction \tabularnewline
Raw Input & view raw input (R code)  \tabularnewline
Raw Output & view raw output of R engine  \tabularnewline
Computing time & 2 seconds \tabularnewline
R Server & 'Sir Ronald Aylmer Fisher' @ 193.190.124.24 \tabularnewline
\hline
\end{tabular}
%Source: https://freestatistics.org/blog/index.php?pk=36402&T=0

[TABLE]
[ROW][C]Summary of computational transaction[/C][/ROW]
[ROW][C]Raw Input[/C][C]view raw input (R code) [/C][/ROW]
[ROW][C]Raw Output[/C][C]view raw output of R engine [/C][/ROW]
[ROW][C]Computing time[/C][C]2 seconds[/C][/ROW]
[ROW][C]R Server[/C][C]'Sir Ronald Aylmer Fisher' @ 193.190.124.24[/C][/ROW]
[/TABLE]
Source: https://freestatistics.org/blog/index.php?pk=36402&T=0

Globally Unique Identifier (entire table): ba.freestatistics.org/blog/index.php?pk=36402&T=0

As an alternative you can also use a QR Code:  

The GUIDs for individual cells are displayed in the table below:

Summary of computational transaction
Raw Inputview raw input (R code)
Raw Outputview raw output of R engine
Computing time2 seconds
R Server'Sir Ronald Aylmer Fisher' @ 193.190.124.24


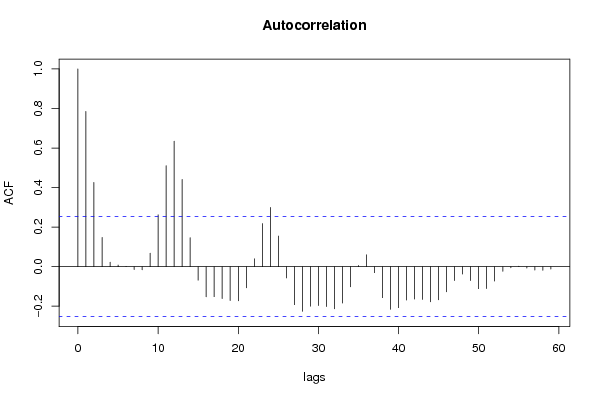
Autocorrelation Function
Time lag kACF(k)T-STATP-value
10.7846346.07780
20.4253093.29440.000829
30.1473151.14110.129181
40.0220010.17040.432626
50.0077280.05990.476233
6-0.001027-0.0080.49684
7-0.014188-0.10990.456429
8-0.016355-0.12670.449808
90.0675440.52320.301384
100.2619362.02890.023454
110.510573.95490.000102
120.6342714.9134e-06
130.4411373.4170.000571
140.1467181.13650.130139
15-0.068274-0.52890.29943
16-0.152754-1.18320.120693
17-0.151979-1.17720.121877
18-0.161121-1.2480.108433
19-0.171129-1.32560.095006
20-0.172654-1.33740.093075
21-0.106798-0.82730.205686
220.0394870.30590.380384
230.2176831.68620.048479
240.2988312.31470.012033
250.1543561.19560.118272
26-0.056882-0.44060.330541
27-0.192343-1.48990.070746
28-0.225623-1.74770.042819
29-0.200073-1.54980.063229
30-0.196311-1.52060.066804
31-0.20177-1.56290.061668
32-0.212993-1.64980.052101
33-0.184252-1.42720.079351
34-0.102162-0.79130.215931
350.0058010.04490.482155
360.0595910.46160.323022
37-0.030486-0.23610.407062
38-0.156965-1.21580.114403
39-0.216137-1.67420.049649
40-0.207625-1.60830.056515
41-0.168871-1.30810.09792
42-0.163621-1.26740.104954
43-0.165667-1.28330.102169
44-0.177349-1.37370.087317
45-0.16797-1.30110.099102
46-0.127151-0.98490.164313
47-0.070111-0.54310.294544
48-0.037161-0.28780.387227
49-0.069981-0.54210.294888
50-0.11133-0.86240.195963
51-0.110997-0.85980.196666
52-0.073267-0.56750.286237
53-0.023325-0.18070.428617
54-0.005685-0.0440.482512
550.0019470.01510.494009
56-0.006609-0.05120.479672
57-0.017113-0.13260.447494
58-0.018636-0.14440.442851
59-0.012116-0.09380.462771
60NANANA

\begin{tabular}{lllllllll}
\hline
Autocorrelation Function \tabularnewline
Time lag k & ACF(k) & T-STAT & P-value \tabularnewline
1 & 0.784634 & 6.0778 & 0 \tabularnewline
2 & 0.425309 & 3.2944 & 0.000829 \tabularnewline
3 & 0.147315 & 1.1411 & 0.129181 \tabularnewline
4 & 0.022001 & 0.1704 & 0.432626 \tabularnewline
5 & 0.007728 & 0.0599 & 0.476233 \tabularnewline
6 & -0.001027 & -0.008 & 0.49684 \tabularnewline
7 & -0.014188 & -0.1099 & 0.456429 \tabularnewline
8 & -0.016355 & -0.1267 & 0.449808 \tabularnewline
9 & 0.067544 & 0.5232 & 0.301384 \tabularnewline
10 & 0.261936 & 2.0289 & 0.023454 \tabularnewline
11 & 0.51057 & 3.9549 & 0.000102 \tabularnewline
12 & 0.634271 & 4.913 & 4e-06 \tabularnewline
13 & 0.441137 & 3.417 & 0.000571 \tabularnewline
14 & 0.146718 & 1.1365 & 0.130139 \tabularnewline
15 & -0.068274 & -0.5289 & 0.29943 \tabularnewline
16 & -0.152754 & -1.1832 & 0.120693 \tabularnewline
17 & -0.151979 & -1.1772 & 0.121877 \tabularnewline
18 & -0.161121 & -1.248 & 0.108433 \tabularnewline
19 & -0.171129 & -1.3256 & 0.095006 \tabularnewline
20 & -0.172654 & -1.3374 & 0.093075 \tabularnewline
21 & -0.106798 & -0.8273 & 0.205686 \tabularnewline
22 & 0.039487 & 0.3059 & 0.380384 \tabularnewline
23 & 0.217683 & 1.6862 & 0.048479 \tabularnewline
24 & 0.298831 & 2.3147 & 0.012033 \tabularnewline
25 & 0.154356 & 1.1956 & 0.118272 \tabularnewline
26 & -0.056882 & -0.4406 & 0.330541 \tabularnewline
27 & -0.192343 & -1.4899 & 0.070746 \tabularnewline
28 & -0.225623 & -1.7477 & 0.042819 \tabularnewline
29 & -0.200073 & -1.5498 & 0.063229 \tabularnewline
30 & -0.196311 & -1.5206 & 0.066804 \tabularnewline
31 & -0.20177 & -1.5629 & 0.061668 \tabularnewline
32 & -0.212993 & -1.6498 & 0.052101 \tabularnewline
33 & -0.184252 & -1.4272 & 0.079351 \tabularnewline
34 & -0.102162 & -0.7913 & 0.215931 \tabularnewline
35 & 0.005801 & 0.0449 & 0.482155 \tabularnewline
36 & 0.059591 & 0.4616 & 0.323022 \tabularnewline
37 & -0.030486 & -0.2361 & 0.407062 \tabularnewline
38 & -0.156965 & -1.2158 & 0.114403 \tabularnewline
39 & -0.216137 & -1.6742 & 0.049649 \tabularnewline
40 & -0.207625 & -1.6083 & 0.056515 \tabularnewline
41 & -0.168871 & -1.3081 & 0.09792 \tabularnewline
42 & -0.163621 & -1.2674 & 0.104954 \tabularnewline
43 & -0.165667 & -1.2833 & 0.102169 \tabularnewline
44 & -0.177349 & -1.3737 & 0.087317 \tabularnewline
45 & -0.16797 & -1.3011 & 0.099102 \tabularnewline
46 & -0.127151 & -0.9849 & 0.164313 \tabularnewline
47 & -0.070111 & -0.5431 & 0.294544 \tabularnewline
48 & -0.037161 & -0.2878 & 0.387227 \tabularnewline
49 & -0.069981 & -0.5421 & 0.294888 \tabularnewline
50 & -0.11133 & -0.8624 & 0.195963 \tabularnewline
51 & -0.110997 & -0.8598 & 0.196666 \tabularnewline
52 & -0.073267 & -0.5675 & 0.286237 \tabularnewline
53 & -0.023325 & -0.1807 & 0.428617 \tabularnewline
54 & -0.005685 & -0.044 & 0.482512 \tabularnewline
55 & 0.001947 & 0.0151 & 0.494009 \tabularnewline
56 & -0.006609 & -0.0512 & 0.479672 \tabularnewline
57 & -0.017113 & -0.1326 & 0.447494 \tabularnewline
58 & -0.018636 & -0.1444 & 0.442851 \tabularnewline
59 & -0.012116 & -0.0938 & 0.462771 \tabularnewline
60 & NA & NA & NA \tabularnewline
\hline
\end{tabular}
%Source: https://freestatistics.org/blog/index.php?pk=36402&T=1

[TABLE]
[ROW][C]Autocorrelation Function[/C][/ROW]
[ROW][C]Time lag k[/C][C]ACF(k)[/C][C]T-STAT[/C][C]P-value[/C][/ROW]
[ROW][C]1[/C][C]0.784634[/C][C]6.0778[/C][C]0[/C][/ROW]
[ROW][C]2[/C][C]0.425309[/C][C]3.2944[/C][C]0.000829[/C][/ROW]
[ROW][C]3[/C][C]0.147315[/C][C]1.1411[/C][C]0.129181[/C][/ROW]
[ROW][C]4[/C][C]0.022001[/C][C]0.1704[/C][C]0.432626[/C][/ROW]
[ROW][C]5[/C][C]0.007728[/C][C]0.0599[/C][C]0.476233[/C][/ROW]
[ROW][C]6[/C][C]-0.001027[/C][C]-0.008[/C][C]0.49684[/C][/ROW]
[ROW][C]7[/C][C]-0.014188[/C][C]-0.1099[/C][C]0.456429[/C][/ROW]
[ROW][C]8[/C][C]-0.016355[/C][C]-0.1267[/C][C]0.449808[/C][/ROW]
[ROW][C]9[/C][C]0.067544[/C][C]0.5232[/C][C]0.301384[/C][/ROW]
[ROW][C]10[/C][C]0.261936[/C][C]2.0289[/C][C]0.023454[/C][/ROW]
[ROW][C]11[/C][C]0.51057[/C][C]3.9549[/C][C]0.000102[/C][/ROW]
[ROW][C]12[/C][C]0.634271[/C][C]4.913[/C][C]4e-06[/C][/ROW]
[ROW][C]13[/C][C]0.441137[/C][C]3.417[/C][C]0.000571[/C][/ROW]
[ROW][C]14[/C][C]0.146718[/C][C]1.1365[/C][C]0.130139[/C][/ROW]
[ROW][C]15[/C][C]-0.068274[/C][C]-0.5289[/C][C]0.29943[/C][/ROW]
[ROW][C]16[/C][C]-0.152754[/C][C]-1.1832[/C][C]0.120693[/C][/ROW]
[ROW][C]17[/C][C]-0.151979[/C][C]-1.1772[/C][C]0.121877[/C][/ROW]
[ROW][C]18[/C][C]-0.161121[/C][C]-1.248[/C][C]0.108433[/C][/ROW]
[ROW][C]19[/C][C]-0.171129[/C][C]-1.3256[/C][C]0.095006[/C][/ROW]
[ROW][C]20[/C][C]-0.172654[/C][C]-1.3374[/C][C]0.093075[/C][/ROW]
[ROW][C]21[/C][C]-0.106798[/C][C]-0.8273[/C][C]0.205686[/C][/ROW]
[ROW][C]22[/C][C]0.039487[/C][C]0.3059[/C][C]0.380384[/C][/ROW]
[ROW][C]23[/C][C]0.217683[/C][C]1.6862[/C][C]0.048479[/C][/ROW]
[ROW][C]24[/C][C]0.298831[/C][C]2.3147[/C][C]0.012033[/C][/ROW]
[ROW][C]25[/C][C]0.154356[/C][C]1.1956[/C][C]0.118272[/C][/ROW]
[ROW][C]26[/C][C]-0.056882[/C][C]-0.4406[/C][C]0.330541[/C][/ROW]
[ROW][C]27[/C][C]-0.192343[/C][C]-1.4899[/C][C]0.070746[/C][/ROW]
[ROW][C]28[/C][C]-0.225623[/C][C]-1.7477[/C][C]0.042819[/C][/ROW]
[ROW][C]29[/C][C]-0.200073[/C][C]-1.5498[/C][C]0.063229[/C][/ROW]
[ROW][C]30[/C][C]-0.196311[/C][C]-1.5206[/C][C]0.066804[/C][/ROW]
[ROW][C]31[/C][C]-0.20177[/C][C]-1.5629[/C][C]0.061668[/C][/ROW]
[ROW][C]32[/C][C]-0.212993[/C][C]-1.6498[/C][C]0.052101[/C][/ROW]
[ROW][C]33[/C][C]-0.184252[/C][C]-1.4272[/C][C]0.079351[/C][/ROW]
[ROW][C]34[/C][C]-0.102162[/C][C]-0.7913[/C][C]0.215931[/C][/ROW]
[ROW][C]35[/C][C]0.005801[/C][C]0.0449[/C][C]0.482155[/C][/ROW]
[ROW][C]36[/C][C]0.059591[/C][C]0.4616[/C][C]0.323022[/C][/ROW]
[ROW][C]37[/C][C]-0.030486[/C][C]-0.2361[/C][C]0.407062[/C][/ROW]
[ROW][C]38[/C][C]-0.156965[/C][C]-1.2158[/C][C]0.114403[/C][/ROW]
[ROW][C]39[/C][C]-0.216137[/C][C]-1.6742[/C][C]0.049649[/C][/ROW]
[ROW][C]40[/C][C]-0.207625[/C][C]-1.6083[/C][C]0.056515[/C][/ROW]
[ROW][C]41[/C][C]-0.168871[/C][C]-1.3081[/C][C]0.09792[/C][/ROW]
[ROW][C]42[/C][C]-0.163621[/C][C]-1.2674[/C][C]0.104954[/C][/ROW]
[ROW][C]43[/C][C]-0.165667[/C][C]-1.2833[/C][C]0.102169[/C][/ROW]
[ROW][C]44[/C][C]-0.177349[/C][C]-1.3737[/C][C]0.087317[/C][/ROW]
[ROW][C]45[/C][C]-0.16797[/C][C]-1.3011[/C][C]0.099102[/C][/ROW]
[ROW][C]46[/C][C]-0.127151[/C][C]-0.9849[/C][C]0.164313[/C][/ROW]
[ROW][C]47[/C][C]-0.070111[/C][C]-0.5431[/C][C]0.294544[/C][/ROW]
[ROW][C]48[/C][C]-0.037161[/C][C]-0.2878[/C][C]0.387227[/C][/ROW]
[ROW][C]49[/C][C]-0.069981[/C][C]-0.5421[/C][C]0.294888[/C][/ROW]
[ROW][C]50[/C][C]-0.11133[/C][C]-0.8624[/C][C]0.195963[/C][/ROW]
[ROW][C]51[/C][C]-0.110997[/C][C]-0.8598[/C][C]0.196666[/C][/ROW]
[ROW][C]52[/C][C]-0.073267[/C][C]-0.5675[/C][C]0.286237[/C][/ROW]
[ROW][C]53[/C][C]-0.023325[/C][C]-0.1807[/C][C]0.428617[/C][/ROW]
[ROW][C]54[/C][C]-0.005685[/C][C]-0.044[/C][C]0.482512[/C][/ROW]
[ROW][C]55[/C][C]0.001947[/C][C]0.0151[/C][C]0.494009[/C][/ROW]
[ROW][C]56[/C][C]-0.006609[/C][C]-0.0512[/C][C]0.479672[/C][/ROW]
[ROW][C]57[/C][C]-0.017113[/C][C]-0.1326[/C][C]0.447494[/C][/ROW]
[ROW][C]58[/C][C]-0.018636[/C][C]-0.1444[/C][C]0.442851[/C][/ROW]
[ROW][C]59[/C][C]-0.012116[/C][C]-0.0938[/C][C]0.462771[/C][/ROW]
[ROW][C]60[/C][C]NA[/C][C]NA[/C][C]NA[/C][/ROW]
[/TABLE]
Source: https://freestatistics.org/blog/index.php?pk=36402&T=1

Globally Unique Identifier (entire table): ba.freestatistics.org/blog/index.php?pk=36402&T=1

As an alternative you can also use a QR Code:  

The GUIDs for individual cells are displayed in the table below:

Autocorrelation Function
Time lag kACF(k)T-STATP-value
10.7846346.07780
20.4253093.29440.000829
30.1473151.14110.129181
40.0220010.17040.432626
50.0077280.05990.476233
6-0.001027-0.0080.49684
7-0.014188-0.10990.456429
8-0.016355-0.12670.449808
90.0675440.52320.301384
100.2619362.02890.023454
110.510573.95490.000102
120.6342714.9134e-06
130.4411373.4170.000571
140.1467181.13650.130139
15-0.068274-0.52890.29943
16-0.152754-1.18320.120693
17-0.151979-1.17720.121877
18-0.161121-1.2480.108433
19-0.171129-1.32560.095006
20-0.172654-1.33740.093075
21-0.106798-0.82730.205686
220.0394870.30590.380384
230.2176831.68620.048479
240.2988312.31470.012033
250.1543561.19560.118272
26-0.056882-0.44060.330541
27-0.192343-1.48990.070746
28-0.225623-1.74770.042819
29-0.200073-1.54980.063229
30-0.196311-1.52060.066804
31-0.20177-1.56290.061668
32-0.212993-1.64980.052101
33-0.184252-1.42720.079351
34-0.102162-0.79130.215931
350.0058010.04490.482155
360.0595910.46160.323022
37-0.030486-0.23610.407062
38-0.156965-1.21580.114403
39-0.216137-1.67420.049649
40-0.207625-1.60830.056515
41-0.168871-1.30810.09792
42-0.163621-1.26740.104954
43-0.165667-1.28330.102169
44-0.177349-1.37370.087317
45-0.16797-1.30110.099102
46-0.127151-0.98490.164313
47-0.070111-0.54310.294544
48-0.037161-0.28780.387227
49-0.069981-0.54210.294888
50-0.11133-0.86240.195963
51-0.110997-0.85980.196666
52-0.073267-0.56750.286237
53-0.023325-0.18070.428617
54-0.005685-0.0440.482512
550.0019470.01510.494009
56-0.006609-0.05120.479672
57-0.017113-0.13260.447494
58-0.018636-0.14440.442851
59-0.012116-0.09380.462771
60NANANA


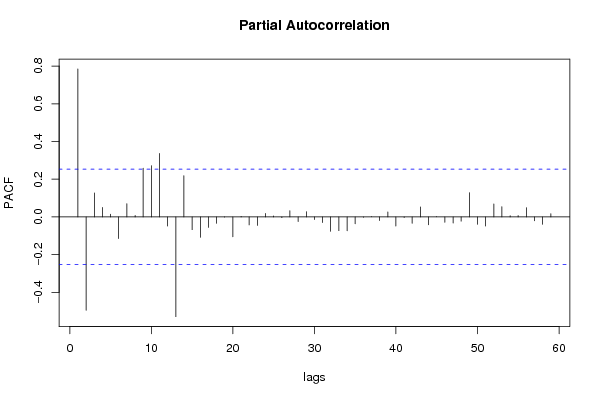
Partial Autocorrelation Function
Time lag kPACF(k)T-STATP-value
10.7846346.07780
2-0.495231-3.8360.000151
30.1272510.98570.164124
40.0496240.38440.351025
50.0138330.10710.457515
6-0.11492-0.89020.188466
70.0703210.54470.293988
80.0079910.06190.475425
90.2579091.99780.025142
100.2710522.09960.019991
110.3360912.60330.005808
12-0.048632-0.37670.353862
13-0.529011-4.09776.4e-05
140.2185631.6930.047823
15-0.067799-0.52520.300701
16-0.108024-0.83680.203026
17-0.055576-0.43050.33419
18-0.03339-0.25860.3984
19-0.001227-0.00950.496225
20-0.105397-0.81640.208751
210.0018070.0140.49444
22-0.042448-0.32880.371725
23-0.045179-0.350.363799
240.0179060.13870.445077
250.0050160.03890.484569
26-0.004083-0.03160.487437
270.0332340.25740.398863
28-0.02454-0.19010.42494
290.0278840.2160.414864
30-0.014117-0.10930.456646
31-0.030152-0.23360.408062
32-0.075813-0.58720.279621
33-0.072992-0.56540.286958
34-0.073868-0.57220.28467
35-0.036064-0.27940.390468
36-0.002324-0.0180.492849
37-0.000265-0.00210.499184
38-0.019187-0.14860.441175
390.0262970.20370.419639
40-0.047952-0.37140.355812
41-0.003761-0.02910.488426
42-0.034301-0.26570.395693
430.0524290.40610.343051
44-0.041706-0.32310.37389
45-0.000209-0.00160.499356
46-0.028829-0.22330.412028
47-0.032722-0.25350.400389
48-0.022477-0.17410.431185
490.1277980.98990.163094
50-0.039343-0.30480.380805
51-0.048851-0.37840.353236
520.0682650.52880.299456
530.0538530.41710.339032
540.0063130.04890.480581
550.0069250.05360.478701
560.0490330.37980.352714
57-0.020519-0.15890.437124
58-0.038661-0.29950.38281
590.0166920.12930.448778
60NANANA

\begin{tabular}{lllllllll}
\hline
Partial Autocorrelation Function \tabularnewline
Time lag k & PACF(k) & T-STAT & P-value \tabularnewline
1 & 0.784634 & 6.0778 & 0 \tabularnewline
2 & -0.495231 & -3.836 & 0.000151 \tabularnewline
3 & 0.127251 & 0.9857 & 0.164124 \tabularnewline
4 & 0.049624 & 0.3844 & 0.351025 \tabularnewline
5 & 0.013833 & 0.1071 & 0.457515 \tabularnewline
6 & -0.11492 & -0.8902 & 0.188466 \tabularnewline
7 & 0.070321 & 0.5447 & 0.293988 \tabularnewline
8 & 0.007991 & 0.0619 & 0.475425 \tabularnewline
9 & 0.257909 & 1.9978 & 0.025142 \tabularnewline
10 & 0.271052 & 2.0996 & 0.019991 \tabularnewline
11 & 0.336091 & 2.6033 & 0.005808 \tabularnewline
12 & -0.048632 & -0.3767 & 0.353862 \tabularnewline
13 & -0.529011 & -4.0977 & 6.4e-05 \tabularnewline
14 & 0.218563 & 1.693 & 0.047823 \tabularnewline
15 & -0.067799 & -0.5252 & 0.300701 \tabularnewline
16 & -0.108024 & -0.8368 & 0.203026 \tabularnewline
17 & -0.055576 & -0.4305 & 0.33419 \tabularnewline
18 & -0.03339 & -0.2586 & 0.3984 \tabularnewline
19 & -0.001227 & -0.0095 & 0.496225 \tabularnewline
20 & -0.105397 & -0.8164 & 0.208751 \tabularnewline
21 & 0.001807 & 0.014 & 0.49444 \tabularnewline
22 & -0.042448 & -0.3288 & 0.371725 \tabularnewline
23 & -0.045179 & -0.35 & 0.363799 \tabularnewline
24 & 0.017906 & 0.1387 & 0.445077 \tabularnewline
25 & 0.005016 & 0.0389 & 0.484569 \tabularnewline
26 & -0.004083 & -0.0316 & 0.487437 \tabularnewline
27 & 0.033234 & 0.2574 & 0.398863 \tabularnewline
28 & -0.02454 & -0.1901 & 0.42494 \tabularnewline
29 & 0.027884 & 0.216 & 0.414864 \tabularnewline
30 & -0.014117 & -0.1093 & 0.456646 \tabularnewline
31 & -0.030152 & -0.2336 & 0.408062 \tabularnewline
32 & -0.075813 & -0.5872 & 0.279621 \tabularnewline
33 & -0.072992 & -0.5654 & 0.286958 \tabularnewline
34 & -0.073868 & -0.5722 & 0.28467 \tabularnewline
35 & -0.036064 & -0.2794 & 0.390468 \tabularnewline
36 & -0.002324 & -0.018 & 0.492849 \tabularnewline
37 & -0.000265 & -0.0021 & 0.499184 \tabularnewline
38 & -0.019187 & -0.1486 & 0.441175 \tabularnewline
39 & 0.026297 & 0.2037 & 0.419639 \tabularnewline
40 & -0.047952 & -0.3714 & 0.355812 \tabularnewline
41 & -0.003761 & -0.0291 & 0.488426 \tabularnewline
42 & -0.034301 & -0.2657 & 0.395693 \tabularnewline
43 & 0.052429 & 0.4061 & 0.343051 \tabularnewline
44 & -0.041706 & -0.3231 & 0.37389 \tabularnewline
45 & -0.000209 & -0.0016 & 0.499356 \tabularnewline
46 & -0.028829 & -0.2233 & 0.412028 \tabularnewline
47 & -0.032722 & -0.2535 & 0.400389 \tabularnewline
48 & -0.022477 & -0.1741 & 0.431185 \tabularnewline
49 & 0.127798 & 0.9899 & 0.163094 \tabularnewline
50 & -0.039343 & -0.3048 & 0.380805 \tabularnewline
51 & -0.048851 & -0.3784 & 0.353236 \tabularnewline
52 & 0.068265 & 0.5288 & 0.299456 \tabularnewline
53 & 0.053853 & 0.4171 & 0.339032 \tabularnewline
54 & 0.006313 & 0.0489 & 0.480581 \tabularnewline
55 & 0.006925 & 0.0536 & 0.478701 \tabularnewline
56 & 0.049033 & 0.3798 & 0.352714 \tabularnewline
57 & -0.020519 & -0.1589 & 0.437124 \tabularnewline
58 & -0.038661 & -0.2995 & 0.38281 \tabularnewline
59 & 0.016692 & 0.1293 & 0.448778 \tabularnewline
60 & NA & NA & NA \tabularnewline
\hline
\end{tabular}
%Source: https://freestatistics.org/blog/index.php?pk=36402&T=2

[TABLE]
[ROW][C]Partial Autocorrelation Function[/C][/ROW]
[ROW][C]Time lag k[/C][C]PACF(k)[/C][C]T-STAT[/C][C]P-value[/C][/ROW]
[ROW][C]1[/C][C]0.784634[/C][C]6.0778[/C][C]0[/C][/ROW]
[ROW][C]2[/C][C]-0.495231[/C][C]-3.836[/C][C]0.000151[/C][/ROW]
[ROW][C]3[/C][C]0.127251[/C][C]0.9857[/C][C]0.164124[/C][/ROW]
[ROW][C]4[/C][C]0.049624[/C][C]0.3844[/C][C]0.351025[/C][/ROW]
[ROW][C]5[/C][C]0.013833[/C][C]0.1071[/C][C]0.457515[/C][/ROW]
[ROW][C]6[/C][C]-0.11492[/C][C]-0.8902[/C][C]0.188466[/C][/ROW]
[ROW][C]7[/C][C]0.070321[/C][C]0.5447[/C][C]0.293988[/C][/ROW]
[ROW][C]8[/C][C]0.007991[/C][C]0.0619[/C][C]0.475425[/C][/ROW]
[ROW][C]9[/C][C]0.257909[/C][C]1.9978[/C][C]0.025142[/C][/ROW]
[ROW][C]10[/C][C]0.271052[/C][C]2.0996[/C][C]0.019991[/C][/ROW]
[ROW][C]11[/C][C]0.336091[/C][C]2.6033[/C][C]0.005808[/C][/ROW]
[ROW][C]12[/C][C]-0.048632[/C][C]-0.3767[/C][C]0.353862[/C][/ROW]
[ROW][C]13[/C][C]-0.529011[/C][C]-4.0977[/C][C]6.4e-05[/C][/ROW]
[ROW][C]14[/C][C]0.218563[/C][C]1.693[/C][C]0.047823[/C][/ROW]
[ROW][C]15[/C][C]-0.067799[/C][C]-0.5252[/C][C]0.300701[/C][/ROW]
[ROW][C]16[/C][C]-0.108024[/C][C]-0.8368[/C][C]0.203026[/C][/ROW]
[ROW][C]17[/C][C]-0.055576[/C][C]-0.4305[/C][C]0.33419[/C][/ROW]
[ROW][C]18[/C][C]-0.03339[/C][C]-0.2586[/C][C]0.3984[/C][/ROW]
[ROW][C]19[/C][C]-0.001227[/C][C]-0.0095[/C][C]0.496225[/C][/ROW]
[ROW][C]20[/C][C]-0.105397[/C][C]-0.8164[/C][C]0.208751[/C][/ROW]
[ROW][C]21[/C][C]0.001807[/C][C]0.014[/C][C]0.49444[/C][/ROW]
[ROW][C]22[/C][C]-0.042448[/C][C]-0.3288[/C][C]0.371725[/C][/ROW]
[ROW][C]23[/C][C]-0.045179[/C][C]-0.35[/C][C]0.363799[/C][/ROW]
[ROW][C]24[/C][C]0.017906[/C][C]0.1387[/C][C]0.445077[/C][/ROW]
[ROW][C]25[/C][C]0.005016[/C][C]0.0389[/C][C]0.484569[/C][/ROW]
[ROW][C]26[/C][C]-0.004083[/C][C]-0.0316[/C][C]0.487437[/C][/ROW]
[ROW][C]27[/C][C]0.033234[/C][C]0.2574[/C][C]0.398863[/C][/ROW]
[ROW][C]28[/C][C]-0.02454[/C][C]-0.1901[/C][C]0.42494[/C][/ROW]
[ROW][C]29[/C][C]0.027884[/C][C]0.216[/C][C]0.414864[/C][/ROW]
[ROW][C]30[/C][C]-0.014117[/C][C]-0.1093[/C][C]0.456646[/C][/ROW]
[ROW][C]31[/C][C]-0.030152[/C][C]-0.2336[/C][C]0.408062[/C][/ROW]
[ROW][C]32[/C][C]-0.075813[/C][C]-0.5872[/C][C]0.279621[/C][/ROW]
[ROW][C]33[/C][C]-0.072992[/C][C]-0.5654[/C][C]0.286958[/C][/ROW]
[ROW][C]34[/C][C]-0.073868[/C][C]-0.5722[/C][C]0.28467[/C][/ROW]
[ROW][C]35[/C][C]-0.036064[/C][C]-0.2794[/C][C]0.390468[/C][/ROW]
[ROW][C]36[/C][C]-0.002324[/C][C]-0.018[/C][C]0.492849[/C][/ROW]
[ROW][C]37[/C][C]-0.000265[/C][C]-0.0021[/C][C]0.499184[/C][/ROW]
[ROW][C]38[/C][C]-0.019187[/C][C]-0.1486[/C][C]0.441175[/C][/ROW]
[ROW][C]39[/C][C]0.026297[/C][C]0.2037[/C][C]0.419639[/C][/ROW]
[ROW][C]40[/C][C]-0.047952[/C][C]-0.3714[/C][C]0.355812[/C][/ROW]
[ROW][C]41[/C][C]-0.003761[/C][C]-0.0291[/C][C]0.488426[/C][/ROW]
[ROW][C]42[/C][C]-0.034301[/C][C]-0.2657[/C][C]0.395693[/C][/ROW]
[ROW][C]43[/C][C]0.052429[/C][C]0.4061[/C][C]0.343051[/C][/ROW]
[ROW][C]44[/C][C]-0.041706[/C][C]-0.3231[/C][C]0.37389[/C][/ROW]
[ROW][C]45[/C][C]-0.000209[/C][C]-0.0016[/C][C]0.499356[/C][/ROW]
[ROW][C]46[/C][C]-0.028829[/C][C]-0.2233[/C][C]0.412028[/C][/ROW]
[ROW][C]47[/C][C]-0.032722[/C][C]-0.2535[/C][C]0.400389[/C][/ROW]
[ROW][C]48[/C][C]-0.022477[/C][C]-0.1741[/C][C]0.431185[/C][/ROW]
[ROW][C]49[/C][C]0.127798[/C][C]0.9899[/C][C]0.163094[/C][/ROW]
[ROW][C]50[/C][C]-0.039343[/C][C]-0.3048[/C][C]0.380805[/C][/ROW]
[ROW][C]51[/C][C]-0.048851[/C][C]-0.3784[/C][C]0.353236[/C][/ROW]
[ROW][C]52[/C][C]0.068265[/C][C]0.5288[/C][C]0.299456[/C][/ROW]
[ROW][C]53[/C][C]0.053853[/C][C]0.4171[/C][C]0.339032[/C][/ROW]
[ROW][C]54[/C][C]0.006313[/C][C]0.0489[/C][C]0.480581[/C][/ROW]
[ROW][C]55[/C][C]0.006925[/C][C]0.0536[/C][C]0.478701[/C][/ROW]
[ROW][C]56[/C][C]0.049033[/C][C]0.3798[/C][C]0.352714[/C][/ROW]
[ROW][C]57[/C][C]-0.020519[/C][C]-0.1589[/C][C]0.437124[/C][/ROW]
[ROW][C]58[/C][C]-0.038661[/C][C]-0.2995[/C][C]0.38281[/C][/ROW]
[ROW][C]59[/C][C]0.016692[/C][C]0.1293[/C][C]0.448778[/C][/ROW]
[ROW][C]60[/C][C]NA[/C][C]NA[/C][C]NA[/C][/ROW]
[/TABLE]
Source: https://freestatistics.org/blog/index.php?pk=36402&T=2

Globally Unique Identifier (entire table): ba.freestatistics.org/blog/index.php?pk=36402&T=2

As an alternative you can also use a QR Code:  

The GUIDs for individual cells are displayed in the table below:

Partial Autocorrelation Function
Time lag kPACF(k)T-STATP-value
10.7846346.07780
2-0.495231-3.8360.000151
30.1272510.98570.164124
40.0496240.38440.351025
50.0138330.10710.457515
6-0.11492-0.89020.188466
70.0703210.54470.293988
80.0079910.06190.475425
90.2579091.99780.025142
100.2710522.09960.019991
110.3360912.60330.005808
12-0.048632-0.37670.353862
13-0.529011-4.09776.4e-05
140.2185631.6930.047823
15-0.067799-0.52520.300701
16-0.108024-0.83680.203026
17-0.055576-0.43050.33419
18-0.03339-0.25860.3984
19-0.001227-0.00950.496225
20-0.105397-0.81640.208751
210.0018070.0140.49444
22-0.042448-0.32880.371725
23-0.045179-0.350.363799
240.0179060.13870.445077
250.0050160.03890.484569
26-0.004083-0.03160.487437
270.0332340.25740.398863
28-0.02454-0.19010.42494
290.0278840.2160.414864
30-0.014117-0.10930.456646
31-0.030152-0.23360.408062
32-0.075813-0.58720.279621
33-0.072992-0.56540.286958
34-0.073868-0.57220.28467
35-0.036064-0.27940.390468
36-0.002324-0.0180.492849
37-0.000265-0.00210.499184
38-0.019187-0.14860.441175
390.0262970.20370.419639
40-0.047952-0.37140.355812
41-0.003761-0.02910.488426
42-0.034301-0.26570.395693
430.0524290.40610.343051
44-0.041706-0.32310.37389
45-0.000209-0.00160.499356
46-0.028829-0.22330.412028
47-0.032722-0.25350.400389
48-0.022477-0.17410.431185
490.1277980.98990.163094
50-0.039343-0.30480.380805
51-0.048851-0.37840.353236
520.0682650.52880.299456
530.0538530.41710.339032
540.0063130.04890.480581
550.0069250.05360.478701
560.0490330.37980.352714
57-0.020519-0.15890.437124
58-0.038661-0.29950.38281
590.0166920.12930.448778
60NANANA


Parameters (Session):
par1 = 60 ; par2 = 1 ; par3 = 0 ; par4 = 0 ; par5 = 12 ;
Parameters (R input):
par1 = 60 ; par2 = 1 ; par3 = 0 ; par4 = 0 ; par5 = 12 ;
R code (references can be found in the software module):
if (par1 == 'Default') {
par1 = 10*log10(length(x))
} else {
par1 <- as.numeric(par1)
}
par2 <- as.numeric(par2)
par3 <- as.numeric(par3)
par4 <- as.numeric(par4)
par5 <- as.numeric(par5)
if (par2 == 0) {
x <- log(x)
} else {
x <- (x ^ par2 - 1) / par2
}
if (par3 > 0) x <- diff(x,lag=1,difference=par3)
if (par4 > 0) x <- diff(x,lag=par5,difference=par4)
bitmap(file='pic1.png')
racf <- acf(x,par1,main='Autocorrelation',xlab='lags',ylab='ACF')
dev.off()
bitmap(file='pic2.png')
rpacf <- pacf(x,par1,main='Partial Autocorrelation',xlab='lags',ylab='PACF')
dev.off()
(myacf <- c(racf$acf))
(mypacf <- c(rpacf$acf))
lengthx <- length(x)
sqrtn <- sqrt(lengthx)
load(file='createtable')
a<-table.start()
a<-table.row.start(a)
a<-table.element(a,'Autocorrelation Function',4,TRUE)
a<-table.row.end(a)
a<-table.row.start(a)
a<-table.element(a,'Time lag k',header=TRUE)
a<-table.element(a,hyperlink('basics.htm','ACF(k)','click here for more information about the Autocorrelation Function'),header=TRUE)
a<-table.element(a,'T-STAT',header=TRUE)
a<-table.element(a,'P-value',header=TRUE)
a<-table.row.end(a)
for (i in 2:(par1+1)) {
a<-table.row.start(a)
a<-table.element(a,i-1,header=TRUE)
a<-table.element(a,round(myacf[i],6))
mytstat <- myacf[i]*sqrtn
a<-table.element(a,round(mytstat,4))
a<-table.element(a,round(1-pt(abs(mytstat),lengthx),6))
a<-table.row.end(a)
}
a<-table.end(a)
table.save(a,file='mytable.tab')
a<-table.start()
a<-table.row.start(a)
a<-table.element(a,'Partial Autocorrelation Function',4,TRUE)
a<-table.row.end(a)
a<-table.row.start(a)
a<-table.element(a,'Time lag k',header=TRUE)
a<-table.element(a,hyperlink('basics.htm','PACF(k)','click here for more information about the Partial Autocorrelation Function'),header=TRUE)
a<-table.element(a,'T-STAT',header=TRUE)
a<-table.element(a,'P-value',header=TRUE)
a<-table.row.end(a)
for (i in 1:par1) {
a<-table.row.start(a)
a<-table.element(a,i,header=TRUE)
a<-table.element(a,round(mypacf[i],6))
mytstat <- mypacf[i]*sqrtn
a<-table.element(a,round(mytstat,4))
a<-table.element(a,round(1-pt(abs(mytstat),lengthx),6))
a<-table.row.end(a)
}
a<-table.end(a)
table.save(a,file='mytable1.tab')