Free Statistics

of Irreproducible Research!

Author's title

Author*Unverified author*
R Software Modulerwasp_autocorrelation.wasp
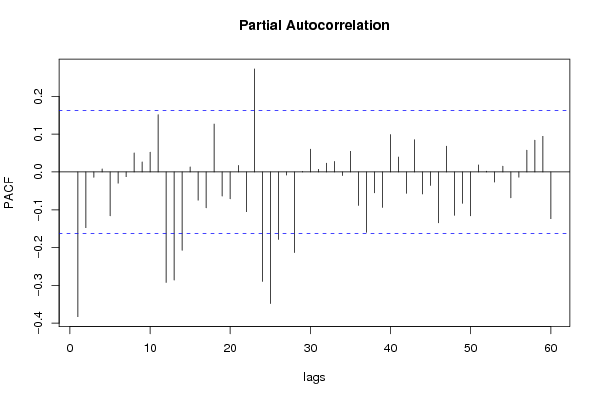
Title produced by software(Partial) Autocorrelation Function
Date of computationTue, 23 Dec 2008 05:15:50 -0700
Cite this page as followsStatistical Computations at FreeStatistics.org, Office for Research Development and Education, URL https://freestatistics.org/blog/index.php?v=date/2008/Dec/23/t1230034617dnlv6l1mgq3racy.htm/, Retrieved Sun, 19 May 2024 08:49:15 +0000
Statistical Computations at FreeStatistics.org, Office for Research Development and Education, URL https://freestatistics.org/blog/index.php?pk=36277, Retrieved Sun, 19 May 2024 08:49:15 +0000
QR Codes:

Original text written by user:
IsPrivate?No (this computation is public)
User-defined keywords
Estimated Impact171
Family? (F = Feedback message, R = changed R code, M = changed R Module, P = changed Parameters, D = changed Data)
-     [(Partial) Autocorrelation Function] [ACF Azië] [2008-12-22 09:49:30] [bd6e9fd01b4fddda83ee6fb85abada8c]
-   PD    [(Partial) Autocorrelation Function] [ACF paper] [2008-12-23 12:15:50] [d41d8cd98f00b204e9800998ecf8427e] [Current]
- RMPD      [Multiple Regression] [UitvoerAfrika] [2008-12-23 12:50:25] [4238876274b434b9c82080bce2179078]
Feedback Forum

Post a new message
Dataseries X:
1025.5
691.2
971.6
926
997.1
964.9
860
948
951.4
827.3
994
944.5
976.2
668.8
939.9
1096.1
977.7
1096.9
1060.8
1121.4
1190.9
1177.9
1108.1
1045.6
1263.9
911
1175.9
1091.3
1027.7
1081.7
879.7
955.5
1037.9
959.9
931.8
1062.2
1077.2
668.4
954.3
797.2
829.2
957.3
844.2
893.6
1132
898.8
1064
1279.7
1382.5
824.1
1304.1
1253.5
1136.3
1414.7
1293.2
1325.7
1463.8
1244.2
1573.6
1327.3
1418.5
1042.2
1384.8
1474.8
1556.5
1466.2
1221.7
1279.7
1348.4
1189.8
1296.6
1417.6
1513.9
1006.1
1202.8
1258.8
1211.5
1283.3
1332.3
1374.3
1406.1
1419.1
1554.4
1499.8
1609.6
1033.9
1550.5
1491.4
1368.9
1537.1
1492.3
1504.1
1301.2
1344.2
1319.1
1420.3
1582.9
1002.6
1559.1
1462.7
1414.8
1537.5
1455.9
1619.9
1667.2
1488.9
1442.5
1779.6
1801.9
1233.4
1581.1
1515
1439.2
1585.8
1488.8
1601.3
1646.8
1630.2
1720.7
2013.5
2051.2
1404.7
2015.9
1544.1
1816.6
1773.4
1577.4
1709.8
1810.2
1520.5
1798.6
1666.8
1730.4
1147.8
1777
1700
1907.4
1745.8
1771.6
1790.2
1958.7
1560.4
1752.1
2011.6
2082.8
1616.4
1846.1
1824.9
1711.3
1805
1737.6
1939.6
1711.4
1964.8
1864.4
1980.7
2226.7
1433.3
1960.7


Summary of computational transaction
Raw Inputview raw input (R code)
Raw Outputview raw output of R engine
Computing time3 seconds
R Server'Herman Ole Andreas Wold' @ 193.190.124.10:1001

\begin{tabular}{lllllllll}
\hline
Summary of computational transaction \tabularnewline
Raw Input & view raw input (R code)  \tabularnewline
Raw Output & view raw output of R engine  \tabularnewline
Computing time & 3 seconds \tabularnewline
R Server & 'Herman Ole Andreas Wold' @ 193.190.124.10:1001 \tabularnewline
\hline
\end{tabular}
%Source: https://freestatistics.org/blog/index.php?pk=36277&T=0

[TABLE]
[ROW][C]Summary of computational transaction[/C][/ROW]
[ROW][C]Raw Input[/C][C]view raw input (R code) [/C][/ROW]
[ROW][C]Raw Output[/C][C]view raw output of R engine [/C][/ROW]
[ROW][C]Computing time[/C][C]3 seconds[/C][/ROW]
[ROW][C]R Server[/C][C]'Herman Ole Andreas Wold' @ 193.190.124.10:1001[/C][/ROW]
[/TABLE]
Source: https://freestatistics.org/blog/index.php?pk=36277&T=0

Globally Unique Identifier (entire table): ba.freestatistics.org/blog/index.php?pk=36277&T=0

As an alternative you can also use a QR Code:  

The GUIDs for individual cells are displayed in the table below:

Summary of computational transaction
Raw Inputview raw input (R code)
Raw Outputview raw output of R engine
Computing time3 seconds
R Server'Herman Ole Andreas Wold' @ 193.190.124.10:1001


Autocorrelation Function
Time lag kACF(k)T-STATP-value
1-0.382769-4.6254e-06
20.0206980.25010.401431
30.0355840.430.333926
4-0.006938-0.08380.466651
5-0.102588-1.23960.108561
60.0641620.77530.219717
7-0.015523-0.18760.425741
80.0408590.49370.311128
9-0.009771-0.11810.453092
100.0434070.52450.300366
110.083791.01240.156501
12-0.334311-4.03954.3e-05
130.0195360.23610.406861
14-0.009756-0.11790.45316
150.056040.67710.249695
16-0.100475-1.2140.113345
170.0757870.91570.180658
180.1054911.27460.102229
19-0.152762-1.84580.033471
200.0131630.1590.436927
210.0579540.70030.242439
22-0.169518-2.04830.021162
230.2274692.74850.003371
24-0.211244-2.55250.005862
250.0498640.60250.273885
260.0752420.90920.182384
27-0.016135-0.1950.422848
28-0.105692-1.27710.1018
290.2057142.48570.00703
30-0.197024-2.38070.009286
310.0953811.15250.125501
320.0639170.77230.220589
33-0.01909-0.23070.40895
34-0.031627-0.38210.351453
35-0.02948-0.35620.361098
360.1426631.72380.04343
37-0.023919-0.2890.386489
380.0449460.54310.293952
39-0.082258-0.99390.16095
400.2058622.48740.006996
41-0.160219-1.93590.027404
42-0.06254-0.75570.225532
430.1026921.24080.10833
44-0.066483-0.80330.211549
45-0.105336-1.27280.102559
460.1250521.5110.066474
470.0399510.48270.315007
48-0.175475-2.12030.017837
490.1221531.4760.071051
50-0.071289-0.86140.19522
51-0.037085-0.44810.327371
52-0.059979-0.72470.23489
530.0170650.20620.418461
540.0909551.0990.136785
55-0.066893-0.80830.210125
560.0467620.5650.286459
570.0505280.61050.271229
580.0728870.88070.189964
59-0.1526-1.84390.033614
600.0248210.29990.382337

\begin{tabular}{lllllllll}
\hline
Autocorrelation Function \tabularnewline
Time lag k & ACF(k) & T-STAT & P-value \tabularnewline
1 & -0.382769 & -4.625 & 4e-06 \tabularnewline
2 & 0.020698 & 0.2501 & 0.401431 \tabularnewline
3 & 0.035584 & 0.43 & 0.333926 \tabularnewline
4 & -0.006938 & -0.0838 & 0.466651 \tabularnewline
5 & -0.102588 & -1.2396 & 0.108561 \tabularnewline
6 & 0.064162 & 0.7753 & 0.219717 \tabularnewline
7 & -0.015523 & -0.1876 & 0.425741 \tabularnewline
8 & 0.040859 & 0.4937 & 0.311128 \tabularnewline
9 & -0.009771 & -0.1181 & 0.453092 \tabularnewline
10 & 0.043407 & 0.5245 & 0.300366 \tabularnewline
11 & 0.08379 & 1.0124 & 0.156501 \tabularnewline
12 & -0.334311 & -4.0395 & 4.3e-05 \tabularnewline
13 & 0.019536 & 0.2361 & 0.406861 \tabularnewline
14 & -0.009756 & -0.1179 & 0.45316 \tabularnewline
15 & 0.05604 & 0.6771 & 0.249695 \tabularnewline
16 & -0.100475 & -1.214 & 0.113345 \tabularnewline
17 & 0.075787 & 0.9157 & 0.180658 \tabularnewline
18 & 0.105491 & 1.2746 & 0.102229 \tabularnewline
19 & -0.152762 & -1.8458 & 0.033471 \tabularnewline
20 & 0.013163 & 0.159 & 0.436927 \tabularnewline
21 & 0.057954 & 0.7003 & 0.242439 \tabularnewline
22 & -0.169518 & -2.0483 & 0.021162 \tabularnewline
23 & 0.227469 & 2.7485 & 0.003371 \tabularnewline
24 & -0.211244 & -2.5525 & 0.005862 \tabularnewline
25 & 0.049864 & 0.6025 & 0.273885 \tabularnewline
26 & 0.075242 & 0.9092 & 0.182384 \tabularnewline
27 & -0.016135 & -0.195 & 0.422848 \tabularnewline
28 & -0.105692 & -1.2771 & 0.1018 \tabularnewline
29 & 0.205714 & 2.4857 & 0.00703 \tabularnewline
30 & -0.197024 & -2.3807 & 0.009286 \tabularnewline
31 & 0.095381 & 1.1525 & 0.125501 \tabularnewline
32 & 0.063917 & 0.7723 & 0.220589 \tabularnewline
33 & -0.01909 & -0.2307 & 0.40895 \tabularnewline
34 & -0.031627 & -0.3821 & 0.351453 \tabularnewline
35 & -0.02948 & -0.3562 & 0.361098 \tabularnewline
36 & 0.142663 & 1.7238 & 0.04343 \tabularnewline
37 & -0.023919 & -0.289 & 0.386489 \tabularnewline
38 & 0.044946 & 0.5431 & 0.293952 \tabularnewline
39 & -0.082258 & -0.9939 & 0.16095 \tabularnewline
40 & 0.205862 & 2.4874 & 0.006996 \tabularnewline
41 & -0.160219 & -1.9359 & 0.027404 \tabularnewline
42 & -0.06254 & -0.7557 & 0.225532 \tabularnewline
43 & 0.102692 & 1.2408 & 0.10833 \tabularnewline
44 & -0.066483 & -0.8033 & 0.211549 \tabularnewline
45 & -0.105336 & -1.2728 & 0.102559 \tabularnewline
46 & 0.125052 & 1.511 & 0.066474 \tabularnewline
47 & 0.039951 & 0.4827 & 0.315007 \tabularnewline
48 & -0.175475 & -2.1203 & 0.017837 \tabularnewline
49 & 0.122153 & 1.476 & 0.071051 \tabularnewline
50 & -0.071289 & -0.8614 & 0.19522 \tabularnewline
51 & -0.037085 & -0.4481 & 0.327371 \tabularnewline
52 & -0.059979 & -0.7247 & 0.23489 \tabularnewline
53 & 0.017065 & 0.2062 & 0.418461 \tabularnewline
54 & 0.090955 & 1.099 & 0.136785 \tabularnewline
55 & -0.066893 & -0.8083 & 0.210125 \tabularnewline
56 & 0.046762 & 0.565 & 0.286459 \tabularnewline
57 & 0.050528 & 0.6105 & 0.271229 \tabularnewline
58 & 0.072887 & 0.8807 & 0.189964 \tabularnewline
59 & -0.1526 & -1.8439 & 0.033614 \tabularnewline
60 & 0.024821 & 0.2999 & 0.382337 \tabularnewline
\hline
\end{tabular}
%Source: https://freestatistics.org/blog/index.php?pk=36277&T=1

[TABLE]
[ROW][C]Autocorrelation Function[/C][/ROW]
[ROW][C]Time lag k[/C][C]ACF(k)[/C][C]T-STAT[/C][C]P-value[/C][/ROW]
[ROW][C]1[/C][C]-0.382769[/C][C]-4.625[/C][C]4e-06[/C][/ROW]
[ROW][C]2[/C][C]0.020698[/C][C]0.2501[/C][C]0.401431[/C][/ROW]
[ROW][C]3[/C][C]0.035584[/C][C]0.43[/C][C]0.333926[/C][/ROW]
[ROW][C]4[/C][C]-0.006938[/C][C]-0.0838[/C][C]0.466651[/C][/ROW]
[ROW][C]5[/C][C]-0.102588[/C][C]-1.2396[/C][C]0.108561[/C][/ROW]
[ROW][C]6[/C][C]0.064162[/C][C]0.7753[/C][C]0.219717[/C][/ROW]
[ROW][C]7[/C][C]-0.015523[/C][C]-0.1876[/C][C]0.425741[/C][/ROW]
[ROW][C]8[/C][C]0.040859[/C][C]0.4937[/C][C]0.311128[/C][/ROW]
[ROW][C]9[/C][C]-0.009771[/C][C]-0.1181[/C][C]0.453092[/C][/ROW]
[ROW][C]10[/C][C]0.043407[/C][C]0.5245[/C][C]0.300366[/C][/ROW]
[ROW][C]11[/C][C]0.08379[/C][C]1.0124[/C][C]0.156501[/C][/ROW]
[ROW][C]12[/C][C]-0.334311[/C][C]-4.0395[/C][C]4.3e-05[/C][/ROW]
[ROW][C]13[/C][C]0.019536[/C][C]0.2361[/C][C]0.406861[/C][/ROW]
[ROW][C]14[/C][C]-0.009756[/C][C]-0.1179[/C][C]0.45316[/C][/ROW]
[ROW][C]15[/C][C]0.05604[/C][C]0.6771[/C][C]0.249695[/C][/ROW]
[ROW][C]16[/C][C]-0.100475[/C][C]-1.214[/C][C]0.113345[/C][/ROW]
[ROW][C]17[/C][C]0.075787[/C][C]0.9157[/C][C]0.180658[/C][/ROW]
[ROW][C]18[/C][C]0.105491[/C][C]1.2746[/C][C]0.102229[/C][/ROW]
[ROW][C]19[/C][C]-0.152762[/C][C]-1.8458[/C][C]0.033471[/C][/ROW]
[ROW][C]20[/C][C]0.013163[/C][C]0.159[/C][C]0.436927[/C][/ROW]
[ROW][C]21[/C][C]0.057954[/C][C]0.7003[/C][C]0.242439[/C][/ROW]
[ROW][C]22[/C][C]-0.169518[/C][C]-2.0483[/C][C]0.021162[/C][/ROW]
[ROW][C]23[/C][C]0.227469[/C][C]2.7485[/C][C]0.003371[/C][/ROW]
[ROW][C]24[/C][C]-0.211244[/C][C]-2.5525[/C][C]0.005862[/C][/ROW]
[ROW][C]25[/C][C]0.049864[/C][C]0.6025[/C][C]0.273885[/C][/ROW]
[ROW][C]26[/C][C]0.075242[/C][C]0.9092[/C][C]0.182384[/C][/ROW]
[ROW][C]27[/C][C]-0.016135[/C][C]-0.195[/C][C]0.422848[/C][/ROW]
[ROW][C]28[/C][C]-0.105692[/C][C]-1.2771[/C][C]0.1018[/C][/ROW]
[ROW][C]29[/C][C]0.205714[/C][C]2.4857[/C][C]0.00703[/C][/ROW]
[ROW][C]30[/C][C]-0.197024[/C][C]-2.3807[/C][C]0.009286[/C][/ROW]
[ROW][C]31[/C][C]0.095381[/C][C]1.1525[/C][C]0.125501[/C][/ROW]
[ROW][C]32[/C][C]0.063917[/C][C]0.7723[/C][C]0.220589[/C][/ROW]
[ROW][C]33[/C][C]-0.01909[/C][C]-0.2307[/C][C]0.40895[/C][/ROW]
[ROW][C]34[/C][C]-0.031627[/C][C]-0.3821[/C][C]0.351453[/C][/ROW]
[ROW][C]35[/C][C]-0.02948[/C][C]-0.3562[/C][C]0.361098[/C][/ROW]
[ROW][C]36[/C][C]0.142663[/C][C]1.7238[/C][C]0.04343[/C][/ROW]
[ROW][C]37[/C][C]-0.023919[/C][C]-0.289[/C][C]0.386489[/C][/ROW]
[ROW][C]38[/C][C]0.044946[/C][C]0.5431[/C][C]0.293952[/C][/ROW]
[ROW][C]39[/C][C]-0.082258[/C][C]-0.9939[/C][C]0.16095[/C][/ROW]
[ROW][C]40[/C][C]0.205862[/C][C]2.4874[/C][C]0.006996[/C][/ROW]
[ROW][C]41[/C][C]-0.160219[/C][C]-1.9359[/C][C]0.027404[/C][/ROW]
[ROW][C]42[/C][C]-0.06254[/C][C]-0.7557[/C][C]0.225532[/C][/ROW]
[ROW][C]43[/C][C]0.102692[/C][C]1.2408[/C][C]0.10833[/C][/ROW]
[ROW][C]44[/C][C]-0.066483[/C][C]-0.8033[/C][C]0.211549[/C][/ROW]
[ROW][C]45[/C][C]-0.105336[/C][C]-1.2728[/C][C]0.102559[/C][/ROW]
[ROW][C]46[/C][C]0.125052[/C][C]1.511[/C][C]0.066474[/C][/ROW]
[ROW][C]47[/C][C]0.039951[/C][C]0.4827[/C][C]0.315007[/C][/ROW]
[ROW][C]48[/C][C]-0.175475[/C][C]-2.1203[/C][C]0.017837[/C][/ROW]
[ROW][C]49[/C][C]0.122153[/C][C]1.476[/C][C]0.071051[/C][/ROW]
[ROW][C]50[/C][C]-0.071289[/C][C]-0.8614[/C][C]0.19522[/C][/ROW]
[ROW][C]51[/C][C]-0.037085[/C][C]-0.4481[/C][C]0.327371[/C][/ROW]
[ROW][C]52[/C][C]-0.059979[/C][C]-0.7247[/C][C]0.23489[/C][/ROW]
[ROW][C]53[/C][C]0.017065[/C][C]0.2062[/C][C]0.418461[/C][/ROW]
[ROW][C]54[/C][C]0.090955[/C][C]1.099[/C][C]0.136785[/C][/ROW]
[ROW][C]55[/C][C]-0.066893[/C][C]-0.8083[/C][C]0.210125[/C][/ROW]
[ROW][C]56[/C][C]0.046762[/C][C]0.565[/C][C]0.286459[/C][/ROW]
[ROW][C]57[/C][C]0.050528[/C][C]0.6105[/C][C]0.271229[/C][/ROW]
[ROW][C]58[/C][C]0.072887[/C][C]0.8807[/C][C]0.189964[/C][/ROW]
[ROW][C]59[/C][C]-0.1526[/C][C]-1.8439[/C][C]0.033614[/C][/ROW]
[ROW][C]60[/C][C]0.024821[/C][C]0.2999[/C][C]0.382337[/C][/ROW]
[/TABLE]
Source: https://freestatistics.org/blog/index.php?pk=36277&T=1

Globally Unique Identifier (entire table): ba.freestatistics.org/blog/index.php?pk=36277&T=1

As an alternative you can also use a QR Code:  

The GUIDs for individual cells are displayed in the table below:

Autocorrelation Function
Time lag kACF(k)T-STATP-value
1-0.382769-4.6254e-06
20.0206980.25010.401431
30.0355840.430.333926
4-0.006938-0.08380.466651
5-0.102588-1.23960.108561
60.0641620.77530.219717
7-0.015523-0.18760.425741
80.0408590.49370.311128
9-0.009771-0.11810.453092
100.0434070.52450.300366
110.083791.01240.156501
12-0.334311-4.03954.3e-05
130.0195360.23610.406861
14-0.009756-0.11790.45316
150.056040.67710.249695
16-0.100475-1.2140.113345
170.0757870.91570.180658
180.1054911.27460.102229
19-0.152762-1.84580.033471
200.0131630.1590.436927
210.0579540.70030.242439
22-0.169518-2.04830.021162
230.2274692.74850.003371
24-0.211244-2.55250.005862
250.0498640.60250.273885
260.0752420.90920.182384
27-0.016135-0.1950.422848
28-0.105692-1.27710.1018
290.2057142.48570.00703
30-0.197024-2.38070.009286
310.0953811.15250.125501
320.0639170.77230.220589
33-0.01909-0.23070.40895
34-0.031627-0.38210.351453
35-0.02948-0.35620.361098
360.1426631.72380.04343
37-0.023919-0.2890.386489
380.0449460.54310.293952
39-0.082258-0.99390.16095
400.2058622.48740.006996
41-0.160219-1.93590.027404
42-0.06254-0.75570.225532
430.1026921.24080.10833
44-0.066483-0.80330.211549
45-0.105336-1.27280.102559
460.1250521.5110.066474
470.0399510.48270.315007
48-0.175475-2.12030.017837
490.1221531.4760.071051
50-0.071289-0.86140.19522
51-0.037085-0.44810.327371
52-0.059979-0.72470.23489
530.0170650.20620.418461
540.0909551.0990.136785
55-0.066893-0.80830.210125
560.0467620.5650.286459
570.0505280.61050.271229
580.0728870.88070.189964
59-0.1526-1.84390.033614
600.0248210.29990.382337


Partial Autocorrelation Function
Time lag kPACF(k)T-STATP-value
1-0.382769-4.6254e-06
2-0.147412-1.78120.038481
3-0.014072-0.170.432609
40.0078540.09490.46226
5-0.116206-1.40410.081203
6-0.029925-0.36160.359092
7-0.012417-0.150.440473
80.0501750.60630.272639
90.0265720.32110.374308
100.0521810.63050.264675
110.1513471.82870.03474
12-0.292277-3.53160.000277
13-0.286053-3.45640.000359
14-0.207298-2.50480.006675
150.0132620.16020.436457
16-0.074653-0.9020.184263
17-0.094885-1.14650.126733
180.1266791.53070.064008
19-0.063743-0.77020.221209
20-0.071075-0.85880.195927
210.0173440.20960.417146
22-0.105041-1.26920.103191
230.2724123.29160.000625
24-0.289469-3.49770.000311
25-0.348252-4.20792.2e-05
26-0.178599-2.1580.016281
27-0.008264-0.09990.4603
28-0.213177-2.57580.005497
290.0015090.01820.492739
300.0602280.72770.233971
310.0070270.08490.466226
320.0232970.28150.389364
330.0279210.33740.368159
34-0.009506-0.11490.454355
350.0546360.66020.255093
36-0.088753-1.07240.142654
37-0.159735-1.93010.027767
38-0.055313-0.66840.252483
39-0.093928-1.13490.129131
400.0987691.19340.117317
410.039490.47720.316981
42-0.056449-0.68210.248135
430.0854631.03270.151735
44-0.0581-0.7020.241891
45-0.035863-0.43330.332706
46-0.134441-1.62450.053218
470.0680930.82280.205992
48-0.11486-1.38790.083648
49-0.082839-1.0010.159253
50-0.116093-1.40280.081406
510.0185180.22370.411633
520.0020680.0250.490049
53-0.026683-0.32240.373803
540.0151120.18260.427684
55-0.068535-0.82810.204478
56-0.013779-0.16650.434
570.0576890.69710.243436
580.0840221.01520.155834
590.0943641.14020.128033
60-0.123686-1.49450.068601

\begin{tabular}{lllllllll}
\hline
Partial Autocorrelation Function \tabularnewline
Time lag k & PACF(k) & T-STAT & P-value \tabularnewline
1 & -0.382769 & -4.625 & 4e-06 \tabularnewline
2 & -0.147412 & -1.7812 & 0.038481 \tabularnewline
3 & -0.014072 & -0.17 & 0.432609 \tabularnewline
4 & 0.007854 & 0.0949 & 0.46226 \tabularnewline
5 & -0.116206 & -1.4041 & 0.081203 \tabularnewline
6 & -0.029925 & -0.3616 & 0.359092 \tabularnewline
7 & -0.012417 & -0.15 & 0.440473 \tabularnewline
8 & 0.050175 & 0.6063 & 0.272639 \tabularnewline
9 & 0.026572 & 0.3211 & 0.374308 \tabularnewline
10 & 0.052181 & 0.6305 & 0.264675 \tabularnewline
11 & 0.151347 & 1.8287 & 0.03474 \tabularnewline
12 & -0.292277 & -3.5316 & 0.000277 \tabularnewline
13 & -0.286053 & -3.4564 & 0.000359 \tabularnewline
14 & -0.207298 & -2.5048 & 0.006675 \tabularnewline
15 & 0.013262 & 0.1602 & 0.436457 \tabularnewline
16 & -0.074653 & -0.902 & 0.184263 \tabularnewline
17 & -0.094885 & -1.1465 & 0.126733 \tabularnewline
18 & 0.126679 & 1.5307 & 0.064008 \tabularnewline
19 & -0.063743 & -0.7702 & 0.221209 \tabularnewline
20 & -0.071075 & -0.8588 & 0.195927 \tabularnewline
21 & 0.017344 & 0.2096 & 0.417146 \tabularnewline
22 & -0.105041 & -1.2692 & 0.103191 \tabularnewline
23 & 0.272412 & 3.2916 & 0.000625 \tabularnewline
24 & -0.289469 & -3.4977 & 0.000311 \tabularnewline
25 & -0.348252 & -4.2079 & 2.2e-05 \tabularnewline
26 & -0.178599 & -2.158 & 0.016281 \tabularnewline
27 & -0.008264 & -0.0999 & 0.4603 \tabularnewline
28 & -0.213177 & -2.5758 & 0.005497 \tabularnewline
29 & 0.001509 & 0.0182 & 0.492739 \tabularnewline
30 & 0.060228 & 0.7277 & 0.233971 \tabularnewline
31 & 0.007027 & 0.0849 & 0.466226 \tabularnewline
32 & 0.023297 & 0.2815 & 0.389364 \tabularnewline
33 & 0.027921 & 0.3374 & 0.368159 \tabularnewline
34 & -0.009506 & -0.1149 & 0.454355 \tabularnewline
35 & 0.054636 & 0.6602 & 0.255093 \tabularnewline
36 & -0.088753 & -1.0724 & 0.142654 \tabularnewline
37 & -0.159735 & -1.9301 & 0.027767 \tabularnewline
38 & -0.055313 & -0.6684 & 0.252483 \tabularnewline
39 & -0.093928 & -1.1349 & 0.129131 \tabularnewline
40 & 0.098769 & 1.1934 & 0.117317 \tabularnewline
41 & 0.03949 & 0.4772 & 0.316981 \tabularnewline
42 & -0.056449 & -0.6821 & 0.248135 \tabularnewline
43 & 0.085463 & 1.0327 & 0.151735 \tabularnewline
44 & -0.0581 & -0.702 & 0.241891 \tabularnewline
45 & -0.035863 & -0.4333 & 0.332706 \tabularnewline
46 & -0.134441 & -1.6245 & 0.053218 \tabularnewline
47 & 0.068093 & 0.8228 & 0.205992 \tabularnewline
48 & -0.11486 & -1.3879 & 0.083648 \tabularnewline
49 & -0.082839 & -1.001 & 0.159253 \tabularnewline
50 & -0.116093 & -1.4028 & 0.081406 \tabularnewline
51 & 0.018518 & 0.2237 & 0.411633 \tabularnewline
52 & 0.002068 & 0.025 & 0.490049 \tabularnewline
53 & -0.026683 & -0.3224 & 0.373803 \tabularnewline
54 & 0.015112 & 0.1826 & 0.427684 \tabularnewline
55 & -0.068535 & -0.8281 & 0.204478 \tabularnewline
56 & -0.013779 & -0.1665 & 0.434 \tabularnewline
57 & 0.057689 & 0.6971 & 0.243436 \tabularnewline
58 & 0.084022 & 1.0152 & 0.155834 \tabularnewline
59 & 0.094364 & 1.1402 & 0.128033 \tabularnewline
60 & -0.123686 & -1.4945 & 0.068601 \tabularnewline
\hline
\end{tabular}
%Source: https://freestatistics.org/blog/index.php?pk=36277&T=2

[TABLE]
[ROW][C]Partial Autocorrelation Function[/C][/ROW]
[ROW][C]Time lag k[/C][C]PACF(k)[/C][C]T-STAT[/C][C]P-value[/C][/ROW]
[ROW][C]1[/C][C]-0.382769[/C][C]-4.625[/C][C]4e-06[/C][/ROW]
[ROW][C]2[/C][C]-0.147412[/C][C]-1.7812[/C][C]0.038481[/C][/ROW]
[ROW][C]3[/C][C]-0.014072[/C][C]-0.17[/C][C]0.432609[/C][/ROW]
[ROW][C]4[/C][C]0.007854[/C][C]0.0949[/C][C]0.46226[/C][/ROW]
[ROW][C]5[/C][C]-0.116206[/C][C]-1.4041[/C][C]0.081203[/C][/ROW]
[ROW][C]6[/C][C]-0.029925[/C][C]-0.3616[/C][C]0.359092[/C][/ROW]
[ROW][C]7[/C][C]-0.012417[/C][C]-0.15[/C][C]0.440473[/C][/ROW]
[ROW][C]8[/C][C]0.050175[/C][C]0.6063[/C][C]0.272639[/C][/ROW]
[ROW][C]9[/C][C]0.026572[/C][C]0.3211[/C][C]0.374308[/C][/ROW]
[ROW][C]10[/C][C]0.052181[/C][C]0.6305[/C][C]0.264675[/C][/ROW]
[ROW][C]11[/C][C]0.151347[/C][C]1.8287[/C][C]0.03474[/C][/ROW]
[ROW][C]12[/C][C]-0.292277[/C][C]-3.5316[/C][C]0.000277[/C][/ROW]
[ROW][C]13[/C][C]-0.286053[/C][C]-3.4564[/C][C]0.000359[/C][/ROW]
[ROW][C]14[/C][C]-0.207298[/C][C]-2.5048[/C][C]0.006675[/C][/ROW]
[ROW][C]15[/C][C]0.013262[/C][C]0.1602[/C][C]0.436457[/C][/ROW]
[ROW][C]16[/C][C]-0.074653[/C][C]-0.902[/C][C]0.184263[/C][/ROW]
[ROW][C]17[/C][C]-0.094885[/C][C]-1.1465[/C][C]0.126733[/C][/ROW]
[ROW][C]18[/C][C]0.126679[/C][C]1.5307[/C][C]0.064008[/C][/ROW]
[ROW][C]19[/C][C]-0.063743[/C][C]-0.7702[/C][C]0.221209[/C][/ROW]
[ROW][C]20[/C][C]-0.071075[/C][C]-0.8588[/C][C]0.195927[/C][/ROW]
[ROW][C]21[/C][C]0.017344[/C][C]0.2096[/C][C]0.417146[/C][/ROW]
[ROW][C]22[/C][C]-0.105041[/C][C]-1.2692[/C][C]0.103191[/C][/ROW]
[ROW][C]23[/C][C]0.272412[/C][C]3.2916[/C][C]0.000625[/C][/ROW]
[ROW][C]24[/C][C]-0.289469[/C][C]-3.4977[/C][C]0.000311[/C][/ROW]
[ROW][C]25[/C][C]-0.348252[/C][C]-4.2079[/C][C]2.2e-05[/C][/ROW]
[ROW][C]26[/C][C]-0.178599[/C][C]-2.158[/C][C]0.016281[/C][/ROW]
[ROW][C]27[/C][C]-0.008264[/C][C]-0.0999[/C][C]0.4603[/C][/ROW]
[ROW][C]28[/C][C]-0.213177[/C][C]-2.5758[/C][C]0.005497[/C][/ROW]
[ROW][C]29[/C][C]0.001509[/C][C]0.0182[/C][C]0.492739[/C][/ROW]
[ROW][C]30[/C][C]0.060228[/C][C]0.7277[/C][C]0.233971[/C][/ROW]
[ROW][C]31[/C][C]0.007027[/C][C]0.0849[/C][C]0.466226[/C][/ROW]
[ROW][C]32[/C][C]0.023297[/C][C]0.2815[/C][C]0.389364[/C][/ROW]
[ROW][C]33[/C][C]0.027921[/C][C]0.3374[/C][C]0.368159[/C][/ROW]
[ROW][C]34[/C][C]-0.009506[/C][C]-0.1149[/C][C]0.454355[/C][/ROW]
[ROW][C]35[/C][C]0.054636[/C][C]0.6602[/C][C]0.255093[/C][/ROW]
[ROW][C]36[/C][C]-0.088753[/C][C]-1.0724[/C][C]0.142654[/C][/ROW]
[ROW][C]37[/C][C]-0.159735[/C][C]-1.9301[/C][C]0.027767[/C][/ROW]
[ROW][C]38[/C][C]-0.055313[/C][C]-0.6684[/C][C]0.252483[/C][/ROW]
[ROW][C]39[/C][C]-0.093928[/C][C]-1.1349[/C][C]0.129131[/C][/ROW]
[ROW][C]40[/C][C]0.098769[/C][C]1.1934[/C][C]0.117317[/C][/ROW]
[ROW][C]41[/C][C]0.03949[/C][C]0.4772[/C][C]0.316981[/C][/ROW]
[ROW][C]42[/C][C]-0.056449[/C][C]-0.6821[/C][C]0.248135[/C][/ROW]
[ROW][C]43[/C][C]0.085463[/C][C]1.0327[/C][C]0.151735[/C][/ROW]
[ROW][C]44[/C][C]-0.0581[/C][C]-0.702[/C][C]0.241891[/C][/ROW]
[ROW][C]45[/C][C]-0.035863[/C][C]-0.4333[/C][C]0.332706[/C][/ROW]
[ROW][C]46[/C][C]-0.134441[/C][C]-1.6245[/C][C]0.053218[/C][/ROW]
[ROW][C]47[/C][C]0.068093[/C][C]0.8228[/C][C]0.205992[/C][/ROW]
[ROW][C]48[/C][C]-0.11486[/C][C]-1.3879[/C][C]0.083648[/C][/ROW]
[ROW][C]49[/C][C]-0.082839[/C][C]-1.001[/C][C]0.159253[/C][/ROW]
[ROW][C]50[/C][C]-0.116093[/C][C]-1.4028[/C][C]0.081406[/C][/ROW]
[ROW][C]51[/C][C]0.018518[/C][C]0.2237[/C][C]0.411633[/C][/ROW]
[ROW][C]52[/C][C]0.002068[/C][C]0.025[/C][C]0.490049[/C][/ROW]
[ROW][C]53[/C][C]-0.026683[/C][C]-0.3224[/C][C]0.373803[/C][/ROW]
[ROW][C]54[/C][C]0.015112[/C][C]0.1826[/C][C]0.427684[/C][/ROW]
[ROW][C]55[/C][C]-0.068535[/C][C]-0.8281[/C][C]0.204478[/C][/ROW]
[ROW][C]56[/C][C]-0.013779[/C][C]-0.1665[/C][C]0.434[/C][/ROW]
[ROW][C]57[/C][C]0.057689[/C][C]0.6971[/C][C]0.243436[/C][/ROW]
[ROW][C]58[/C][C]0.084022[/C][C]1.0152[/C][C]0.155834[/C][/ROW]
[ROW][C]59[/C][C]0.094364[/C][C]1.1402[/C][C]0.128033[/C][/ROW]
[ROW][C]60[/C][C]-0.123686[/C][C]-1.4945[/C][C]0.068601[/C][/ROW]
[/TABLE]
Source: https://freestatistics.org/blog/index.php?pk=36277&T=2

Globally Unique Identifier (entire table): ba.freestatistics.org/blog/index.php?pk=36277&T=2

As an alternative you can also use a QR Code:  

The GUIDs for individual cells are displayed in the table below:

Partial Autocorrelation Function
Time lag kPACF(k)T-STATP-value
1-0.382769-4.6254e-06
2-0.147412-1.78120.038481
3-0.014072-0.170.432609
40.0078540.09490.46226
5-0.116206-1.40410.081203
6-0.029925-0.36160.359092
7-0.012417-0.150.440473
80.0501750.60630.272639
90.0265720.32110.374308
100.0521810.63050.264675
110.1513471.82870.03474
12-0.292277-3.53160.000277
13-0.286053-3.45640.000359
14-0.207298-2.50480.006675
150.0132620.16020.436457
16-0.074653-0.9020.184263
17-0.094885-1.14650.126733
180.1266791.53070.064008
19-0.063743-0.77020.221209
20-0.071075-0.85880.195927
210.0173440.20960.417146
22-0.105041-1.26920.103191
230.2724123.29160.000625
24-0.289469-3.49770.000311
25-0.348252-4.20792.2e-05
26-0.178599-2.1580.016281
27-0.008264-0.09990.4603
28-0.213177-2.57580.005497
290.0015090.01820.492739
300.0602280.72770.233971
310.0070270.08490.466226
320.0232970.28150.389364
330.0279210.33740.368159
34-0.009506-0.11490.454355
350.0546360.66020.255093
36-0.088753-1.07240.142654
37-0.159735-1.93010.027767
38-0.055313-0.66840.252483
39-0.093928-1.13490.129131
400.0987691.19340.117317
410.039490.47720.316981
42-0.056449-0.68210.248135
430.0854631.03270.151735
44-0.0581-0.7020.241891
45-0.035863-0.43330.332706
46-0.134441-1.62450.053218
470.0680930.82280.205992
48-0.11486-1.38790.083648
49-0.082839-1.0010.159253
50-0.116093-1.40280.081406
510.0185180.22370.411633
520.0020680.0250.490049
53-0.026683-0.32240.373803
540.0151120.18260.427684
55-0.068535-0.82810.204478
56-0.013779-0.16650.434
570.0576890.69710.243436
580.0840221.01520.155834
590.0943641.14020.128033
60-0.123686-1.49450.068601


Parameters (Session):
par1 = 60 ; par2 = 0.3 ; par3 = 1 ; par4 = 1 ; par5 = 12 ;
Parameters (R input):
par1 = 60 ; par2 = 0.3 ; par3 = 1 ; par4 = 1 ; par5 = 12 ;
R code (references can be found in the software module):
if (par1 == 'Default') {
par1 = 10*log10(length(x))
} else {
par1 <- as.numeric(par1)
}
par2 <- as.numeric(par2)
par3 <- as.numeric(par3)
par4 <- as.numeric(par4)
par5 <- as.numeric(par5)
if (par2 == 0) {
x <- log(x)
} else {
x <- (x ^ par2 - 1) / par2
}
if (par3 > 0) x <- diff(x,lag=1,difference=par3)
if (par4 > 0) x <- diff(x,lag=par5,difference=par4)
bitmap(file='pic1.png')
racf <- acf(x,par1,main='Autocorrelation',xlab='lags',ylab='ACF')
dev.off()
bitmap(file='pic2.png')
rpacf <- pacf(x,par1,main='Partial Autocorrelation',xlab='lags',ylab='PACF')
dev.off()
(myacf <- c(racf$acf))
(mypacf <- c(rpacf$acf))
lengthx <- length(x)
sqrtn <- sqrt(lengthx)
load(file='createtable')
a<-table.start()
a<-table.row.start(a)
a<-table.element(a,'Autocorrelation Function',4,TRUE)
a<-table.row.end(a)
a<-table.row.start(a)
a<-table.element(a,'Time lag k',header=TRUE)
a<-table.element(a,hyperlink('basics.htm','ACF(k)','click here for more information about the Autocorrelation Function'),header=TRUE)
a<-table.element(a,'T-STAT',header=TRUE)
a<-table.element(a,'P-value',header=TRUE)
a<-table.row.end(a)
for (i in 2:(par1+1)) {
a<-table.row.start(a)
a<-table.element(a,i-1,header=TRUE)
a<-table.element(a,round(myacf[i],6))
mytstat <- myacf[i]*sqrtn
a<-table.element(a,round(mytstat,4))
a<-table.element(a,round(1-pt(abs(mytstat),lengthx),6))
a<-table.row.end(a)
}
a<-table.end(a)
table.save(a,file='mytable.tab')
a<-table.start()
a<-table.row.start(a)
a<-table.element(a,'Partial Autocorrelation Function',4,TRUE)
a<-table.row.end(a)
a<-table.row.start(a)
a<-table.element(a,'Time lag k',header=TRUE)
a<-table.element(a,hyperlink('basics.htm','PACF(k)','click here for more information about the Partial Autocorrelation Function'),header=TRUE)
a<-table.element(a,'T-STAT',header=TRUE)
a<-table.element(a,'P-value',header=TRUE)
a<-table.row.end(a)
for (i in 1:par1) {
a<-table.row.start(a)
a<-table.element(a,i,header=TRUE)
a<-table.element(a,round(mypacf[i],6))
mytstat <- mypacf[i]*sqrtn
a<-table.element(a,round(mytstat,4))
a<-table.element(a,round(1-pt(abs(mytstat),lengthx),6))
a<-table.row.end(a)
}
a<-table.end(a)
table.save(a,file='mytable1.tab')