Free Statistics

of Irreproducible Research!

Author's title

Author*Unverified author*
R Software Modulerwasp_autocorrelation.wasp
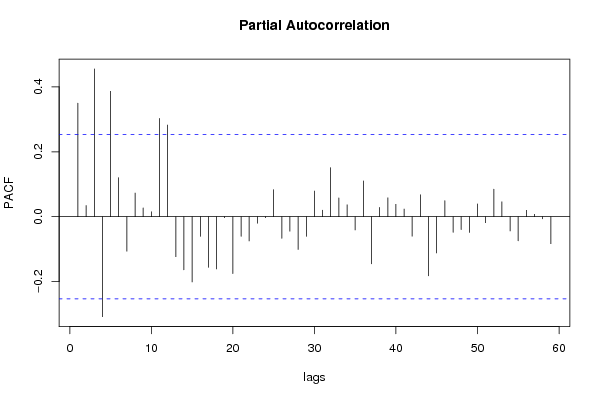
Title produced by software(Partial) Autocorrelation Function
Date of computationMon, 22 Dec 2008 17:34:11 -0700
Cite this page as followsStatistical Computations at FreeStatistics.org, Office for Research Development and Education, URL https://freestatistics.org/blog/index.php?v=date/2008/Dec/23/t1229992532ftk1isfwdmsc30v.htm/, Retrieved Sun, 19 May 2024 11:28:43 +0000
Statistical Computations at FreeStatistics.org, Office for Research Development and Education, URL https://freestatistics.org/blog/index.php?pk=36259, Retrieved Sun, 19 May 2024 11:28:43 +0000
QR Codes:

Original text written by user:
IsPrivate?No (this computation is public)
User-defined keywords
Estimated Impact163
Family? (F = Feedback message, R = changed R code, M = changed R Module, P = changed Parameters, D = changed Data)
-       [(Partial) Autocorrelation Function] [ACF productie] [2008-12-23 00:34:11] [af8fa2ce3787e7eb62013778260b011d] [Current]
Feedback Forum

Post a new message
Dataseries X:
98.6
98
106.8
96.6
100.1
107.7
91.5
97.8
107.4
117.5
105.6
97.4
99.5
98
104.3
100.6
101.1
103.9
96.9
95.5
108.4
117
103.8
100.8
110.6
104
112.6
107.3
98.9
109.8
104.9
102.2
123.9
124.9
112.7
121.9
100.6
104.3
120.4
107.5
102.9
125.6
107.5
108.8
128.4
121.1
119.5
128.7
108.7
105.5
119.8
111.3
110.6
120.1
97.5
107.7
127.3
117.2
119.8
116.2


Summary of computational transaction
Raw Inputview raw input (R code)
Raw Outputview raw output of R engine
Computing time8 seconds
R Server'George Udny Yule' @ 72.249.76.132

\begin{tabular}{lllllllll}
\hline
Summary of computational transaction \tabularnewline
Raw Input & view raw input (R code)  \tabularnewline
Raw Output & view raw output of R engine  \tabularnewline
Computing time & 8 seconds \tabularnewline
R Server & 'George Udny Yule' @ 72.249.76.132 \tabularnewline
\hline
\end{tabular}
%Source: https://freestatistics.org/blog/index.php?pk=36259&T=0

[TABLE]
[ROW][C]Summary of computational transaction[/C][/ROW]
[ROW][C]Raw Input[/C][C]view raw input (R code) [/C][/ROW]
[ROW][C]Raw Output[/C][C]view raw output of R engine [/C][/ROW]
[ROW][C]Computing time[/C][C]8 seconds[/C][/ROW]
[ROW][C]R Server[/C][C]'George Udny Yule' @ 72.249.76.132[/C][/ROW]
[/TABLE]
Source: https://freestatistics.org/blog/index.php?pk=36259&T=0

Globally Unique Identifier (entire table): ba.freestatistics.org/blog/index.php?pk=36259&T=0

As an alternative you can also use a QR Code:  

The GUIDs for individual cells are displayed in the table below:

Summary of computational transaction
Raw Inputview raw input (R code)
Raw Outputview raw output of R engine
Computing time8 seconds
R Server'George Udny Yule' @ 72.249.76.132


Autocorrelation Function
Time lag kACF(k)T-STATP-value
10.3495722.70780.004406
20.1522491.17930.121464
30.4624043.58180.000342
40.0758020.58720.27965
50.1826581.41490.081139
60.4875363.77640.000184
70.0745190.57720.282974
80.1250150.96840.168376
90.34042.63670.005321
100.0332350.25740.398861
110.292722.26740.01349
120.5860274.53931.4e-05
130.1341.0380.151728
140.1129640.8750.192526
150.2005751.55360.062764
16-0.093721-0.7260.235343
170.0642690.49780.310213
180.1493221.15660.126001
19-0.117045-0.90660.184115
20-0.046254-0.35830.360696
21-0.01333-0.10330.459052
22-0.164819-1.27670.103317
230.0545820.42280.33698
240.1527161.18290.120751
25-0.046416-0.35950.360229
26-0.067842-0.52550.300586
27-0.12683-0.98240.164919
28-0.263166-2.03850.022958
29-0.170912-1.32390.095282
30-0.116341-0.90120.18555
31-0.210528-1.63070.054092
32-0.17431-1.35020.091011
33-0.172062-1.33280.093821
34-0.228223-1.76780.041089
35-0.123199-0.95430.171881
36-0.001634-0.01270.494971
37-0.126459-0.97950.165622
38-0.181516-1.4060.082438
39-0.142871-1.10670.136426
40-0.239789-1.85740.034082
41-0.208492-1.6150.055782
42-0.099801-0.77310.221263
43-0.162158-1.25610.106979
44-0.192769-1.49320.070315
45-0.162984-1.26250.105833
46-0.161309-1.24950.108168
47-0.089768-0.69530.244762
480.0167590.12980.448574
49-0.059905-0.4640.322155
50-0.101143-0.78350.218222
51-0.040508-0.31380.377392
52-0.101613-0.78710.217163
53-0.079944-0.61920.26905
54-0.021658-0.16780.433667
55-0.074983-0.58080.281769
56-0.072632-0.56260.2879
57-0.040675-0.31510.376903
58-0.035683-0.27640.391596
59-0.014033-0.10870.456903
60NANANA

\begin{tabular}{lllllllll}
\hline
Autocorrelation Function \tabularnewline
Time lag k & ACF(k) & T-STAT & P-value \tabularnewline
1 & 0.349572 & 2.7078 & 0.004406 \tabularnewline
2 & 0.152249 & 1.1793 & 0.121464 \tabularnewline
3 & 0.462404 & 3.5818 & 0.000342 \tabularnewline
4 & 0.075802 & 0.5872 & 0.27965 \tabularnewline
5 & 0.182658 & 1.4149 & 0.081139 \tabularnewline
6 & 0.487536 & 3.7764 & 0.000184 \tabularnewline
7 & 0.074519 & 0.5772 & 0.282974 \tabularnewline
8 & 0.125015 & 0.9684 & 0.168376 \tabularnewline
9 & 0.3404 & 2.6367 & 0.005321 \tabularnewline
10 & 0.033235 & 0.2574 & 0.398861 \tabularnewline
11 & 0.29272 & 2.2674 & 0.01349 \tabularnewline
12 & 0.586027 & 4.5393 & 1.4e-05 \tabularnewline
13 & 0.134 & 1.038 & 0.151728 \tabularnewline
14 & 0.112964 & 0.875 & 0.192526 \tabularnewline
15 & 0.200575 & 1.5536 & 0.062764 \tabularnewline
16 & -0.093721 & -0.726 & 0.235343 \tabularnewline
17 & 0.064269 & 0.4978 & 0.310213 \tabularnewline
18 & 0.149322 & 1.1566 & 0.126001 \tabularnewline
19 & -0.117045 & -0.9066 & 0.184115 \tabularnewline
20 & -0.046254 & -0.3583 & 0.360696 \tabularnewline
21 & -0.01333 & -0.1033 & 0.459052 \tabularnewline
22 & -0.164819 & -1.2767 & 0.103317 \tabularnewline
23 & 0.054582 & 0.4228 & 0.33698 \tabularnewline
24 & 0.152716 & 1.1829 & 0.120751 \tabularnewline
25 & -0.046416 & -0.3595 & 0.360229 \tabularnewline
26 & -0.067842 & -0.5255 & 0.300586 \tabularnewline
27 & -0.12683 & -0.9824 & 0.164919 \tabularnewline
28 & -0.263166 & -2.0385 & 0.022958 \tabularnewline
29 & -0.170912 & -1.3239 & 0.095282 \tabularnewline
30 & -0.116341 & -0.9012 & 0.18555 \tabularnewline
31 & -0.210528 & -1.6307 & 0.054092 \tabularnewline
32 & -0.17431 & -1.3502 & 0.091011 \tabularnewline
33 & -0.172062 & -1.3328 & 0.093821 \tabularnewline
34 & -0.228223 & -1.7678 & 0.041089 \tabularnewline
35 & -0.123199 & -0.9543 & 0.171881 \tabularnewline
36 & -0.001634 & -0.0127 & 0.494971 \tabularnewline
37 & -0.126459 & -0.9795 & 0.165622 \tabularnewline
38 & -0.181516 & -1.406 & 0.082438 \tabularnewline
39 & -0.142871 & -1.1067 & 0.136426 \tabularnewline
40 & -0.239789 & -1.8574 & 0.034082 \tabularnewline
41 & -0.208492 & -1.615 & 0.055782 \tabularnewline
42 & -0.099801 & -0.7731 & 0.221263 \tabularnewline
43 & -0.162158 & -1.2561 & 0.106979 \tabularnewline
44 & -0.192769 & -1.4932 & 0.070315 \tabularnewline
45 & -0.162984 & -1.2625 & 0.105833 \tabularnewline
46 & -0.161309 & -1.2495 & 0.108168 \tabularnewline
47 & -0.089768 & -0.6953 & 0.244762 \tabularnewline
48 & 0.016759 & 0.1298 & 0.448574 \tabularnewline
49 & -0.059905 & -0.464 & 0.322155 \tabularnewline
50 & -0.101143 & -0.7835 & 0.218222 \tabularnewline
51 & -0.040508 & -0.3138 & 0.377392 \tabularnewline
52 & -0.101613 & -0.7871 & 0.217163 \tabularnewline
53 & -0.079944 & -0.6192 & 0.26905 \tabularnewline
54 & -0.021658 & -0.1678 & 0.433667 \tabularnewline
55 & -0.074983 & -0.5808 & 0.281769 \tabularnewline
56 & -0.072632 & -0.5626 & 0.2879 \tabularnewline
57 & -0.040675 & -0.3151 & 0.376903 \tabularnewline
58 & -0.035683 & -0.2764 & 0.391596 \tabularnewline
59 & -0.014033 & -0.1087 & 0.456903 \tabularnewline
60 & NA & NA & NA \tabularnewline
\hline
\end{tabular}
%Source: https://freestatistics.org/blog/index.php?pk=36259&T=1

[TABLE]
[ROW][C]Autocorrelation Function[/C][/ROW]
[ROW][C]Time lag k[/C][C]ACF(k)[/C][C]T-STAT[/C][C]P-value[/C][/ROW]
[ROW][C]1[/C][C]0.349572[/C][C]2.7078[/C][C]0.004406[/C][/ROW]
[ROW][C]2[/C][C]0.152249[/C][C]1.1793[/C][C]0.121464[/C][/ROW]
[ROW][C]3[/C][C]0.462404[/C][C]3.5818[/C][C]0.000342[/C][/ROW]
[ROW][C]4[/C][C]0.075802[/C][C]0.5872[/C][C]0.27965[/C][/ROW]
[ROW][C]5[/C][C]0.182658[/C][C]1.4149[/C][C]0.081139[/C][/ROW]
[ROW][C]6[/C][C]0.487536[/C][C]3.7764[/C][C]0.000184[/C][/ROW]
[ROW][C]7[/C][C]0.074519[/C][C]0.5772[/C][C]0.282974[/C][/ROW]
[ROW][C]8[/C][C]0.125015[/C][C]0.9684[/C][C]0.168376[/C][/ROW]
[ROW][C]9[/C][C]0.3404[/C][C]2.6367[/C][C]0.005321[/C][/ROW]
[ROW][C]10[/C][C]0.033235[/C][C]0.2574[/C][C]0.398861[/C][/ROW]
[ROW][C]11[/C][C]0.29272[/C][C]2.2674[/C][C]0.01349[/C][/ROW]
[ROW][C]12[/C][C]0.586027[/C][C]4.5393[/C][C]1.4e-05[/C][/ROW]
[ROW][C]13[/C][C]0.134[/C][C]1.038[/C][C]0.151728[/C][/ROW]
[ROW][C]14[/C][C]0.112964[/C][C]0.875[/C][C]0.192526[/C][/ROW]
[ROW][C]15[/C][C]0.200575[/C][C]1.5536[/C][C]0.062764[/C][/ROW]
[ROW][C]16[/C][C]-0.093721[/C][C]-0.726[/C][C]0.235343[/C][/ROW]
[ROW][C]17[/C][C]0.064269[/C][C]0.4978[/C][C]0.310213[/C][/ROW]
[ROW][C]18[/C][C]0.149322[/C][C]1.1566[/C][C]0.126001[/C][/ROW]
[ROW][C]19[/C][C]-0.117045[/C][C]-0.9066[/C][C]0.184115[/C][/ROW]
[ROW][C]20[/C][C]-0.046254[/C][C]-0.3583[/C][C]0.360696[/C][/ROW]
[ROW][C]21[/C][C]-0.01333[/C][C]-0.1033[/C][C]0.459052[/C][/ROW]
[ROW][C]22[/C][C]-0.164819[/C][C]-1.2767[/C][C]0.103317[/C][/ROW]
[ROW][C]23[/C][C]0.054582[/C][C]0.4228[/C][C]0.33698[/C][/ROW]
[ROW][C]24[/C][C]0.152716[/C][C]1.1829[/C][C]0.120751[/C][/ROW]
[ROW][C]25[/C][C]-0.046416[/C][C]-0.3595[/C][C]0.360229[/C][/ROW]
[ROW][C]26[/C][C]-0.067842[/C][C]-0.5255[/C][C]0.300586[/C][/ROW]
[ROW][C]27[/C][C]-0.12683[/C][C]-0.9824[/C][C]0.164919[/C][/ROW]
[ROW][C]28[/C][C]-0.263166[/C][C]-2.0385[/C][C]0.022958[/C][/ROW]
[ROW][C]29[/C][C]-0.170912[/C][C]-1.3239[/C][C]0.095282[/C][/ROW]
[ROW][C]30[/C][C]-0.116341[/C][C]-0.9012[/C][C]0.18555[/C][/ROW]
[ROW][C]31[/C][C]-0.210528[/C][C]-1.6307[/C][C]0.054092[/C][/ROW]
[ROW][C]32[/C][C]-0.17431[/C][C]-1.3502[/C][C]0.091011[/C][/ROW]
[ROW][C]33[/C][C]-0.172062[/C][C]-1.3328[/C][C]0.093821[/C][/ROW]
[ROW][C]34[/C][C]-0.228223[/C][C]-1.7678[/C][C]0.041089[/C][/ROW]
[ROW][C]35[/C][C]-0.123199[/C][C]-0.9543[/C][C]0.171881[/C][/ROW]
[ROW][C]36[/C][C]-0.001634[/C][C]-0.0127[/C][C]0.494971[/C][/ROW]
[ROW][C]37[/C][C]-0.126459[/C][C]-0.9795[/C][C]0.165622[/C][/ROW]
[ROW][C]38[/C][C]-0.181516[/C][C]-1.406[/C][C]0.082438[/C][/ROW]
[ROW][C]39[/C][C]-0.142871[/C][C]-1.1067[/C][C]0.136426[/C][/ROW]
[ROW][C]40[/C][C]-0.239789[/C][C]-1.8574[/C][C]0.034082[/C][/ROW]
[ROW][C]41[/C][C]-0.208492[/C][C]-1.615[/C][C]0.055782[/C][/ROW]
[ROW][C]42[/C][C]-0.099801[/C][C]-0.7731[/C][C]0.221263[/C][/ROW]
[ROW][C]43[/C][C]-0.162158[/C][C]-1.2561[/C][C]0.106979[/C][/ROW]
[ROW][C]44[/C][C]-0.192769[/C][C]-1.4932[/C][C]0.070315[/C][/ROW]
[ROW][C]45[/C][C]-0.162984[/C][C]-1.2625[/C][C]0.105833[/C][/ROW]
[ROW][C]46[/C][C]-0.161309[/C][C]-1.2495[/C][C]0.108168[/C][/ROW]
[ROW][C]47[/C][C]-0.089768[/C][C]-0.6953[/C][C]0.244762[/C][/ROW]
[ROW][C]48[/C][C]0.016759[/C][C]0.1298[/C][C]0.448574[/C][/ROW]
[ROW][C]49[/C][C]-0.059905[/C][C]-0.464[/C][C]0.322155[/C][/ROW]
[ROW][C]50[/C][C]-0.101143[/C][C]-0.7835[/C][C]0.218222[/C][/ROW]
[ROW][C]51[/C][C]-0.040508[/C][C]-0.3138[/C][C]0.377392[/C][/ROW]
[ROW][C]52[/C][C]-0.101613[/C][C]-0.7871[/C][C]0.217163[/C][/ROW]
[ROW][C]53[/C][C]-0.079944[/C][C]-0.6192[/C][C]0.26905[/C][/ROW]
[ROW][C]54[/C][C]-0.021658[/C][C]-0.1678[/C][C]0.433667[/C][/ROW]
[ROW][C]55[/C][C]-0.074983[/C][C]-0.5808[/C][C]0.281769[/C][/ROW]
[ROW][C]56[/C][C]-0.072632[/C][C]-0.5626[/C][C]0.2879[/C][/ROW]
[ROW][C]57[/C][C]-0.040675[/C][C]-0.3151[/C][C]0.376903[/C][/ROW]
[ROW][C]58[/C][C]-0.035683[/C][C]-0.2764[/C][C]0.391596[/C][/ROW]
[ROW][C]59[/C][C]-0.014033[/C][C]-0.1087[/C][C]0.456903[/C][/ROW]
[ROW][C]60[/C][C]NA[/C][C]NA[/C][C]NA[/C][/ROW]
[/TABLE]
Source: https://freestatistics.org/blog/index.php?pk=36259&T=1

Globally Unique Identifier (entire table): ba.freestatistics.org/blog/index.php?pk=36259&T=1

As an alternative you can also use a QR Code:  

The GUIDs for individual cells are displayed in the table below:

Autocorrelation Function
Time lag kACF(k)T-STATP-value
10.3495722.70780.004406
20.1522491.17930.121464
30.4624043.58180.000342
40.0758020.58720.27965
50.1826581.41490.081139
60.4875363.77640.000184
70.0745190.57720.282974
80.1250150.96840.168376
90.34042.63670.005321
100.0332350.25740.398861
110.292722.26740.01349
120.5860274.53931.4e-05
130.1341.0380.151728
140.1129640.8750.192526
150.2005751.55360.062764
16-0.093721-0.7260.235343
170.0642690.49780.310213
180.1493221.15660.126001
19-0.117045-0.90660.184115
20-0.046254-0.35830.360696
21-0.01333-0.10330.459052
22-0.164819-1.27670.103317
230.0545820.42280.33698
240.1527161.18290.120751
25-0.046416-0.35950.360229
26-0.067842-0.52550.300586
27-0.12683-0.98240.164919
28-0.263166-2.03850.022958
29-0.170912-1.32390.095282
30-0.116341-0.90120.18555
31-0.210528-1.63070.054092
32-0.17431-1.35020.091011
33-0.172062-1.33280.093821
34-0.228223-1.76780.041089
35-0.123199-0.95430.171881
36-0.001634-0.01270.494971
37-0.126459-0.97950.165622
38-0.181516-1.4060.082438
39-0.142871-1.10670.136426
40-0.239789-1.85740.034082
41-0.208492-1.6150.055782
42-0.099801-0.77310.221263
43-0.162158-1.25610.106979
44-0.192769-1.49320.070315
45-0.162984-1.26250.105833
46-0.161309-1.24950.108168
47-0.089768-0.69530.244762
480.0167590.12980.448574
49-0.059905-0.4640.322155
50-0.101143-0.78350.218222
51-0.040508-0.31380.377392
52-0.101613-0.78710.217163
53-0.079944-0.61920.26905
54-0.021658-0.16780.433667
55-0.074983-0.58080.281769
56-0.072632-0.56260.2879
57-0.040675-0.31510.376903
58-0.035683-0.27640.391596
59-0.014033-0.10870.456903
60NANANA


Partial Autocorrelation Function
Time lag kPACF(k)T-STATP-value
10.3495722.70780.004406
20.0342310.26520.3959
30.4551223.52540.000408
4-0.307873-2.38480.010133
50.3862982.99230.002008
60.1200830.93020.178008
7-0.106135-0.82210.207133
80.0727640.56360.287555
90.0269440.20870.417692
100.0149740.1160.454025
110.3028482.34590.011153
120.2823642.18720.016319
13-0.123195-0.95430.17189
14-0.163565-1.2670.105032
15-0.200983-1.55680.062388
16-0.060435-0.46810.320695
17-0.155874-1.20740.116009
18-0.160931-1.24660.108701
19-0.003001-0.02320.490766
20-0.174999-1.35550.090164
21-0.060343-0.46740.320948
22-0.074778-0.57920.282303
23-0.019829-0.15360.439221
24-0.003138-0.02430.490344
250.0831480.64410.260995
26-0.06655-0.51550.304051
27-0.044536-0.3450.365661
28-0.100807-0.78080.218982
29-0.060462-0.46830.32062
300.0789490.61150.271576
310.020010.1550.438673
320.1510871.17030.123252
330.0579270.44870.327632
340.0366910.28420.388614
35-0.040849-0.31640.376393
360.1102220.85380.198311
37-0.145173-1.12450.132639
380.0284730.22060.413095
390.0581650.45050.32697
400.0381410.29540.384339
410.0234450.18160.428253
42-0.060222-0.46650.321283
430.067520.5230.301448
44-0.181936-1.40930.081959
45-0.111739-0.86550.195099
460.0492960.38180.351963
47-0.047931-0.37130.355872
48-0.039447-0.30560.380502
49-0.048428-0.37510.354446
500.0391750.30340.381299
51-0.01836-0.14220.443694
520.0848090.65690.25687
530.0458080.35480.361981
54-0.043981-0.34070.367269
55-0.074311-0.57560.283516
560.0198640.15390.439116
570.0075510.05850.476776
58-0.006559-0.05080.479824
59-0.083083-0.64360.261157
60NANANA

\begin{tabular}{lllllllll}
\hline
Partial Autocorrelation Function \tabularnewline
Time lag k & PACF(k) & T-STAT & P-value \tabularnewline
1 & 0.349572 & 2.7078 & 0.004406 \tabularnewline
2 & 0.034231 & 0.2652 & 0.3959 \tabularnewline
3 & 0.455122 & 3.5254 & 0.000408 \tabularnewline
4 & -0.307873 & -2.3848 & 0.010133 \tabularnewline
5 & 0.386298 & 2.9923 & 0.002008 \tabularnewline
6 & 0.120083 & 0.9302 & 0.178008 \tabularnewline
7 & -0.106135 & -0.8221 & 0.207133 \tabularnewline
8 & 0.072764 & 0.5636 & 0.287555 \tabularnewline
9 & 0.026944 & 0.2087 & 0.417692 \tabularnewline
10 & 0.014974 & 0.116 & 0.454025 \tabularnewline
11 & 0.302848 & 2.3459 & 0.011153 \tabularnewline
12 & 0.282364 & 2.1872 & 0.016319 \tabularnewline
13 & -0.123195 & -0.9543 & 0.17189 \tabularnewline
14 & -0.163565 & -1.267 & 0.105032 \tabularnewline
15 & -0.200983 & -1.5568 & 0.062388 \tabularnewline
16 & -0.060435 & -0.4681 & 0.320695 \tabularnewline
17 & -0.155874 & -1.2074 & 0.116009 \tabularnewline
18 & -0.160931 & -1.2466 & 0.108701 \tabularnewline
19 & -0.003001 & -0.0232 & 0.490766 \tabularnewline
20 & -0.174999 & -1.3555 & 0.090164 \tabularnewline
21 & -0.060343 & -0.4674 & 0.320948 \tabularnewline
22 & -0.074778 & -0.5792 & 0.282303 \tabularnewline
23 & -0.019829 & -0.1536 & 0.439221 \tabularnewline
24 & -0.003138 & -0.0243 & 0.490344 \tabularnewline
25 & 0.083148 & 0.6441 & 0.260995 \tabularnewline
26 & -0.06655 & -0.5155 & 0.304051 \tabularnewline
27 & -0.044536 & -0.345 & 0.365661 \tabularnewline
28 & -0.100807 & -0.7808 & 0.218982 \tabularnewline
29 & -0.060462 & -0.4683 & 0.32062 \tabularnewline
30 & 0.078949 & 0.6115 & 0.271576 \tabularnewline
31 & 0.02001 & 0.155 & 0.438673 \tabularnewline
32 & 0.151087 & 1.1703 & 0.123252 \tabularnewline
33 & 0.057927 & 0.4487 & 0.327632 \tabularnewline
34 & 0.036691 & 0.2842 & 0.388614 \tabularnewline
35 & -0.040849 & -0.3164 & 0.376393 \tabularnewline
36 & 0.110222 & 0.8538 & 0.198311 \tabularnewline
37 & -0.145173 & -1.1245 & 0.132639 \tabularnewline
38 & 0.028473 & 0.2206 & 0.413095 \tabularnewline
39 & 0.058165 & 0.4505 & 0.32697 \tabularnewline
40 & 0.038141 & 0.2954 & 0.384339 \tabularnewline
41 & 0.023445 & 0.1816 & 0.428253 \tabularnewline
42 & -0.060222 & -0.4665 & 0.321283 \tabularnewline
43 & 0.06752 & 0.523 & 0.301448 \tabularnewline
44 & -0.181936 & -1.4093 & 0.081959 \tabularnewline
45 & -0.111739 & -0.8655 & 0.195099 \tabularnewline
46 & 0.049296 & 0.3818 & 0.351963 \tabularnewline
47 & -0.047931 & -0.3713 & 0.355872 \tabularnewline
48 & -0.039447 & -0.3056 & 0.380502 \tabularnewline
49 & -0.048428 & -0.3751 & 0.354446 \tabularnewline
50 & 0.039175 & 0.3034 & 0.381299 \tabularnewline
51 & -0.01836 & -0.1422 & 0.443694 \tabularnewline
52 & 0.084809 & 0.6569 & 0.25687 \tabularnewline
53 & 0.045808 & 0.3548 & 0.361981 \tabularnewline
54 & -0.043981 & -0.3407 & 0.367269 \tabularnewline
55 & -0.074311 & -0.5756 & 0.283516 \tabularnewline
56 & 0.019864 & 0.1539 & 0.439116 \tabularnewline
57 & 0.007551 & 0.0585 & 0.476776 \tabularnewline
58 & -0.006559 & -0.0508 & 0.479824 \tabularnewline
59 & -0.083083 & -0.6436 & 0.261157 \tabularnewline
60 & NA & NA & NA \tabularnewline
\hline
\end{tabular}
%Source: https://freestatistics.org/blog/index.php?pk=36259&T=2

[TABLE]
[ROW][C]Partial Autocorrelation Function[/C][/ROW]
[ROW][C]Time lag k[/C][C]PACF(k)[/C][C]T-STAT[/C][C]P-value[/C][/ROW]
[ROW][C]1[/C][C]0.349572[/C][C]2.7078[/C][C]0.004406[/C][/ROW]
[ROW][C]2[/C][C]0.034231[/C][C]0.2652[/C][C]0.3959[/C][/ROW]
[ROW][C]3[/C][C]0.455122[/C][C]3.5254[/C][C]0.000408[/C][/ROW]
[ROW][C]4[/C][C]-0.307873[/C][C]-2.3848[/C][C]0.010133[/C][/ROW]
[ROW][C]5[/C][C]0.386298[/C][C]2.9923[/C][C]0.002008[/C][/ROW]
[ROW][C]6[/C][C]0.120083[/C][C]0.9302[/C][C]0.178008[/C][/ROW]
[ROW][C]7[/C][C]-0.106135[/C][C]-0.8221[/C][C]0.207133[/C][/ROW]
[ROW][C]8[/C][C]0.072764[/C][C]0.5636[/C][C]0.287555[/C][/ROW]
[ROW][C]9[/C][C]0.026944[/C][C]0.2087[/C][C]0.417692[/C][/ROW]
[ROW][C]10[/C][C]0.014974[/C][C]0.116[/C][C]0.454025[/C][/ROW]
[ROW][C]11[/C][C]0.302848[/C][C]2.3459[/C][C]0.011153[/C][/ROW]
[ROW][C]12[/C][C]0.282364[/C][C]2.1872[/C][C]0.016319[/C][/ROW]
[ROW][C]13[/C][C]-0.123195[/C][C]-0.9543[/C][C]0.17189[/C][/ROW]
[ROW][C]14[/C][C]-0.163565[/C][C]-1.267[/C][C]0.105032[/C][/ROW]
[ROW][C]15[/C][C]-0.200983[/C][C]-1.5568[/C][C]0.062388[/C][/ROW]
[ROW][C]16[/C][C]-0.060435[/C][C]-0.4681[/C][C]0.320695[/C][/ROW]
[ROW][C]17[/C][C]-0.155874[/C][C]-1.2074[/C][C]0.116009[/C][/ROW]
[ROW][C]18[/C][C]-0.160931[/C][C]-1.2466[/C][C]0.108701[/C][/ROW]
[ROW][C]19[/C][C]-0.003001[/C][C]-0.0232[/C][C]0.490766[/C][/ROW]
[ROW][C]20[/C][C]-0.174999[/C][C]-1.3555[/C][C]0.090164[/C][/ROW]
[ROW][C]21[/C][C]-0.060343[/C][C]-0.4674[/C][C]0.320948[/C][/ROW]
[ROW][C]22[/C][C]-0.074778[/C][C]-0.5792[/C][C]0.282303[/C][/ROW]
[ROW][C]23[/C][C]-0.019829[/C][C]-0.1536[/C][C]0.439221[/C][/ROW]
[ROW][C]24[/C][C]-0.003138[/C][C]-0.0243[/C][C]0.490344[/C][/ROW]
[ROW][C]25[/C][C]0.083148[/C][C]0.6441[/C][C]0.260995[/C][/ROW]
[ROW][C]26[/C][C]-0.06655[/C][C]-0.5155[/C][C]0.304051[/C][/ROW]
[ROW][C]27[/C][C]-0.044536[/C][C]-0.345[/C][C]0.365661[/C][/ROW]
[ROW][C]28[/C][C]-0.100807[/C][C]-0.7808[/C][C]0.218982[/C][/ROW]
[ROW][C]29[/C][C]-0.060462[/C][C]-0.4683[/C][C]0.32062[/C][/ROW]
[ROW][C]30[/C][C]0.078949[/C][C]0.6115[/C][C]0.271576[/C][/ROW]
[ROW][C]31[/C][C]0.02001[/C][C]0.155[/C][C]0.438673[/C][/ROW]
[ROW][C]32[/C][C]0.151087[/C][C]1.1703[/C][C]0.123252[/C][/ROW]
[ROW][C]33[/C][C]0.057927[/C][C]0.4487[/C][C]0.327632[/C][/ROW]
[ROW][C]34[/C][C]0.036691[/C][C]0.2842[/C][C]0.388614[/C][/ROW]
[ROW][C]35[/C][C]-0.040849[/C][C]-0.3164[/C][C]0.376393[/C][/ROW]
[ROW][C]36[/C][C]0.110222[/C][C]0.8538[/C][C]0.198311[/C][/ROW]
[ROW][C]37[/C][C]-0.145173[/C][C]-1.1245[/C][C]0.132639[/C][/ROW]
[ROW][C]38[/C][C]0.028473[/C][C]0.2206[/C][C]0.413095[/C][/ROW]
[ROW][C]39[/C][C]0.058165[/C][C]0.4505[/C][C]0.32697[/C][/ROW]
[ROW][C]40[/C][C]0.038141[/C][C]0.2954[/C][C]0.384339[/C][/ROW]
[ROW][C]41[/C][C]0.023445[/C][C]0.1816[/C][C]0.428253[/C][/ROW]
[ROW][C]42[/C][C]-0.060222[/C][C]-0.4665[/C][C]0.321283[/C][/ROW]
[ROW][C]43[/C][C]0.06752[/C][C]0.523[/C][C]0.301448[/C][/ROW]
[ROW][C]44[/C][C]-0.181936[/C][C]-1.4093[/C][C]0.081959[/C][/ROW]
[ROW][C]45[/C][C]-0.111739[/C][C]-0.8655[/C][C]0.195099[/C][/ROW]
[ROW][C]46[/C][C]0.049296[/C][C]0.3818[/C][C]0.351963[/C][/ROW]
[ROW][C]47[/C][C]-0.047931[/C][C]-0.3713[/C][C]0.355872[/C][/ROW]
[ROW][C]48[/C][C]-0.039447[/C][C]-0.3056[/C][C]0.380502[/C][/ROW]
[ROW][C]49[/C][C]-0.048428[/C][C]-0.3751[/C][C]0.354446[/C][/ROW]
[ROW][C]50[/C][C]0.039175[/C][C]0.3034[/C][C]0.381299[/C][/ROW]
[ROW][C]51[/C][C]-0.01836[/C][C]-0.1422[/C][C]0.443694[/C][/ROW]
[ROW][C]52[/C][C]0.084809[/C][C]0.6569[/C][C]0.25687[/C][/ROW]
[ROW][C]53[/C][C]0.045808[/C][C]0.3548[/C][C]0.361981[/C][/ROW]
[ROW][C]54[/C][C]-0.043981[/C][C]-0.3407[/C][C]0.367269[/C][/ROW]
[ROW][C]55[/C][C]-0.074311[/C][C]-0.5756[/C][C]0.283516[/C][/ROW]
[ROW][C]56[/C][C]0.019864[/C][C]0.1539[/C][C]0.439116[/C][/ROW]
[ROW][C]57[/C][C]0.007551[/C][C]0.0585[/C][C]0.476776[/C][/ROW]
[ROW][C]58[/C][C]-0.006559[/C][C]-0.0508[/C][C]0.479824[/C][/ROW]
[ROW][C]59[/C][C]-0.083083[/C][C]-0.6436[/C][C]0.261157[/C][/ROW]
[ROW][C]60[/C][C]NA[/C][C]NA[/C][C]NA[/C][/ROW]
[/TABLE]
Source: https://freestatistics.org/blog/index.php?pk=36259&T=2

Globally Unique Identifier (entire table): ba.freestatistics.org/blog/index.php?pk=36259&T=2

As an alternative you can also use a QR Code:  

The GUIDs for individual cells are displayed in the table below:

Partial Autocorrelation Function
Time lag kPACF(k)T-STATP-value
10.3495722.70780.004406
20.0342310.26520.3959
30.4551223.52540.000408
4-0.307873-2.38480.010133
50.3862982.99230.002008
60.1200830.93020.178008
7-0.106135-0.82210.207133
80.0727640.56360.287555
90.0269440.20870.417692
100.0149740.1160.454025
110.3028482.34590.011153
120.2823642.18720.016319
13-0.123195-0.95430.17189
14-0.163565-1.2670.105032
15-0.200983-1.55680.062388
16-0.060435-0.46810.320695
17-0.155874-1.20740.116009
18-0.160931-1.24660.108701
19-0.003001-0.02320.490766
20-0.174999-1.35550.090164
21-0.060343-0.46740.320948
22-0.074778-0.57920.282303
23-0.019829-0.15360.439221
24-0.003138-0.02430.490344
250.0831480.64410.260995
26-0.06655-0.51550.304051
27-0.044536-0.3450.365661
28-0.100807-0.78080.218982
29-0.060462-0.46830.32062
300.0789490.61150.271576
310.020010.1550.438673
320.1510871.17030.123252
330.0579270.44870.327632
340.0366910.28420.388614
35-0.040849-0.31640.376393
360.1102220.85380.198311
37-0.145173-1.12450.132639
380.0284730.22060.413095
390.0581650.45050.32697
400.0381410.29540.384339
410.0234450.18160.428253
42-0.060222-0.46650.321283
430.067520.5230.301448
44-0.181936-1.40930.081959
45-0.111739-0.86550.195099
460.0492960.38180.351963
47-0.047931-0.37130.355872
48-0.039447-0.30560.380502
49-0.048428-0.37510.354446
500.0391750.30340.381299
51-0.01836-0.14220.443694
520.0848090.65690.25687
530.0458080.35480.361981
54-0.043981-0.34070.367269
55-0.074311-0.57560.283516
560.0198640.15390.439116
570.0075510.05850.476776
58-0.006559-0.05080.479824
59-0.083083-0.64360.261157
60NANANA


Parameters (Session):
par1 = 60 ; par2 = 1 ; par3 = 0 ; par4 = 0 ; par5 = 12 ;
Parameters (R input):
par1 = 60 ; par2 = 1 ; par3 = 0 ; par4 = 0 ; par5 = 12 ;
R code (references can be found in the software module):
if (par1 == 'Default') {
par1 = 10*log10(length(x))
} else {
par1 <- as.numeric(par1)
}
par2 <- as.numeric(par2)
par3 <- as.numeric(par3)
par4 <- as.numeric(par4)
par5 <- as.numeric(par5)
if (par2 == 0) {
x <- log(x)
} else {
x <- (x ^ par2 - 1) / par2
}
if (par3 > 0) x <- diff(x,lag=1,difference=par3)
if (par4 > 0) x <- diff(x,lag=par5,difference=par4)
bitmap(file='pic1.png')
racf <- acf(x,par1,main='Autocorrelation',xlab='lags',ylab='ACF')
dev.off()
bitmap(file='pic2.png')
rpacf <- pacf(x,par1,main='Partial Autocorrelation',xlab='lags',ylab='PACF')
dev.off()
(myacf <- c(racf$acf))
(mypacf <- c(rpacf$acf))
lengthx <- length(x)
sqrtn <- sqrt(lengthx)
load(file='createtable')
a<-table.start()
a<-table.row.start(a)
a<-table.element(a,'Autocorrelation Function',4,TRUE)
a<-table.row.end(a)
a<-table.row.start(a)
a<-table.element(a,'Time lag k',header=TRUE)
a<-table.element(a,hyperlink('basics.htm','ACF(k)','click here for more information about the Autocorrelation Function'),header=TRUE)
a<-table.element(a,'T-STAT',header=TRUE)
a<-table.element(a,'P-value',header=TRUE)
a<-table.row.end(a)
for (i in 2:(par1+1)) {
a<-table.row.start(a)
a<-table.element(a,i-1,header=TRUE)
a<-table.element(a,round(myacf[i],6))
mytstat <- myacf[i]*sqrtn
a<-table.element(a,round(mytstat,4))
a<-table.element(a,round(1-pt(abs(mytstat),lengthx),6))
a<-table.row.end(a)
}
a<-table.end(a)
table.save(a,file='mytable.tab')
a<-table.start()
a<-table.row.start(a)
a<-table.element(a,'Partial Autocorrelation Function',4,TRUE)
a<-table.row.end(a)
a<-table.row.start(a)
a<-table.element(a,'Time lag k',header=TRUE)
a<-table.element(a,hyperlink('basics.htm','PACF(k)','click here for more information about the Partial Autocorrelation Function'),header=TRUE)
a<-table.element(a,'T-STAT',header=TRUE)
a<-table.element(a,'P-value',header=TRUE)
a<-table.row.end(a)
for (i in 1:par1) {
a<-table.row.start(a)
a<-table.element(a,i,header=TRUE)
a<-table.element(a,round(mypacf[i],6))
mytstat <- mypacf[i]*sqrtn
a<-table.element(a,round(mytstat,4))
a<-table.element(a,round(1-pt(abs(mytstat),lengthx),6))
a<-table.row.end(a)
}
a<-table.end(a)
table.save(a,file='mytable1.tab')