Free Statistics

of Irreproducible Research!

Author's title

Author*Unverified author*
R Software Modulerwasp_autocorrelation.wasp
Title produced by software(Partial) Autocorrelation Function
Date of computationSun, 21 Dec 2008 15:35:44 -0700
Cite this page as followsStatistical Computations at FreeStatistics.org, Office for Research Development and Education, URL https://freestatistics.org/blog/index.php?v=date/2008/Dec/21/t1229898968tg2sgxo42yd7ktu.htm/, Retrieved Sun, 19 May 2024 10:48:32 +0000
Statistical Computations at FreeStatistics.org, Office for Research Development and Education, URL https://freestatistics.org/blog/index.php?pk=35893, Retrieved Sun, 19 May 2024 10:48:32 +0000
QR Codes:

Original text written by user:
IsPrivate?No (this computation is public)
User-defined keywords
Estimated Impact125
Family? (F = Feedback message, R = changed R code, M = changed R Module, P = changed Parameters, D = changed Data)
-       [(Partial) Autocorrelation Function] [fdsq] [2008-12-21 22:35:44] [7a2afff08a618fdf6611a1bb6e1c3da4] [Current]
Feedback Forum

Post a new message
Dataseries X:
130.3
130.9
104.7
115.2
124.5
112.3
127.5
120.6
117.5
117.7
120.4
125
131.6
121.1
114.2
112.1
127
116.8
112
129.7
113.6
115.7
119.5
125.8
129.6
128
112.8
101.6
123.9
118.8
109.1
130.6
112.4
111
116.2
119.8
117.2
127.3
107.7
97.5
120.1
110.6
111.3
119.8
105.5
108.7
128.7
119.5
121.1
128.4
108.8
107.5
125.6
102.9
107.5
120.4
104.3
100.6
121.9
112.7
124.9
123.9
102.2
104.9
109.8
98.9
107.3
112.6
104
110.6
100.8
103.8
117
108.4
95.5
96.9
103.9
101.1
100.6
104.3
98
99.5
97.4
105.6
117.5
107.4
97.8
91.5
107.7
100.1
96.6
106.8
98
98.6


Summary of computational transaction
Raw Inputview raw input (R code)
Raw Outputview raw output of R engine
Computing time1 seconds
R Server'Gwilym Jenkins' @ 72.249.127.135

\begin{tabular}{lllllllll}
\hline
Summary of computational transaction \tabularnewline
Raw Input & view raw input (R code)  \tabularnewline
Raw Output & view raw output of R engine  \tabularnewline
Computing time & 1 seconds \tabularnewline
R Server & 'Gwilym Jenkins' @ 72.249.127.135 \tabularnewline
\hline
\end{tabular}
%Source: https://freestatistics.org/blog/index.php?pk=35893&T=0

[TABLE]
[ROW][C]Summary of computational transaction[/C][/ROW]
[ROW][C]Raw Input[/C][C]view raw input (R code) [/C][/ROW]
[ROW][C]Raw Output[/C][C]view raw output of R engine [/C][/ROW]
[ROW][C]Computing time[/C][C]1 seconds[/C][/ROW]
[ROW][C]R Server[/C][C]'Gwilym Jenkins' @ 72.249.127.135[/C][/ROW]
[/TABLE]
Source: https://freestatistics.org/blog/index.php?pk=35893&T=0

Globally Unique Identifier (entire table): ba.freestatistics.org/blog/index.php?pk=35893&T=0

As an alternative you can also use a QR Code:  

The GUIDs for individual cells are displayed in the table below:

Summary of computational transaction
Raw Inputview raw input (R code)
Raw Outputview raw output of R engine
Computing time1 seconds
R Server'Gwilym Jenkins' @ 72.249.127.135


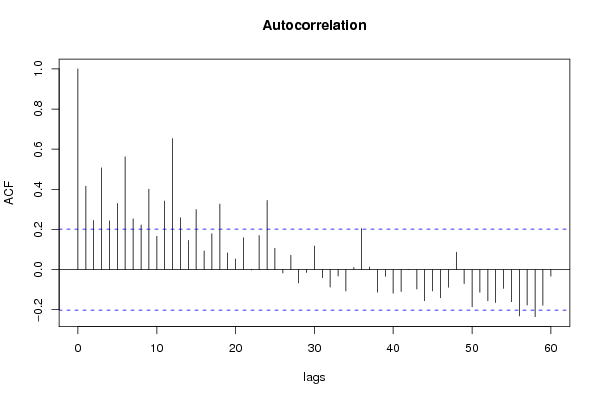
Autocorrelation Function
Time lag kACF(k)T-STATP-value
10.4158674.0325.6e-05
20.2449522.37490.009793
30.5069494.91512e-06
40.2430852.35680.010254
50.3298233.19770.000944
60.5622415.45110
70.2533672.45650.007933
80.2223982.15620.016809
90.4009133.8879.5e-05
100.1662291.61160.055196
110.3414023.310.000662
120.6530996.3320
130.2589352.51050.006883
140.1454771.41040.080854
150.299222.9010.002316
160.0927190.89890.185489
170.1790321.73580.042939
180.3263983.16450.001047
190.0832780.80740.210734
200.0524150.50820.306258
210.1584011.53580.063979
22-0.001667-0.01620.493571
230.1693911.64230.051934
240.3446423.34140.000599
250.1058221.0260.153767
26-0.016911-0.1640.435058
270.0719110.69720.243699
28-0.066523-0.6450.260261
29-0.014015-0.13590.446102
300.1174131.13840.128931
31-0.040573-0.39340.34747
32-0.086854-0.84210.200941
33-0.031599-0.30640.380003
34-0.106375-1.03130.152514
350.0106270.1030.45908
360.2052031.98950.024775
370.0126310.12250.451399
38-0.112795-1.09360.138466
39-0.033707-0.32680.37227
40-0.117597-1.14010.128562
41-0.109276-1.05950.146051
420.0015380.01490.494068
43-0.097122-0.94160.174398
44-0.155131-1.5040.067961
45-0.106447-1.0320.15235
46-0.140721-1.36430.087858
47-0.087833-0.85160.198307
480.0865350.8390.201803
49-0.069501-0.67380.251033
50-0.185457-1.79810.037688
51-0.11248-1.09050.139134
52-0.155903-1.51150.067003
53-0.16465-1.59630.056885
54-0.094273-0.9140.181525
55-0.160062-1.55190.062028
56-0.230869-2.23840.013779
57-0.177051-1.71660.044675
58-0.234581-2.27430.01261
59-0.178127-1.7270.043726
60-0.032836-0.31840.375461

\begin{tabular}{lllllllll}
\hline
Autocorrelation Function \tabularnewline
Time lag k & ACF(k) & T-STAT & P-value \tabularnewline
1 & 0.415867 & 4.032 & 5.6e-05 \tabularnewline
2 & 0.244952 & 2.3749 & 0.009793 \tabularnewline
3 & 0.506949 & 4.9151 & 2e-06 \tabularnewline
4 & 0.243085 & 2.3568 & 0.010254 \tabularnewline
5 & 0.329823 & 3.1977 & 0.000944 \tabularnewline
6 & 0.562241 & 5.4511 & 0 \tabularnewline
7 & 0.253367 & 2.4565 & 0.007933 \tabularnewline
8 & 0.222398 & 2.1562 & 0.016809 \tabularnewline
9 & 0.400913 & 3.887 & 9.5e-05 \tabularnewline
10 & 0.166229 & 1.6116 & 0.055196 \tabularnewline
11 & 0.341402 & 3.31 & 0.000662 \tabularnewline
12 & 0.653099 & 6.332 & 0 \tabularnewline
13 & 0.258935 & 2.5105 & 0.006883 \tabularnewline
14 & 0.145477 & 1.4104 & 0.080854 \tabularnewline
15 & 0.29922 & 2.901 & 0.002316 \tabularnewline
16 & 0.092719 & 0.8989 & 0.185489 \tabularnewline
17 & 0.179032 & 1.7358 & 0.042939 \tabularnewline
18 & 0.326398 & 3.1645 & 0.001047 \tabularnewline
19 & 0.083278 & 0.8074 & 0.210734 \tabularnewline
20 & 0.052415 & 0.5082 & 0.306258 \tabularnewline
21 & 0.158401 & 1.5358 & 0.063979 \tabularnewline
22 & -0.001667 & -0.0162 & 0.493571 \tabularnewline
23 & 0.169391 & 1.6423 & 0.051934 \tabularnewline
24 & 0.344642 & 3.3414 & 0.000599 \tabularnewline
25 & 0.105822 & 1.026 & 0.153767 \tabularnewline
26 & -0.016911 & -0.164 & 0.435058 \tabularnewline
27 & 0.071911 & 0.6972 & 0.243699 \tabularnewline
28 & -0.066523 & -0.645 & 0.260261 \tabularnewline
29 & -0.014015 & -0.1359 & 0.446102 \tabularnewline
30 & 0.117413 & 1.1384 & 0.128931 \tabularnewline
31 & -0.040573 & -0.3934 & 0.34747 \tabularnewline
32 & -0.086854 & -0.8421 & 0.200941 \tabularnewline
33 & -0.031599 & -0.3064 & 0.380003 \tabularnewline
34 & -0.106375 & -1.0313 & 0.152514 \tabularnewline
35 & 0.010627 & 0.103 & 0.45908 \tabularnewline
36 & 0.205203 & 1.9895 & 0.024775 \tabularnewline
37 & 0.012631 & 0.1225 & 0.451399 \tabularnewline
38 & -0.112795 & -1.0936 & 0.138466 \tabularnewline
39 & -0.033707 & -0.3268 & 0.37227 \tabularnewline
40 & -0.117597 & -1.1401 & 0.128562 \tabularnewline
41 & -0.109276 & -1.0595 & 0.146051 \tabularnewline
42 & 0.001538 & 0.0149 & 0.494068 \tabularnewline
43 & -0.097122 & -0.9416 & 0.174398 \tabularnewline
44 & -0.155131 & -1.504 & 0.067961 \tabularnewline
45 & -0.106447 & -1.032 & 0.15235 \tabularnewline
46 & -0.140721 & -1.3643 & 0.087858 \tabularnewline
47 & -0.087833 & -0.8516 & 0.198307 \tabularnewline
48 & 0.086535 & 0.839 & 0.201803 \tabularnewline
49 & -0.069501 & -0.6738 & 0.251033 \tabularnewline
50 & -0.185457 & -1.7981 & 0.037688 \tabularnewline
51 & -0.11248 & -1.0905 & 0.139134 \tabularnewline
52 & -0.155903 & -1.5115 & 0.067003 \tabularnewline
53 & -0.16465 & -1.5963 & 0.056885 \tabularnewline
54 & -0.094273 & -0.914 & 0.181525 \tabularnewline
55 & -0.160062 & -1.5519 & 0.062028 \tabularnewline
56 & -0.230869 & -2.2384 & 0.013779 \tabularnewline
57 & -0.177051 & -1.7166 & 0.044675 \tabularnewline
58 & -0.234581 & -2.2743 & 0.01261 \tabularnewline
59 & -0.178127 & -1.727 & 0.043726 \tabularnewline
60 & -0.032836 & -0.3184 & 0.375461 \tabularnewline
\hline
\end{tabular}
%Source: https://freestatistics.org/blog/index.php?pk=35893&T=1

[TABLE]
[ROW][C]Autocorrelation Function[/C][/ROW]
[ROW][C]Time lag k[/C][C]ACF(k)[/C][C]T-STAT[/C][C]P-value[/C][/ROW]
[ROW][C]1[/C][C]0.415867[/C][C]4.032[/C][C]5.6e-05[/C][/ROW]
[ROW][C]2[/C][C]0.244952[/C][C]2.3749[/C][C]0.009793[/C][/ROW]
[ROW][C]3[/C][C]0.506949[/C][C]4.9151[/C][C]2e-06[/C][/ROW]
[ROW][C]4[/C][C]0.243085[/C][C]2.3568[/C][C]0.010254[/C][/ROW]
[ROW][C]5[/C][C]0.329823[/C][C]3.1977[/C][C]0.000944[/C][/ROW]
[ROW][C]6[/C][C]0.562241[/C][C]5.4511[/C][C]0[/C][/ROW]
[ROW][C]7[/C][C]0.253367[/C][C]2.4565[/C][C]0.007933[/C][/ROW]
[ROW][C]8[/C][C]0.222398[/C][C]2.1562[/C][C]0.016809[/C][/ROW]
[ROW][C]9[/C][C]0.400913[/C][C]3.887[/C][C]9.5e-05[/C][/ROW]
[ROW][C]10[/C][C]0.166229[/C][C]1.6116[/C][C]0.055196[/C][/ROW]
[ROW][C]11[/C][C]0.341402[/C][C]3.31[/C][C]0.000662[/C][/ROW]
[ROW][C]12[/C][C]0.653099[/C][C]6.332[/C][C]0[/C][/ROW]
[ROW][C]13[/C][C]0.258935[/C][C]2.5105[/C][C]0.006883[/C][/ROW]
[ROW][C]14[/C][C]0.145477[/C][C]1.4104[/C][C]0.080854[/C][/ROW]
[ROW][C]15[/C][C]0.29922[/C][C]2.901[/C][C]0.002316[/C][/ROW]
[ROW][C]16[/C][C]0.092719[/C][C]0.8989[/C][C]0.185489[/C][/ROW]
[ROW][C]17[/C][C]0.179032[/C][C]1.7358[/C][C]0.042939[/C][/ROW]
[ROW][C]18[/C][C]0.326398[/C][C]3.1645[/C][C]0.001047[/C][/ROW]
[ROW][C]19[/C][C]0.083278[/C][C]0.8074[/C][C]0.210734[/C][/ROW]
[ROW][C]20[/C][C]0.052415[/C][C]0.5082[/C][C]0.306258[/C][/ROW]
[ROW][C]21[/C][C]0.158401[/C][C]1.5358[/C][C]0.063979[/C][/ROW]
[ROW][C]22[/C][C]-0.001667[/C][C]-0.0162[/C][C]0.493571[/C][/ROW]
[ROW][C]23[/C][C]0.169391[/C][C]1.6423[/C][C]0.051934[/C][/ROW]
[ROW][C]24[/C][C]0.344642[/C][C]3.3414[/C][C]0.000599[/C][/ROW]
[ROW][C]25[/C][C]0.105822[/C][C]1.026[/C][C]0.153767[/C][/ROW]
[ROW][C]26[/C][C]-0.016911[/C][C]-0.164[/C][C]0.435058[/C][/ROW]
[ROW][C]27[/C][C]0.071911[/C][C]0.6972[/C][C]0.243699[/C][/ROW]
[ROW][C]28[/C][C]-0.066523[/C][C]-0.645[/C][C]0.260261[/C][/ROW]
[ROW][C]29[/C][C]-0.014015[/C][C]-0.1359[/C][C]0.446102[/C][/ROW]
[ROW][C]30[/C][C]0.117413[/C][C]1.1384[/C][C]0.128931[/C][/ROW]
[ROW][C]31[/C][C]-0.040573[/C][C]-0.3934[/C][C]0.34747[/C][/ROW]
[ROW][C]32[/C][C]-0.086854[/C][C]-0.8421[/C][C]0.200941[/C][/ROW]
[ROW][C]33[/C][C]-0.031599[/C][C]-0.3064[/C][C]0.380003[/C][/ROW]
[ROW][C]34[/C][C]-0.106375[/C][C]-1.0313[/C][C]0.152514[/C][/ROW]
[ROW][C]35[/C][C]0.010627[/C][C]0.103[/C][C]0.45908[/C][/ROW]
[ROW][C]36[/C][C]0.205203[/C][C]1.9895[/C][C]0.024775[/C][/ROW]
[ROW][C]37[/C][C]0.012631[/C][C]0.1225[/C][C]0.451399[/C][/ROW]
[ROW][C]38[/C][C]-0.112795[/C][C]-1.0936[/C][C]0.138466[/C][/ROW]
[ROW][C]39[/C][C]-0.033707[/C][C]-0.3268[/C][C]0.37227[/C][/ROW]
[ROW][C]40[/C][C]-0.117597[/C][C]-1.1401[/C][C]0.128562[/C][/ROW]
[ROW][C]41[/C][C]-0.109276[/C][C]-1.0595[/C][C]0.146051[/C][/ROW]
[ROW][C]42[/C][C]0.001538[/C][C]0.0149[/C][C]0.494068[/C][/ROW]
[ROW][C]43[/C][C]-0.097122[/C][C]-0.9416[/C][C]0.174398[/C][/ROW]
[ROW][C]44[/C][C]-0.155131[/C][C]-1.504[/C][C]0.067961[/C][/ROW]
[ROW][C]45[/C][C]-0.106447[/C][C]-1.032[/C][C]0.15235[/C][/ROW]
[ROW][C]46[/C][C]-0.140721[/C][C]-1.3643[/C][C]0.087858[/C][/ROW]
[ROW][C]47[/C][C]-0.087833[/C][C]-0.8516[/C][C]0.198307[/C][/ROW]
[ROW][C]48[/C][C]0.086535[/C][C]0.839[/C][C]0.201803[/C][/ROW]
[ROW][C]49[/C][C]-0.069501[/C][C]-0.6738[/C][C]0.251033[/C][/ROW]
[ROW][C]50[/C][C]-0.185457[/C][C]-1.7981[/C][C]0.037688[/C][/ROW]
[ROW][C]51[/C][C]-0.11248[/C][C]-1.0905[/C][C]0.139134[/C][/ROW]
[ROW][C]52[/C][C]-0.155903[/C][C]-1.5115[/C][C]0.067003[/C][/ROW]
[ROW][C]53[/C][C]-0.16465[/C][C]-1.5963[/C][C]0.056885[/C][/ROW]
[ROW][C]54[/C][C]-0.094273[/C][C]-0.914[/C][C]0.181525[/C][/ROW]
[ROW][C]55[/C][C]-0.160062[/C][C]-1.5519[/C][C]0.062028[/C][/ROW]
[ROW][C]56[/C][C]-0.230869[/C][C]-2.2384[/C][C]0.013779[/C][/ROW]
[ROW][C]57[/C][C]-0.177051[/C][C]-1.7166[/C][C]0.044675[/C][/ROW]
[ROW][C]58[/C][C]-0.234581[/C][C]-2.2743[/C][C]0.01261[/C][/ROW]
[ROW][C]59[/C][C]-0.178127[/C][C]-1.727[/C][C]0.043726[/C][/ROW]
[ROW][C]60[/C][C]-0.032836[/C][C]-0.3184[/C][C]0.375461[/C][/ROW]
[/TABLE]
Source: https://freestatistics.org/blog/index.php?pk=35893&T=1

Globally Unique Identifier (entire table): ba.freestatistics.org/blog/index.php?pk=35893&T=1

As an alternative you can also use a QR Code:  

The GUIDs for individual cells are displayed in the table below:

Autocorrelation Function
Time lag kACF(k)T-STATP-value
10.4158674.0325.6e-05
20.2449522.37490.009793
30.5069494.91512e-06
40.2430852.35680.010254
50.3298233.19770.000944
60.5622415.45110
70.2533672.45650.007933
80.2223982.15620.016809
90.4009133.8879.5e-05
100.1662291.61160.055196
110.3414023.310.000662
120.6530996.3320
130.2589352.51050.006883
140.1454771.41040.080854
150.299222.9010.002316
160.0927190.89890.185489
170.1790321.73580.042939
180.3263983.16450.001047
190.0832780.80740.210734
200.0524150.50820.306258
210.1584011.53580.063979
22-0.001667-0.01620.493571
230.1693911.64230.051934
240.3446423.34140.000599
250.1058221.0260.153767
26-0.016911-0.1640.435058
270.0719110.69720.243699
28-0.066523-0.6450.260261
29-0.014015-0.13590.446102
300.1174131.13840.128931
31-0.040573-0.39340.34747
32-0.086854-0.84210.200941
33-0.031599-0.30640.380003
34-0.106375-1.03130.152514
350.0106270.1030.45908
360.2052031.98950.024775
370.0126310.12250.451399
38-0.112795-1.09360.138466
39-0.033707-0.32680.37227
40-0.117597-1.14010.128562
41-0.109276-1.05950.146051
420.0015380.01490.494068
43-0.097122-0.94160.174398
44-0.155131-1.5040.067961
45-0.106447-1.0320.15235
46-0.140721-1.36430.087858
47-0.087833-0.85160.198307
480.0865350.8390.201803
49-0.069501-0.67380.251033
50-0.185457-1.79810.037688
51-0.11248-1.09050.139134
52-0.155903-1.51150.067003
53-0.16465-1.59630.056885
54-0.094273-0.9140.181525
55-0.160062-1.55190.062028
56-0.230869-2.23840.013779
57-0.177051-1.71660.044675
58-0.234581-2.27430.01261
59-0.178127-1.7270.043726
60-0.032836-0.31840.375461


Partial Autocorrelation Function
Time lag kPACF(k)T-STATP-value
10.4158674.0325.6e-05
20.0870640.84410.200374
30.4602224.4621.1e-05
4-0.153009-1.48350.070646
50.3475313.36940.000547
60.2299062.2290.014097
7-0.061442-0.59570.276404
8-0.008483-0.08220.467312
90.064750.62780.265836
10-0.10813-1.04840.14858
110.2790212.70520.004053
120.373053.61690.000241
13-0.112377-1.08950.139352
14-0.208718-2.02360.022926
15-0.180988-1.75470.041281
16-0.114043-1.10570.135842
17-0.099979-0.96930.167434
18-0.082995-0.80470.211521
190.0352570.34180.36662
20-0.062151-0.60260.274121
21-0.017206-0.16680.433937
22-0.043712-0.42380.336337
230.0879660.85290.197953
240.0021930.02130.491541
250.1453861.40960.080984
26-0.147207-1.42720.078414
270.0312380.30290.381333
28-0.167639-1.62530.053721
29-0.017405-0.16870.433179
30-0.043521-0.42190.337013
310.1197451.1610.124297
320.0091430.08860.464778
330.024840.24080.405105
34-0.021558-0.2090.417446
350.0009650.00940.496276
360.1460821.41630.079994
37-0.019276-0.18690.426076
380.0148940.14440.442745
39-0.041673-0.4040.343551
400.0123630.11990.452424
41-0.103398-1.00250.159341
42-0.106922-1.03660.151279
430.0110650.10730.457399
44-0.003687-0.03570.485782
450.0470380.4560.324703
46-0.020589-0.19960.421104
47-0.052726-0.51120.305206
48-0.086606-0.83970.201611
49-0.086939-0.84290.20071
50-0.038919-0.37730.353388
51-0.003851-0.03730.485146
520.0743880.72120.236283
530.0208590.20220.420084
54-0.062797-0.60880.272051
55-0.068354-0.66270.254568
56-0.058875-0.57080.284744
57-0.020206-0.19590.422555
58-0.095012-0.92120.179658
590.0093010.09020.464169
600.0012710.01230.495098

\begin{tabular}{lllllllll}
\hline
Partial Autocorrelation Function \tabularnewline
Time lag k & PACF(k) & T-STAT & P-value \tabularnewline
1 & 0.415867 & 4.032 & 5.6e-05 \tabularnewline
2 & 0.087064 & 0.8441 & 0.200374 \tabularnewline
3 & 0.460222 & 4.462 & 1.1e-05 \tabularnewline
4 & -0.153009 & -1.4835 & 0.070646 \tabularnewline
5 & 0.347531 & 3.3694 & 0.000547 \tabularnewline
6 & 0.229906 & 2.229 & 0.014097 \tabularnewline
7 & -0.061442 & -0.5957 & 0.276404 \tabularnewline
8 & -0.008483 & -0.0822 & 0.467312 \tabularnewline
9 & 0.06475 & 0.6278 & 0.265836 \tabularnewline
10 & -0.10813 & -1.0484 & 0.14858 \tabularnewline
11 & 0.279021 & 2.7052 & 0.004053 \tabularnewline
12 & 0.37305 & 3.6169 & 0.000241 \tabularnewline
13 & -0.112377 & -1.0895 & 0.139352 \tabularnewline
14 & -0.208718 & -2.0236 & 0.022926 \tabularnewline
15 & -0.180988 & -1.7547 & 0.041281 \tabularnewline
16 & -0.114043 & -1.1057 & 0.135842 \tabularnewline
17 & -0.099979 & -0.9693 & 0.167434 \tabularnewline
18 & -0.082995 & -0.8047 & 0.211521 \tabularnewline
19 & 0.035257 & 0.3418 & 0.36662 \tabularnewline
20 & -0.062151 & -0.6026 & 0.274121 \tabularnewline
21 & -0.017206 & -0.1668 & 0.433937 \tabularnewline
22 & -0.043712 & -0.4238 & 0.336337 \tabularnewline
23 & 0.087966 & 0.8529 & 0.197953 \tabularnewline
24 & 0.002193 & 0.0213 & 0.491541 \tabularnewline
25 & 0.145386 & 1.4096 & 0.080984 \tabularnewline
26 & -0.147207 & -1.4272 & 0.078414 \tabularnewline
27 & 0.031238 & 0.3029 & 0.381333 \tabularnewline
28 & -0.167639 & -1.6253 & 0.053721 \tabularnewline
29 & -0.017405 & -0.1687 & 0.433179 \tabularnewline
30 & -0.043521 & -0.4219 & 0.337013 \tabularnewline
31 & 0.119745 & 1.161 & 0.124297 \tabularnewline
32 & 0.009143 & 0.0886 & 0.464778 \tabularnewline
33 & 0.02484 & 0.2408 & 0.405105 \tabularnewline
34 & -0.021558 & -0.209 & 0.417446 \tabularnewline
35 & 0.000965 & 0.0094 & 0.496276 \tabularnewline
36 & 0.146082 & 1.4163 & 0.079994 \tabularnewline
37 & -0.019276 & -0.1869 & 0.426076 \tabularnewline
38 & 0.014894 & 0.1444 & 0.442745 \tabularnewline
39 & -0.041673 & -0.404 & 0.343551 \tabularnewline
40 & 0.012363 & 0.1199 & 0.452424 \tabularnewline
41 & -0.103398 & -1.0025 & 0.159341 \tabularnewline
42 & -0.106922 & -1.0366 & 0.151279 \tabularnewline
43 & 0.011065 & 0.1073 & 0.457399 \tabularnewline
44 & -0.003687 & -0.0357 & 0.485782 \tabularnewline
45 & 0.047038 & 0.456 & 0.324703 \tabularnewline
46 & -0.020589 & -0.1996 & 0.421104 \tabularnewline
47 & -0.052726 & -0.5112 & 0.305206 \tabularnewline
48 & -0.086606 & -0.8397 & 0.201611 \tabularnewline
49 & -0.086939 & -0.8429 & 0.20071 \tabularnewline
50 & -0.038919 & -0.3773 & 0.353388 \tabularnewline
51 & -0.003851 & -0.0373 & 0.485146 \tabularnewline
52 & 0.074388 & 0.7212 & 0.236283 \tabularnewline
53 & 0.020859 & 0.2022 & 0.420084 \tabularnewline
54 & -0.062797 & -0.6088 & 0.272051 \tabularnewline
55 & -0.068354 & -0.6627 & 0.254568 \tabularnewline
56 & -0.058875 & -0.5708 & 0.284744 \tabularnewline
57 & -0.020206 & -0.1959 & 0.422555 \tabularnewline
58 & -0.095012 & -0.9212 & 0.179658 \tabularnewline
59 & 0.009301 & 0.0902 & 0.464169 \tabularnewline
60 & 0.001271 & 0.0123 & 0.495098 \tabularnewline
\hline
\end{tabular}
%Source: https://freestatistics.org/blog/index.php?pk=35893&T=2

[TABLE]
[ROW][C]Partial Autocorrelation Function[/C][/ROW]
[ROW][C]Time lag k[/C][C]PACF(k)[/C][C]T-STAT[/C][C]P-value[/C][/ROW]
[ROW][C]1[/C][C]0.415867[/C][C]4.032[/C][C]5.6e-05[/C][/ROW]
[ROW][C]2[/C][C]0.087064[/C][C]0.8441[/C][C]0.200374[/C][/ROW]
[ROW][C]3[/C][C]0.460222[/C][C]4.462[/C][C]1.1e-05[/C][/ROW]
[ROW][C]4[/C][C]-0.153009[/C][C]-1.4835[/C][C]0.070646[/C][/ROW]
[ROW][C]5[/C][C]0.347531[/C][C]3.3694[/C][C]0.000547[/C][/ROW]
[ROW][C]6[/C][C]0.229906[/C][C]2.229[/C][C]0.014097[/C][/ROW]
[ROW][C]7[/C][C]-0.061442[/C][C]-0.5957[/C][C]0.276404[/C][/ROW]
[ROW][C]8[/C][C]-0.008483[/C][C]-0.0822[/C][C]0.467312[/C][/ROW]
[ROW][C]9[/C][C]0.06475[/C][C]0.6278[/C][C]0.265836[/C][/ROW]
[ROW][C]10[/C][C]-0.10813[/C][C]-1.0484[/C][C]0.14858[/C][/ROW]
[ROW][C]11[/C][C]0.279021[/C][C]2.7052[/C][C]0.004053[/C][/ROW]
[ROW][C]12[/C][C]0.37305[/C][C]3.6169[/C][C]0.000241[/C][/ROW]
[ROW][C]13[/C][C]-0.112377[/C][C]-1.0895[/C][C]0.139352[/C][/ROW]
[ROW][C]14[/C][C]-0.208718[/C][C]-2.0236[/C][C]0.022926[/C][/ROW]
[ROW][C]15[/C][C]-0.180988[/C][C]-1.7547[/C][C]0.041281[/C][/ROW]
[ROW][C]16[/C][C]-0.114043[/C][C]-1.1057[/C][C]0.135842[/C][/ROW]
[ROW][C]17[/C][C]-0.099979[/C][C]-0.9693[/C][C]0.167434[/C][/ROW]
[ROW][C]18[/C][C]-0.082995[/C][C]-0.8047[/C][C]0.211521[/C][/ROW]
[ROW][C]19[/C][C]0.035257[/C][C]0.3418[/C][C]0.36662[/C][/ROW]
[ROW][C]20[/C][C]-0.062151[/C][C]-0.6026[/C][C]0.274121[/C][/ROW]
[ROW][C]21[/C][C]-0.017206[/C][C]-0.1668[/C][C]0.433937[/C][/ROW]
[ROW][C]22[/C][C]-0.043712[/C][C]-0.4238[/C][C]0.336337[/C][/ROW]
[ROW][C]23[/C][C]0.087966[/C][C]0.8529[/C][C]0.197953[/C][/ROW]
[ROW][C]24[/C][C]0.002193[/C][C]0.0213[/C][C]0.491541[/C][/ROW]
[ROW][C]25[/C][C]0.145386[/C][C]1.4096[/C][C]0.080984[/C][/ROW]
[ROW][C]26[/C][C]-0.147207[/C][C]-1.4272[/C][C]0.078414[/C][/ROW]
[ROW][C]27[/C][C]0.031238[/C][C]0.3029[/C][C]0.381333[/C][/ROW]
[ROW][C]28[/C][C]-0.167639[/C][C]-1.6253[/C][C]0.053721[/C][/ROW]
[ROW][C]29[/C][C]-0.017405[/C][C]-0.1687[/C][C]0.433179[/C][/ROW]
[ROW][C]30[/C][C]-0.043521[/C][C]-0.4219[/C][C]0.337013[/C][/ROW]
[ROW][C]31[/C][C]0.119745[/C][C]1.161[/C][C]0.124297[/C][/ROW]
[ROW][C]32[/C][C]0.009143[/C][C]0.0886[/C][C]0.464778[/C][/ROW]
[ROW][C]33[/C][C]0.02484[/C][C]0.2408[/C][C]0.405105[/C][/ROW]
[ROW][C]34[/C][C]-0.021558[/C][C]-0.209[/C][C]0.417446[/C][/ROW]
[ROW][C]35[/C][C]0.000965[/C][C]0.0094[/C][C]0.496276[/C][/ROW]
[ROW][C]36[/C][C]0.146082[/C][C]1.4163[/C][C]0.079994[/C][/ROW]
[ROW][C]37[/C][C]-0.019276[/C][C]-0.1869[/C][C]0.426076[/C][/ROW]
[ROW][C]38[/C][C]0.014894[/C][C]0.1444[/C][C]0.442745[/C][/ROW]
[ROW][C]39[/C][C]-0.041673[/C][C]-0.404[/C][C]0.343551[/C][/ROW]
[ROW][C]40[/C][C]0.012363[/C][C]0.1199[/C][C]0.452424[/C][/ROW]
[ROW][C]41[/C][C]-0.103398[/C][C]-1.0025[/C][C]0.159341[/C][/ROW]
[ROW][C]42[/C][C]-0.106922[/C][C]-1.0366[/C][C]0.151279[/C][/ROW]
[ROW][C]43[/C][C]0.011065[/C][C]0.1073[/C][C]0.457399[/C][/ROW]
[ROW][C]44[/C][C]-0.003687[/C][C]-0.0357[/C][C]0.485782[/C][/ROW]
[ROW][C]45[/C][C]0.047038[/C][C]0.456[/C][C]0.324703[/C][/ROW]
[ROW][C]46[/C][C]-0.020589[/C][C]-0.1996[/C][C]0.421104[/C][/ROW]
[ROW][C]47[/C][C]-0.052726[/C][C]-0.5112[/C][C]0.305206[/C][/ROW]
[ROW][C]48[/C][C]-0.086606[/C][C]-0.8397[/C][C]0.201611[/C][/ROW]
[ROW][C]49[/C][C]-0.086939[/C][C]-0.8429[/C][C]0.20071[/C][/ROW]
[ROW][C]50[/C][C]-0.038919[/C][C]-0.3773[/C][C]0.353388[/C][/ROW]
[ROW][C]51[/C][C]-0.003851[/C][C]-0.0373[/C][C]0.485146[/C][/ROW]
[ROW][C]52[/C][C]0.074388[/C][C]0.7212[/C][C]0.236283[/C][/ROW]
[ROW][C]53[/C][C]0.020859[/C][C]0.2022[/C][C]0.420084[/C][/ROW]
[ROW][C]54[/C][C]-0.062797[/C][C]-0.6088[/C][C]0.272051[/C][/ROW]
[ROW][C]55[/C][C]-0.068354[/C][C]-0.6627[/C][C]0.254568[/C][/ROW]
[ROW][C]56[/C][C]-0.058875[/C][C]-0.5708[/C][C]0.284744[/C][/ROW]
[ROW][C]57[/C][C]-0.020206[/C][C]-0.1959[/C][C]0.422555[/C][/ROW]
[ROW][C]58[/C][C]-0.095012[/C][C]-0.9212[/C][C]0.179658[/C][/ROW]
[ROW][C]59[/C][C]0.009301[/C][C]0.0902[/C][C]0.464169[/C][/ROW]
[ROW][C]60[/C][C]0.001271[/C][C]0.0123[/C][C]0.495098[/C][/ROW]
[/TABLE]
Source: https://freestatistics.org/blog/index.php?pk=35893&T=2

Globally Unique Identifier (entire table): ba.freestatistics.org/blog/index.php?pk=35893&T=2

As an alternative you can also use a QR Code:  

The GUIDs for individual cells are displayed in the table below:

Partial Autocorrelation Function
Time lag kPACF(k)T-STATP-value
10.4158674.0325.6e-05
20.0870640.84410.200374
30.4602224.4621.1e-05
4-0.153009-1.48350.070646
50.3475313.36940.000547
60.2299062.2290.014097
7-0.061442-0.59570.276404
8-0.008483-0.08220.467312
90.064750.62780.265836
10-0.10813-1.04840.14858
110.2790212.70520.004053
120.373053.61690.000241
13-0.112377-1.08950.139352
14-0.208718-2.02360.022926
15-0.180988-1.75470.041281
16-0.114043-1.10570.135842
17-0.099979-0.96930.167434
18-0.082995-0.80470.211521
190.0352570.34180.36662
20-0.062151-0.60260.274121
21-0.017206-0.16680.433937
22-0.043712-0.42380.336337
230.0879660.85290.197953
240.0021930.02130.491541
250.1453861.40960.080984
26-0.147207-1.42720.078414
270.0312380.30290.381333
28-0.167639-1.62530.053721
29-0.017405-0.16870.433179
30-0.043521-0.42190.337013
310.1197451.1610.124297
320.0091430.08860.464778
330.024840.24080.405105
34-0.021558-0.2090.417446
350.0009650.00940.496276
360.1460821.41630.079994
37-0.019276-0.18690.426076
380.0148940.14440.442745
39-0.041673-0.4040.343551
400.0123630.11990.452424
41-0.103398-1.00250.159341
42-0.106922-1.03660.151279
430.0110650.10730.457399
44-0.003687-0.03570.485782
450.0470380.4560.324703
46-0.020589-0.19960.421104
47-0.052726-0.51120.305206
48-0.086606-0.83970.201611
49-0.086939-0.84290.20071
50-0.038919-0.37730.353388
51-0.003851-0.03730.485146
520.0743880.72120.236283
530.0208590.20220.420084
54-0.062797-0.60880.272051
55-0.068354-0.66270.254568
56-0.058875-0.57080.284744
57-0.020206-0.19590.422555
58-0.095012-0.92120.179658
590.0093010.09020.464169
600.0012710.01230.495098


Parameters (Session):
par1 = 60 ; par2 = 1 ; par3 = 0 ; par4 = 0 ; par5 = 12 ;
Parameters (R input):
par1 = 60 ; par2 = 1 ; par3 = 0 ; par4 = 0 ; par5 = 12 ;
R code (references can be found in the software module):
if (par1 == 'Default') {
par1 = 10*log10(length(x))
} else {
par1 <- as.numeric(par1)
}
par2 <- as.numeric(par2)
par3 <- as.numeric(par3)
par4 <- as.numeric(par4)
par5 <- as.numeric(par5)
if (par2 == 0) {
x <- log(x)
} else {
x <- (x ^ par2 - 1) / par2
}
if (par3 > 0) x <- diff(x,lag=1,difference=par3)
if (par4 > 0) x <- diff(x,lag=par5,difference=par4)
bitmap(file='pic1.png')
racf <- acf(x,par1,main='Autocorrelation',xlab='lags',ylab='ACF')
dev.off()
bitmap(file='pic2.png')
rpacf <- pacf(x,par1,main='Partial Autocorrelation',xlab='lags',ylab='PACF')
dev.off()
(myacf <- c(racf$acf))
(mypacf <- c(rpacf$acf))
lengthx <- length(x)
sqrtn <- sqrt(lengthx)
load(file='createtable')
a<-table.start()
a<-table.row.start(a)
a<-table.element(a,'Autocorrelation Function',4,TRUE)
a<-table.row.end(a)
a<-table.row.start(a)
a<-table.element(a,'Time lag k',header=TRUE)
a<-table.element(a,hyperlink('basics.htm','ACF(k)','click here for more information about the Autocorrelation Function'),header=TRUE)
a<-table.element(a,'T-STAT',header=TRUE)
a<-table.element(a,'P-value',header=TRUE)
a<-table.row.end(a)
for (i in 2:(par1+1)) {
a<-table.row.start(a)
a<-table.element(a,i-1,header=TRUE)
a<-table.element(a,round(myacf[i],6))
mytstat <- myacf[i]*sqrtn
a<-table.element(a,round(mytstat,4))
a<-table.element(a,round(1-pt(abs(mytstat),lengthx),6))
a<-table.row.end(a)
}
a<-table.end(a)
table.save(a,file='mytable.tab')
a<-table.start()
a<-table.row.start(a)
a<-table.element(a,'Partial Autocorrelation Function',4,TRUE)
a<-table.row.end(a)
a<-table.row.start(a)
a<-table.element(a,'Time lag k',header=TRUE)
a<-table.element(a,hyperlink('basics.htm','PACF(k)','click here for more information about the Partial Autocorrelation Function'),header=TRUE)
a<-table.element(a,'T-STAT',header=TRUE)
a<-table.element(a,'P-value',header=TRUE)
a<-table.row.end(a)
for (i in 1:par1) {
a<-table.row.start(a)
a<-table.element(a,i,header=TRUE)
a<-table.element(a,round(mypacf[i],6))
mytstat <- mypacf[i]*sqrtn
a<-table.element(a,round(mytstat,4))
a<-table.element(a,round(1-pt(abs(mytstat),lengthx),6))
a<-table.row.end(a)
}
a<-table.end(a)
table.save(a,file='mytable1.tab')