Free Statistics

of Irreproducible Research!

Author's title

Author*Unverified author*
R Software Modulerwasp_autocorrelation.wasp
Title produced by software(Partial) Autocorrelation Function
Date of computationSun, 21 Dec 2008 15:34:36 -0700
Cite this page as followsStatistical Computations at FreeStatistics.org, Office for Research Development and Education, URL https://freestatistics.org/blog/index.php?v=date/2008/Dec/21/t1229898894b6fed7uukqobexc.htm/, Retrieved Sun, 19 May 2024 08:51:04 +0000
Statistical Computations at FreeStatistics.org, Office for Research Development and Education, URL https://freestatistics.org/blog/index.php?pk=35892, Retrieved Sun, 19 May 2024 08:51:04 +0000
QR Codes:

Original text written by user:
IsPrivate?No (this computation is public)
User-defined keywords
Estimated Impact129
Family? (F = Feedback message, R = changed R code, M = changed R Module, P = changed Parameters, D = changed Data)
-       [(Partial) Autocorrelation Function] [fsqd] [2008-12-21 22:34:36] [7a2afff08a618fdf6611a1bb6e1c3da4] [Current]
Feedback Forum

Post a new message
Dataseries X:
130.3
130.9
104.7
115.2
124.5
112.3
127.5
120.6
117.5
117.7
120.4
125
131.6
121.1
114.2
112.1
127
116.8
112
129.7
113.6
115.7
119.5
125.8
129.6
128
112.8
101.6
123.9
118.8
109.1
130.6
112.4
111
116.2
119.8
117.2
127.3
107.7
97.5
120.1
110.6
111.3
119.8
105.5
108.7
128.7
119.5
121.1
128.4
108.8
107.5
125.6
102.9
107.5
120.4
104.3
100.6
121.9
112.7
124.9
123.9
102.2
104.9
109.8
98.9
107.3
112.6
104
110.6
100.8
103.8
117
108.4
95.5
96.9
103.9
101.1
100.6
104.3
98
99.5
97.4
105.6
117.5
107.4
97.8
91.5
107.7
100.1
96.6
106.8
98
98.6


Summary of computational transaction
Raw Inputview raw input (R code)
Raw Outputview raw output of R engine
Computing time1 seconds
R Server'George Udny Yule' @ 72.249.76.132

\begin{tabular}{lllllllll}
\hline
Summary of computational transaction \tabularnewline
Raw Input & view raw input (R code)  \tabularnewline
Raw Output & view raw output of R engine  \tabularnewline
Computing time & 1 seconds \tabularnewline
R Server & 'George Udny Yule' @ 72.249.76.132 \tabularnewline
\hline
\end{tabular}
%Source: https://freestatistics.org/blog/index.php?pk=35892&T=0

[TABLE]
[ROW][C]Summary of computational transaction[/C][/ROW]
[ROW][C]Raw Input[/C][C]view raw input (R code) [/C][/ROW]
[ROW][C]Raw Output[/C][C]view raw output of R engine [/C][/ROW]
[ROW][C]Computing time[/C][C]1 seconds[/C][/ROW]
[ROW][C]R Server[/C][C]'George Udny Yule' @ 72.249.76.132[/C][/ROW]
[/TABLE]
Source: https://freestatistics.org/blog/index.php?pk=35892&T=0

Globally Unique Identifier (entire table): ba.freestatistics.org/blog/index.php?pk=35892&T=0

As an alternative you can also use a QR Code:  

The GUIDs for individual cells are displayed in the table below:

Summary of computational transaction
Raw Inputview raw input (R code)
Raw Outputview raw output of R engine
Computing time1 seconds
R Server'George Udny Yule' @ 72.249.76.132


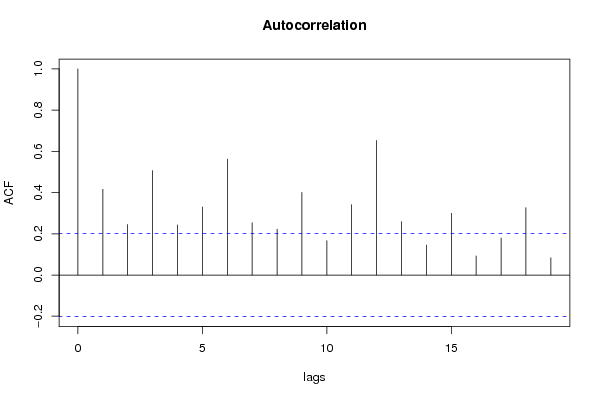
Autocorrelation Function
Time lag kACF(k)T-STATP-value
10.4158674.0325.6e-05
20.2449522.37490.009793
30.5069494.91512e-06
40.2430852.35680.010254
50.3298233.19770.000944
60.5622415.45110
70.2533672.45650.007933
80.2223982.15620.016809
90.4009133.8879.5e-05
100.1662291.61160.055196
110.3414023.310.000662
120.6530996.3320
130.2589352.51050.006883
140.1454771.41040.080854
150.299222.9010.002316
160.0927190.89890.185489
170.1790321.73580.042939
180.3263983.16450.001047
190.0832780.80740.210734

\begin{tabular}{lllllllll}
\hline
Autocorrelation Function \tabularnewline
Time lag k & ACF(k) & T-STAT & P-value \tabularnewline
1 & 0.415867 & 4.032 & 5.6e-05 \tabularnewline
2 & 0.244952 & 2.3749 & 0.009793 \tabularnewline
3 & 0.506949 & 4.9151 & 2e-06 \tabularnewline
4 & 0.243085 & 2.3568 & 0.010254 \tabularnewline
5 & 0.329823 & 3.1977 & 0.000944 \tabularnewline
6 & 0.562241 & 5.4511 & 0 \tabularnewline
7 & 0.253367 & 2.4565 & 0.007933 \tabularnewline
8 & 0.222398 & 2.1562 & 0.016809 \tabularnewline
9 & 0.400913 & 3.887 & 9.5e-05 \tabularnewline
10 & 0.166229 & 1.6116 & 0.055196 \tabularnewline
11 & 0.341402 & 3.31 & 0.000662 \tabularnewline
12 & 0.653099 & 6.332 & 0 \tabularnewline
13 & 0.258935 & 2.5105 & 0.006883 \tabularnewline
14 & 0.145477 & 1.4104 & 0.080854 \tabularnewline
15 & 0.29922 & 2.901 & 0.002316 \tabularnewline
16 & 0.092719 & 0.8989 & 0.185489 \tabularnewline
17 & 0.179032 & 1.7358 & 0.042939 \tabularnewline
18 & 0.326398 & 3.1645 & 0.001047 \tabularnewline
19 & 0.083278 & 0.8074 & 0.210734 \tabularnewline
\hline
\end{tabular}
%Source: https://freestatistics.org/blog/index.php?pk=35892&T=1

[TABLE]
[ROW][C]Autocorrelation Function[/C][/ROW]
[ROW][C]Time lag k[/C][C]ACF(k)[/C][C]T-STAT[/C][C]P-value[/C][/ROW]
[ROW][C]1[/C][C]0.415867[/C][C]4.032[/C][C]5.6e-05[/C][/ROW]
[ROW][C]2[/C][C]0.244952[/C][C]2.3749[/C][C]0.009793[/C][/ROW]
[ROW][C]3[/C][C]0.506949[/C][C]4.9151[/C][C]2e-06[/C][/ROW]
[ROW][C]4[/C][C]0.243085[/C][C]2.3568[/C][C]0.010254[/C][/ROW]
[ROW][C]5[/C][C]0.329823[/C][C]3.1977[/C][C]0.000944[/C][/ROW]
[ROW][C]6[/C][C]0.562241[/C][C]5.4511[/C][C]0[/C][/ROW]
[ROW][C]7[/C][C]0.253367[/C][C]2.4565[/C][C]0.007933[/C][/ROW]
[ROW][C]8[/C][C]0.222398[/C][C]2.1562[/C][C]0.016809[/C][/ROW]
[ROW][C]9[/C][C]0.400913[/C][C]3.887[/C][C]9.5e-05[/C][/ROW]
[ROW][C]10[/C][C]0.166229[/C][C]1.6116[/C][C]0.055196[/C][/ROW]
[ROW][C]11[/C][C]0.341402[/C][C]3.31[/C][C]0.000662[/C][/ROW]
[ROW][C]12[/C][C]0.653099[/C][C]6.332[/C][C]0[/C][/ROW]
[ROW][C]13[/C][C]0.258935[/C][C]2.5105[/C][C]0.006883[/C][/ROW]
[ROW][C]14[/C][C]0.145477[/C][C]1.4104[/C][C]0.080854[/C][/ROW]
[ROW][C]15[/C][C]0.29922[/C][C]2.901[/C][C]0.002316[/C][/ROW]
[ROW][C]16[/C][C]0.092719[/C][C]0.8989[/C][C]0.185489[/C][/ROW]
[ROW][C]17[/C][C]0.179032[/C][C]1.7358[/C][C]0.042939[/C][/ROW]
[ROW][C]18[/C][C]0.326398[/C][C]3.1645[/C][C]0.001047[/C][/ROW]
[ROW][C]19[/C][C]0.083278[/C][C]0.8074[/C][C]0.210734[/C][/ROW]
[/TABLE]
Source: https://freestatistics.org/blog/index.php?pk=35892&T=1

Globally Unique Identifier (entire table): ba.freestatistics.org/blog/index.php?pk=35892&T=1

As an alternative you can also use a QR Code:  

The GUIDs for individual cells are displayed in the table below:

Autocorrelation Function
Time lag kACF(k)T-STATP-value
10.4158674.0325.6e-05
20.2449522.37490.009793
30.5069494.91512e-06
40.2430852.35680.010254
50.3298233.19770.000944
60.5622415.45110
70.2533672.45650.007933
80.2223982.15620.016809
90.4009133.8879.5e-05
100.1662291.61160.055196
110.3414023.310.000662
120.6530996.3320
130.2589352.51050.006883
140.1454771.41040.080854
150.299222.9010.002316
160.0927190.89890.185489
170.1790321.73580.042939
180.3263983.16450.001047
190.0832780.80740.210734


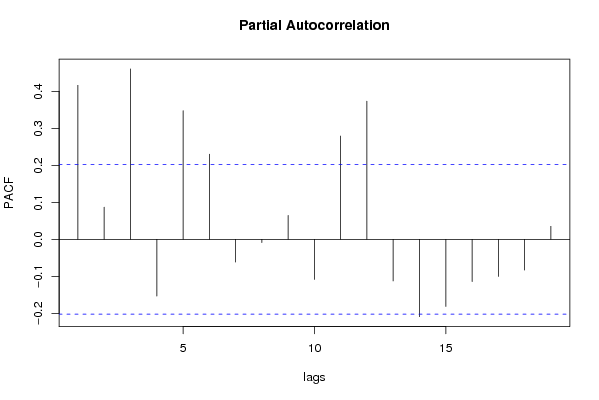
Partial Autocorrelation Function
Time lag kPACF(k)T-STATP-value
10.4158674.0325.6e-05
20.0870640.84410.200374
30.4602224.4621.1e-05
4-0.153009-1.48350.070646
50.3475313.36940.000547
60.2299062.2290.014097
7-0.061442-0.59570.276404
8-0.008483-0.08220.467312
90.064750.62780.265836
10-0.10813-1.04840.14858
110.2790212.70520.004053
120.373053.61690.000241
13-0.112377-1.08950.139352
14-0.208718-2.02360.022926
15-0.180988-1.75470.041281
16-0.114043-1.10570.135842
17-0.099979-0.96930.167434
18-0.082995-0.80470.211521
190.0352570.34180.36662

\begin{tabular}{lllllllll}
\hline
Partial Autocorrelation Function \tabularnewline
Time lag k & PACF(k) & T-STAT & P-value \tabularnewline
1 & 0.415867 & 4.032 & 5.6e-05 \tabularnewline
2 & 0.087064 & 0.8441 & 0.200374 \tabularnewline
3 & 0.460222 & 4.462 & 1.1e-05 \tabularnewline
4 & -0.153009 & -1.4835 & 0.070646 \tabularnewline
5 & 0.347531 & 3.3694 & 0.000547 \tabularnewline
6 & 0.229906 & 2.229 & 0.014097 \tabularnewline
7 & -0.061442 & -0.5957 & 0.276404 \tabularnewline
8 & -0.008483 & -0.0822 & 0.467312 \tabularnewline
9 & 0.06475 & 0.6278 & 0.265836 \tabularnewline
10 & -0.10813 & -1.0484 & 0.14858 \tabularnewline
11 & 0.279021 & 2.7052 & 0.004053 \tabularnewline
12 & 0.37305 & 3.6169 & 0.000241 \tabularnewline
13 & -0.112377 & -1.0895 & 0.139352 \tabularnewline
14 & -0.208718 & -2.0236 & 0.022926 \tabularnewline
15 & -0.180988 & -1.7547 & 0.041281 \tabularnewline
16 & -0.114043 & -1.1057 & 0.135842 \tabularnewline
17 & -0.099979 & -0.9693 & 0.167434 \tabularnewline
18 & -0.082995 & -0.8047 & 0.211521 \tabularnewline
19 & 0.035257 & 0.3418 & 0.36662 \tabularnewline
\hline
\end{tabular}
%Source: https://freestatistics.org/blog/index.php?pk=35892&T=2

[TABLE]
[ROW][C]Partial Autocorrelation Function[/C][/ROW]
[ROW][C]Time lag k[/C][C]PACF(k)[/C][C]T-STAT[/C][C]P-value[/C][/ROW]
[ROW][C]1[/C][C]0.415867[/C][C]4.032[/C][C]5.6e-05[/C][/ROW]
[ROW][C]2[/C][C]0.087064[/C][C]0.8441[/C][C]0.200374[/C][/ROW]
[ROW][C]3[/C][C]0.460222[/C][C]4.462[/C][C]1.1e-05[/C][/ROW]
[ROW][C]4[/C][C]-0.153009[/C][C]-1.4835[/C][C]0.070646[/C][/ROW]
[ROW][C]5[/C][C]0.347531[/C][C]3.3694[/C][C]0.000547[/C][/ROW]
[ROW][C]6[/C][C]0.229906[/C][C]2.229[/C][C]0.014097[/C][/ROW]
[ROW][C]7[/C][C]-0.061442[/C][C]-0.5957[/C][C]0.276404[/C][/ROW]
[ROW][C]8[/C][C]-0.008483[/C][C]-0.0822[/C][C]0.467312[/C][/ROW]
[ROW][C]9[/C][C]0.06475[/C][C]0.6278[/C][C]0.265836[/C][/ROW]
[ROW][C]10[/C][C]-0.10813[/C][C]-1.0484[/C][C]0.14858[/C][/ROW]
[ROW][C]11[/C][C]0.279021[/C][C]2.7052[/C][C]0.004053[/C][/ROW]
[ROW][C]12[/C][C]0.37305[/C][C]3.6169[/C][C]0.000241[/C][/ROW]
[ROW][C]13[/C][C]-0.112377[/C][C]-1.0895[/C][C]0.139352[/C][/ROW]
[ROW][C]14[/C][C]-0.208718[/C][C]-2.0236[/C][C]0.022926[/C][/ROW]
[ROW][C]15[/C][C]-0.180988[/C][C]-1.7547[/C][C]0.041281[/C][/ROW]
[ROW][C]16[/C][C]-0.114043[/C][C]-1.1057[/C][C]0.135842[/C][/ROW]
[ROW][C]17[/C][C]-0.099979[/C][C]-0.9693[/C][C]0.167434[/C][/ROW]
[ROW][C]18[/C][C]-0.082995[/C][C]-0.8047[/C][C]0.211521[/C][/ROW]
[ROW][C]19[/C][C]0.035257[/C][C]0.3418[/C][C]0.36662[/C][/ROW]
[/TABLE]
Source: https://freestatistics.org/blog/index.php?pk=35892&T=2

Globally Unique Identifier (entire table): ba.freestatistics.org/blog/index.php?pk=35892&T=2

As an alternative you can also use a QR Code:  

The GUIDs for individual cells are displayed in the table below:

Partial Autocorrelation Function
Time lag kPACF(k)T-STATP-value
10.4158674.0325.6e-05
20.0870640.84410.200374
30.4602224.4621.1e-05
4-0.153009-1.48350.070646
50.3475313.36940.000547
60.2299062.2290.014097
7-0.061442-0.59570.276404
8-0.008483-0.08220.467312
90.064750.62780.265836
10-0.10813-1.04840.14858
110.2790212.70520.004053
120.373053.61690.000241
13-0.112377-1.08950.139352
14-0.208718-2.02360.022926
15-0.180988-1.75470.041281
16-0.114043-1.10570.135842
17-0.099979-0.96930.167434
18-0.082995-0.80470.211521
190.0352570.34180.36662


Parameters (Session):
par1 = Default ; par2 = 1 ; par3 = 0 ; par4 = 0 ; par5 = 12 ;
Parameters (R input):
par1 = Default ; par2 = 1 ; par3 = 0 ; par4 = 0 ; par5 = 12 ;
R code (references can be found in the software module):
if (par1 == 'Default') {
par1 = 10*log10(length(x))
} else {
par1 <- as.numeric(par1)
}
par2 <- as.numeric(par2)
par3 <- as.numeric(par3)
par4 <- as.numeric(par4)
par5 <- as.numeric(par5)
if (par2 == 0) {
x <- log(x)
} else {
x <- (x ^ par2 - 1) / par2
}
if (par3 > 0) x <- diff(x,lag=1,difference=par3)
if (par4 > 0) x <- diff(x,lag=par5,difference=par4)
bitmap(file='pic1.png')
racf <- acf(x,par1,main='Autocorrelation',xlab='lags',ylab='ACF')
dev.off()
bitmap(file='pic2.png')
rpacf <- pacf(x,par1,main='Partial Autocorrelation',xlab='lags',ylab='PACF')
dev.off()
(myacf <- c(racf$acf))
(mypacf <- c(rpacf$acf))
lengthx <- length(x)
sqrtn <- sqrt(lengthx)
load(file='createtable')
a<-table.start()
a<-table.row.start(a)
a<-table.element(a,'Autocorrelation Function',4,TRUE)
a<-table.row.end(a)
a<-table.row.start(a)
a<-table.element(a,'Time lag k',header=TRUE)
a<-table.element(a,hyperlink('basics.htm','ACF(k)','click here for more information about the Autocorrelation Function'),header=TRUE)
a<-table.element(a,'T-STAT',header=TRUE)
a<-table.element(a,'P-value',header=TRUE)
a<-table.row.end(a)
for (i in 2:(par1+1)) {
a<-table.row.start(a)
a<-table.element(a,i-1,header=TRUE)
a<-table.element(a,round(myacf[i],6))
mytstat <- myacf[i]*sqrtn
a<-table.element(a,round(mytstat,4))
a<-table.element(a,round(1-pt(abs(mytstat),lengthx),6))
a<-table.row.end(a)
}
a<-table.end(a)
table.save(a,file='mytable.tab')
a<-table.start()
a<-table.row.start(a)
a<-table.element(a,'Partial Autocorrelation Function',4,TRUE)
a<-table.row.end(a)
a<-table.row.start(a)
a<-table.element(a,'Time lag k',header=TRUE)
a<-table.element(a,hyperlink('basics.htm','PACF(k)','click here for more information about the Partial Autocorrelation Function'),header=TRUE)
a<-table.element(a,'T-STAT',header=TRUE)
a<-table.element(a,'P-value',header=TRUE)
a<-table.row.end(a)
for (i in 1:par1) {
a<-table.row.start(a)
a<-table.element(a,i,header=TRUE)
a<-table.element(a,round(mypacf[i],6))
mytstat <- mypacf[i]*sqrtn
a<-table.element(a,round(mytstat,4))
a<-table.element(a,round(1-pt(abs(mytstat),lengthx),6))
a<-table.row.end(a)
}
a<-table.end(a)
table.save(a,file='mytable1.tab')