Free Statistics

of Irreproducible Research!

Author's title

Author*Unverified author*
R Software Modulerwasp_pairs.wasp
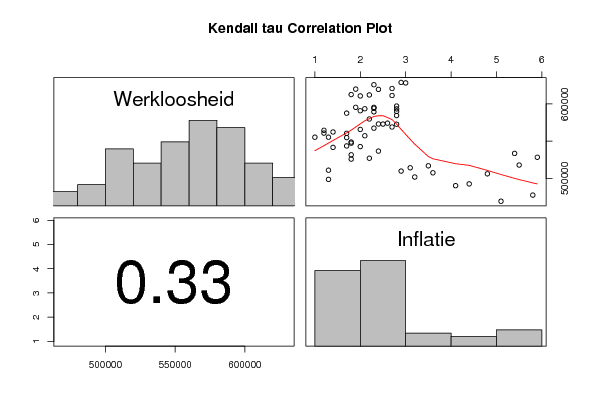
Title produced by softwareKendall tau Correlation Matrix
Date of computationSun, 21 Dec 2008 13:44:43 -0700
Cite this page as followsStatistical Computations at FreeStatistics.org, Office for Research Development and Education, URL https://freestatistics.org/blog/index.php?v=date/2008/Dec/21/t1229892873jedonthk8dax3oe.htm/, Retrieved Sun, 19 May 2024 10:51:15 +0000
Statistical Computations at FreeStatistics.org, Office for Research Development and Education, URL https://freestatistics.org/blog/index.php?pk=35826, Retrieved Sun, 19 May 2024 10:51:15 +0000
QR Codes:

Original text written by user:
IsPrivate?No (this computation is public)
User-defined keywords
Estimated Impact138
Family? (F = Feedback message, R = changed R code, M = changed R Module, P = changed Parameters, D = changed Data)
F       [Kendall tau Correlation Matrix] [] [2008-12-21 20:44:43] [d41d8cd98f00b204e9800998ecf8427e] [Current]
Feedback Forum
2009-01-08 14:03:16 [Aurélie Van Impe] [reply
Je uitleg is nogal kort. Je had ter verduidelijking de tabel erbij kunnen zetten. Je had ook kunnen verwijzen naar de diagonaal die je zou moeten zien tussen de bolletjes in de rechter bovenhoek. Het is niet echt een diagonaal dat je ziet, dus er is geen echt verband tussen de twee variabelen. Je had ook nog iets kunnen zeggen over de histogrammen. Ze verschillen enorm van elkaar, waardoor het logisch is dat je geen verband ziet. Als de gegevens ongeveer eenzelfde histogram zouden hebben, da zou je een duidelijk verband merken. Je moet dan echter wel opletten dat er extreem veel tijdreeksen bestaan met bijvoorbeeld een normaalverdeling, en dat je zo verbanden zou kunnen suggereren die er eigenlijk geen zijn. Maar hier is dat niet het geval. Er is duidelijk geen verband.

Post a new message
Dataseries X:
547344	1,8
554788	1,7
562325	1,4
560854	1,2
555332	1
543599	1,7
536662	2,4
542722	2
593530	2,1
610763	2
612613	1,8
611324	2,7
594167	2,3
595454	1,9
590865	2
589379	2,3
584428	2,8
573100	2,4
567456	2,3
569028	2,7
620735	2,7
628884	2,9
628232	3
612117	2,2
595404	2,3
597141	2,8
593408	2,8
590072	2,8
579799	2,2
574205	2,6
572775	2,8
572942	2,5
619567	2,4
625809	2,3
619916	1,9
587625	1,7
565742	2
557274	2,1
560576	1,7
548854	1,8
531673	1,8
525919	1,8
511038	1,3
498662	1,3
555362	1,3
564591	1,2
541657	1,4
527070	2,2
509846	2,9
514258	3,1
516922	3,5
507561	3,6
492622	4,4
490243	4,1
469357	5,1
477580	5,8
528379	5,9
533590	5,4
517945	5,5
506174	4,8
501866	3,2


Summary of computational transaction
Raw Inputview raw input (R code)
Raw Outputview raw output of R engine
Computing time1 seconds
R Server'George Udny Yule' @ 72.249.76.132

\begin{tabular}{lllllllll}
\hline
Summary of computational transaction \tabularnewline
Raw Input & view raw input (R code)  \tabularnewline
Raw Output & view raw output of R engine  \tabularnewline
Computing time & 1 seconds \tabularnewline
R Server & 'George Udny Yule' @ 72.249.76.132 \tabularnewline
\hline
\end{tabular}
%Source: https://freestatistics.org/blog/index.php?pk=35826&T=0

[TABLE]
[ROW][C]Summary of computational transaction[/C][/ROW]
[ROW][C]Raw Input[/C][C]view raw input (R code) [/C][/ROW]
[ROW][C]Raw Output[/C][C]view raw output of R engine [/C][/ROW]
[ROW][C]Computing time[/C][C]1 seconds[/C][/ROW]
[ROW][C]R Server[/C][C]'George Udny Yule' @ 72.249.76.132[/C][/ROW]
[/TABLE]
Source: https://freestatistics.org/blog/index.php?pk=35826&T=0

Globally Unique Identifier (entire table): ba.freestatistics.org/blog/index.php?pk=35826&T=0

As an alternative you can also use a QR Code:  

The GUIDs for individual cells are displayed in the table below:

Summary of computational transaction
Raw Inputview raw input (R code)
Raw Outputview raw output of R engine
Computing time1 seconds
R Server'George Udny Yule' @ 72.249.76.132


Kendall tau rank correlations for all pairs of data series
pairtaup-value
tau( Werkloosheid , Inflatie )-0.0860987552318990.333953764412314

\begin{tabular}{lllllllll}
\hline
Kendall tau rank correlations for all pairs of data series \tabularnewline
pair & tau & p-value \tabularnewline
tau( Werkloosheid , Inflatie ) & -0.086098755231899 & 0.333953764412314 \tabularnewline
\hline
\end{tabular}
%Source: https://freestatistics.org/blog/index.php?pk=35826&T=1

[TABLE]
[ROW][C]Kendall tau rank correlations for all pairs of data series[/C][/ROW]
[ROW][C]pair[/C][C]tau[/C][C]p-value[/C][/ROW]
[ROW][C]tau( Werkloosheid , Inflatie )[/C][C]-0.086098755231899[/C][C]0.333953764412314[/C][/ROW]
[/TABLE]
Source: https://freestatistics.org/blog/index.php?pk=35826&T=1

Globally Unique Identifier (entire table): ba.freestatistics.org/blog/index.php?pk=35826&T=1

As an alternative you can also use a QR Code:  

The GUIDs for individual cells are displayed in the table below:

Kendall tau rank correlations for all pairs of data series
pairtaup-value
tau( Werkloosheid , Inflatie )-0.0860987552318990.333953764412314


Parameters (Session):
Parameters (R input):
R code (references can be found in the software module):
panel.tau <- function(x, y, digits=2, prefix='', cex.cor)
{
usr <- par('usr'); on.exit(par(usr))
par(usr = c(0, 1, 0, 1))
rr <- cor.test(x, y, method='kendall')
r <- round(rr$p.value,2)
txt <- format(c(r, 0.123456789), digits=digits)[1]
txt <- paste(prefix, txt, sep='')
if(missing(cex.cor)) cex <- 0.5/strwidth(txt)
text(0.5, 0.5, txt, cex = cex)
}
panel.hist <- function(x, ...)
{
usr <- par('usr'); on.exit(par(usr))
par(usr = c(usr[1:2], 0, 1.5) )
h <- hist(x, plot = FALSE)
breaks <- h$breaks; nB <- length(breaks)
y <- h$counts; y <- y/max(y)
rect(breaks[-nB], 0, breaks[-1], y, col='grey', ...)
}
bitmap(file='test1.png')
pairs(t(y),diag.panel=panel.hist, upper.panel=panel.smooth, lower.panel=panel.tau, main=main)
dev.off()
load(file='createtable')
a<-table.start()
a<-table.row.start(a)
a<-table.element(a,'Kendall tau rank correlations for all pairs of data series',3,TRUE)
a<-table.row.end(a)
a<-table.row.start(a)
a<-table.element(a,'pair',1,TRUE)
a<-table.element(a,'tau',1,TRUE)
a<-table.element(a,'p-value',1,TRUE)
a<-table.row.end(a)
n <- length(y[,1])
n
cor.test(y[1,],y[2,],method='kendall')
for (i in 1:(n-1))
{
for (j in (i+1):n)
{
a<-table.row.start(a)
dum <- paste('tau(',dimnames(t(x))[[2]][i])
dum <- paste(dum,',')
dum <- paste(dum,dimnames(t(x))[[2]][j])
dum <- paste(dum,')')
a<-table.element(a,dum,header=TRUE)
r <- cor.test(y[i,],y[j,],method='kendall')
a<-table.element(a,r$estimate)
a<-table.element(a,r$p.value)
a<-table.row.end(a)
}
}
a<-table.end(a)
table.save(a,file='mytable.tab')