Free Statistics

of Irreproducible Research!

Author's title

Author*The author of this computation has been verified*
R Software Modulerwasp_autocorrelation.wasp
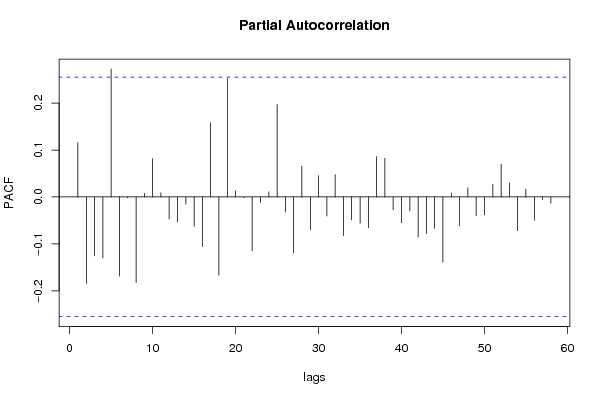
Title produced by software(Partial) Autocorrelation Function
Date of computationSun, 21 Dec 2008 12:55:13 -0700
Cite this page as followsStatistical Computations at FreeStatistics.org, Office for Research Development and Education, URL https://freestatistics.org/blog/index.php?v=date/2008/Dec/21/t12298893529647gbgxdd8236y.htm/, Retrieved Sun, 19 May 2024 10:46:35 +0000
Statistical Computations at FreeStatistics.org, Office for Research Development and Education, URL https://freestatistics.org/blog/index.php?pk=35790, Retrieved Sun, 19 May 2024 10:46:35 +0000
QR Codes:

Original text written by user:
IsPrivate?No (this computation is public)
User-defined keywords
Estimated Impact192
Family? (F = Feedback message, R = changed R code, M = changed R Module, P = changed Parameters, D = changed Data)
-     [Standard Deviation-Mean Plot] [Paper - SMP] [2008-12-19 16:30:21] [23bfa928dab4b48567707937094f7011]
- RMP   [(Partial) Autocorrelation Function] [Paper - ACF ] [2008-12-19 19:43:42] [23bfa928dab4b48567707937094f7011]
-   PD    [(Partial) Autocorrelation Function] [Paper - ACF ] [2008-12-19 19:46:26] [23bfa928dab4b48567707937094f7011]
-   P         [(Partial) Autocorrelation Function] [Paper - ACF ] [2008-12-21 19:55:13] [63302faa1e3976bf98d1de42298c0b24] [Current]
Feedback Forum

Post a new message
Dataseries X:
90.8
96.4
90
92.1
97.2
95.1
88.5
91
90.5
75
66.3
66
68.4
70.6
83.9
90.1
90.6
87.1
90.8
94.1
99.8
96.8
87
96.3
107.1
115.2
106.1
89.5
91.3
97.6
100.7
104.6
94.7
101.8
102.5
105.3
110.3
109.8
117.3
118.8
131.3
125.9
133.1
147
145.8
164.4
149.8
137.7
151.7
156.8
180
180.4
170.4
191.6
199.5
218.2
217.5
205
194
199.3


Summary of computational transaction
Raw Inputview raw input (R code)
Raw Outputview raw output of R engine
Computing time1 seconds
R Server'Gwilym Jenkins' @ 72.249.127.135

\begin{tabular}{lllllllll}
\hline
Summary of computational transaction \tabularnewline
Raw Input & view raw input (R code)  \tabularnewline
Raw Output & view raw output of R engine  \tabularnewline
Computing time & 1 seconds \tabularnewline
R Server & 'Gwilym Jenkins' @ 72.249.127.135 \tabularnewline
\hline
\end{tabular}
%Source: https://freestatistics.org/blog/index.php?pk=35790&T=0

[TABLE]
[ROW][C]Summary of computational transaction[/C][/ROW]
[ROW][C]Raw Input[/C][C]view raw input (R code) [/C][/ROW]
[ROW][C]Raw Output[/C][C]view raw output of R engine [/C][/ROW]
[ROW][C]Computing time[/C][C]1 seconds[/C][/ROW]
[ROW][C]R Server[/C][C]'Gwilym Jenkins' @ 72.249.127.135[/C][/ROW]
[/TABLE]
Source: https://freestatistics.org/blog/index.php?pk=35790&T=0

Globally Unique Identifier (entire table): ba.freestatistics.org/blog/index.php?pk=35790&T=0

As an alternative you can also use a QR Code:  

The GUIDs for individual cells are displayed in the table below:

Summary of computational transaction
Raw Inputview raw input (R code)
Raw Outputview raw output of R engine
Computing time1 seconds
R Server'Gwilym Jenkins' @ 72.249.127.135


Autocorrelation Function
Time lag kACF(k)T-STATP-value
10.1158570.88990.188563
2-0.168235-1.29220.100657
3-0.164038-1.260.106315
4-0.127117-0.97640.166425
50.2736532.1020.019917
6-0.019664-0.1510.44023
7-0.085968-0.66030.255806
8-0.179091-1.37560.087069
9-0.095539-0.73380.232973
100.2219681.7050.04673
110.0645240.49560.311002
12-0.032336-0.24840.402352
13-0.143043-1.09870.138174
14-0.083325-0.640.262314
150.0643510.49430.311469
16-0.039221-0.30130.382137
170.1271010.97630.166455
18-0.126114-0.96870.168325
190.0797350.61250.271294
200.182051.39840.083621
21-0.052801-0.40560.343262
22-0.010695-0.08220.467402
23-0.184658-1.41840.08067
240.0438190.33660.368814
250.2167741.66510.0506
260.0124890.09590.461951
27-0.115254-0.88530.1898
28-0.127615-0.98020.165488
29-0.007749-0.05950.476369
300.1698261.30450.098572
310.0341550.26240.396982
32-0.069074-0.53060.298855
33-0.181421-1.39350.084345
34-0.083286-0.63970.262412
350.0642310.49340.311793
360.0734010.56380.287512
370.0541430.41590.339502
38-0.0256-0.19660.422395
39-0.010409-0.080.468271
40-0.040337-0.30980.378889
410.0250960.19280.423903
420.0052490.04030.483987
43-0.098257-0.75470.226708
44-0.097411-0.74820.228646
45-0.055193-0.42390.336574
46-0.036191-0.2780.390996
470.0317190.24360.404178
480.0210850.1620.435945
490.0484490.37210.355559
500.0109790.08430.46654
51-0.008963-0.06880.472672
520.0345050.2650.395952
53-0.020978-0.16110.436269
540.0028810.02210.49121
550.0155020.11910.452811
560.0072730.05590.477821
57-0.013174-0.10120.459872
580.0019410.01490.494078
59NANANA
60NANANA

\begin{tabular}{lllllllll}
\hline
Autocorrelation Function \tabularnewline
Time lag k & ACF(k) & T-STAT & P-value \tabularnewline
1 & 0.115857 & 0.8899 & 0.188563 \tabularnewline
2 & -0.168235 & -1.2922 & 0.100657 \tabularnewline
3 & -0.164038 & -1.26 & 0.106315 \tabularnewline
4 & -0.127117 & -0.9764 & 0.166425 \tabularnewline
5 & 0.273653 & 2.102 & 0.019917 \tabularnewline
6 & -0.019664 & -0.151 & 0.44023 \tabularnewline
7 & -0.085968 & -0.6603 & 0.255806 \tabularnewline
8 & -0.179091 & -1.3756 & 0.087069 \tabularnewline
9 & -0.095539 & -0.7338 & 0.232973 \tabularnewline
10 & 0.221968 & 1.705 & 0.04673 \tabularnewline
11 & 0.064524 & 0.4956 & 0.311002 \tabularnewline
12 & -0.032336 & -0.2484 & 0.402352 \tabularnewline
13 & -0.143043 & -1.0987 & 0.138174 \tabularnewline
14 & -0.083325 & -0.64 & 0.262314 \tabularnewline
15 & 0.064351 & 0.4943 & 0.311469 \tabularnewline
16 & -0.039221 & -0.3013 & 0.382137 \tabularnewline
17 & 0.127101 & 0.9763 & 0.166455 \tabularnewline
18 & -0.126114 & -0.9687 & 0.168325 \tabularnewline
19 & 0.079735 & 0.6125 & 0.271294 \tabularnewline
20 & 0.18205 & 1.3984 & 0.083621 \tabularnewline
21 & -0.052801 & -0.4056 & 0.343262 \tabularnewline
22 & -0.010695 & -0.0822 & 0.467402 \tabularnewline
23 & -0.184658 & -1.4184 & 0.08067 \tabularnewline
24 & 0.043819 & 0.3366 & 0.368814 \tabularnewline
25 & 0.216774 & 1.6651 & 0.0506 \tabularnewline
26 & 0.012489 & 0.0959 & 0.461951 \tabularnewline
27 & -0.115254 & -0.8853 & 0.1898 \tabularnewline
28 & -0.127615 & -0.9802 & 0.165488 \tabularnewline
29 & -0.007749 & -0.0595 & 0.476369 \tabularnewline
30 & 0.169826 & 1.3045 & 0.098572 \tabularnewline
31 & 0.034155 & 0.2624 & 0.396982 \tabularnewline
32 & -0.069074 & -0.5306 & 0.298855 \tabularnewline
33 & -0.181421 & -1.3935 & 0.084345 \tabularnewline
34 & -0.083286 & -0.6397 & 0.262412 \tabularnewline
35 & 0.064231 & 0.4934 & 0.311793 \tabularnewline
36 & 0.073401 & 0.5638 & 0.287512 \tabularnewline
37 & 0.054143 & 0.4159 & 0.339502 \tabularnewline
38 & -0.0256 & -0.1966 & 0.422395 \tabularnewline
39 & -0.010409 & -0.08 & 0.468271 \tabularnewline
40 & -0.040337 & -0.3098 & 0.378889 \tabularnewline
41 & 0.025096 & 0.1928 & 0.423903 \tabularnewline
42 & 0.005249 & 0.0403 & 0.483987 \tabularnewline
43 & -0.098257 & -0.7547 & 0.226708 \tabularnewline
44 & -0.097411 & -0.7482 & 0.228646 \tabularnewline
45 & -0.055193 & -0.4239 & 0.336574 \tabularnewline
46 & -0.036191 & -0.278 & 0.390996 \tabularnewline
47 & 0.031719 & 0.2436 & 0.404178 \tabularnewline
48 & 0.021085 & 0.162 & 0.435945 \tabularnewline
49 & 0.048449 & 0.3721 & 0.355559 \tabularnewline
50 & 0.010979 & 0.0843 & 0.46654 \tabularnewline
51 & -0.008963 & -0.0688 & 0.472672 \tabularnewline
52 & 0.034505 & 0.265 & 0.395952 \tabularnewline
53 & -0.020978 & -0.1611 & 0.436269 \tabularnewline
54 & 0.002881 & 0.0221 & 0.49121 \tabularnewline
55 & 0.015502 & 0.1191 & 0.452811 \tabularnewline
56 & 0.007273 & 0.0559 & 0.477821 \tabularnewline
57 & -0.013174 & -0.1012 & 0.459872 \tabularnewline
58 & 0.001941 & 0.0149 & 0.494078 \tabularnewline
59 & NA & NA & NA \tabularnewline
60 & NA & NA & NA \tabularnewline
\hline
\end{tabular}
%Source: https://freestatistics.org/blog/index.php?pk=35790&T=1

[TABLE]
[ROW][C]Autocorrelation Function[/C][/ROW]
[ROW][C]Time lag k[/C][C]ACF(k)[/C][C]T-STAT[/C][C]P-value[/C][/ROW]
[ROW][C]1[/C][C]0.115857[/C][C]0.8899[/C][C]0.188563[/C][/ROW]
[ROW][C]2[/C][C]-0.168235[/C][C]-1.2922[/C][C]0.100657[/C][/ROW]
[ROW][C]3[/C][C]-0.164038[/C][C]-1.26[/C][C]0.106315[/C][/ROW]
[ROW][C]4[/C][C]-0.127117[/C][C]-0.9764[/C][C]0.166425[/C][/ROW]
[ROW][C]5[/C][C]0.273653[/C][C]2.102[/C][C]0.019917[/C][/ROW]
[ROW][C]6[/C][C]-0.019664[/C][C]-0.151[/C][C]0.44023[/C][/ROW]
[ROW][C]7[/C][C]-0.085968[/C][C]-0.6603[/C][C]0.255806[/C][/ROW]
[ROW][C]8[/C][C]-0.179091[/C][C]-1.3756[/C][C]0.087069[/C][/ROW]
[ROW][C]9[/C][C]-0.095539[/C][C]-0.7338[/C][C]0.232973[/C][/ROW]
[ROW][C]10[/C][C]0.221968[/C][C]1.705[/C][C]0.04673[/C][/ROW]
[ROW][C]11[/C][C]0.064524[/C][C]0.4956[/C][C]0.311002[/C][/ROW]
[ROW][C]12[/C][C]-0.032336[/C][C]-0.2484[/C][C]0.402352[/C][/ROW]
[ROW][C]13[/C][C]-0.143043[/C][C]-1.0987[/C][C]0.138174[/C][/ROW]
[ROW][C]14[/C][C]-0.083325[/C][C]-0.64[/C][C]0.262314[/C][/ROW]
[ROW][C]15[/C][C]0.064351[/C][C]0.4943[/C][C]0.311469[/C][/ROW]
[ROW][C]16[/C][C]-0.039221[/C][C]-0.3013[/C][C]0.382137[/C][/ROW]
[ROW][C]17[/C][C]0.127101[/C][C]0.9763[/C][C]0.166455[/C][/ROW]
[ROW][C]18[/C][C]-0.126114[/C][C]-0.9687[/C][C]0.168325[/C][/ROW]
[ROW][C]19[/C][C]0.079735[/C][C]0.6125[/C][C]0.271294[/C][/ROW]
[ROW][C]20[/C][C]0.18205[/C][C]1.3984[/C][C]0.083621[/C][/ROW]
[ROW][C]21[/C][C]-0.052801[/C][C]-0.4056[/C][C]0.343262[/C][/ROW]
[ROW][C]22[/C][C]-0.010695[/C][C]-0.0822[/C][C]0.467402[/C][/ROW]
[ROW][C]23[/C][C]-0.184658[/C][C]-1.4184[/C][C]0.08067[/C][/ROW]
[ROW][C]24[/C][C]0.043819[/C][C]0.3366[/C][C]0.368814[/C][/ROW]
[ROW][C]25[/C][C]0.216774[/C][C]1.6651[/C][C]0.0506[/C][/ROW]
[ROW][C]26[/C][C]0.012489[/C][C]0.0959[/C][C]0.461951[/C][/ROW]
[ROW][C]27[/C][C]-0.115254[/C][C]-0.8853[/C][C]0.1898[/C][/ROW]
[ROW][C]28[/C][C]-0.127615[/C][C]-0.9802[/C][C]0.165488[/C][/ROW]
[ROW][C]29[/C][C]-0.007749[/C][C]-0.0595[/C][C]0.476369[/C][/ROW]
[ROW][C]30[/C][C]0.169826[/C][C]1.3045[/C][C]0.098572[/C][/ROW]
[ROW][C]31[/C][C]0.034155[/C][C]0.2624[/C][C]0.396982[/C][/ROW]
[ROW][C]32[/C][C]-0.069074[/C][C]-0.5306[/C][C]0.298855[/C][/ROW]
[ROW][C]33[/C][C]-0.181421[/C][C]-1.3935[/C][C]0.084345[/C][/ROW]
[ROW][C]34[/C][C]-0.083286[/C][C]-0.6397[/C][C]0.262412[/C][/ROW]
[ROW][C]35[/C][C]0.064231[/C][C]0.4934[/C][C]0.311793[/C][/ROW]
[ROW][C]36[/C][C]0.073401[/C][C]0.5638[/C][C]0.287512[/C][/ROW]
[ROW][C]37[/C][C]0.054143[/C][C]0.4159[/C][C]0.339502[/C][/ROW]
[ROW][C]38[/C][C]-0.0256[/C][C]-0.1966[/C][C]0.422395[/C][/ROW]
[ROW][C]39[/C][C]-0.010409[/C][C]-0.08[/C][C]0.468271[/C][/ROW]
[ROW][C]40[/C][C]-0.040337[/C][C]-0.3098[/C][C]0.378889[/C][/ROW]
[ROW][C]41[/C][C]0.025096[/C][C]0.1928[/C][C]0.423903[/C][/ROW]
[ROW][C]42[/C][C]0.005249[/C][C]0.0403[/C][C]0.483987[/C][/ROW]
[ROW][C]43[/C][C]-0.098257[/C][C]-0.7547[/C][C]0.226708[/C][/ROW]
[ROW][C]44[/C][C]-0.097411[/C][C]-0.7482[/C][C]0.228646[/C][/ROW]
[ROW][C]45[/C][C]-0.055193[/C][C]-0.4239[/C][C]0.336574[/C][/ROW]
[ROW][C]46[/C][C]-0.036191[/C][C]-0.278[/C][C]0.390996[/C][/ROW]
[ROW][C]47[/C][C]0.031719[/C][C]0.2436[/C][C]0.404178[/C][/ROW]
[ROW][C]48[/C][C]0.021085[/C][C]0.162[/C][C]0.435945[/C][/ROW]
[ROW][C]49[/C][C]0.048449[/C][C]0.3721[/C][C]0.355559[/C][/ROW]
[ROW][C]50[/C][C]0.010979[/C][C]0.0843[/C][C]0.46654[/C][/ROW]
[ROW][C]51[/C][C]-0.008963[/C][C]-0.0688[/C][C]0.472672[/C][/ROW]
[ROW][C]52[/C][C]0.034505[/C][C]0.265[/C][C]0.395952[/C][/ROW]
[ROW][C]53[/C][C]-0.020978[/C][C]-0.1611[/C][C]0.436269[/C][/ROW]
[ROW][C]54[/C][C]0.002881[/C][C]0.0221[/C][C]0.49121[/C][/ROW]
[ROW][C]55[/C][C]0.015502[/C][C]0.1191[/C][C]0.452811[/C][/ROW]
[ROW][C]56[/C][C]0.007273[/C][C]0.0559[/C][C]0.477821[/C][/ROW]
[ROW][C]57[/C][C]-0.013174[/C][C]-0.1012[/C][C]0.459872[/C][/ROW]
[ROW][C]58[/C][C]0.001941[/C][C]0.0149[/C][C]0.494078[/C][/ROW]
[ROW][C]59[/C][C]NA[/C][C]NA[/C][C]NA[/C][/ROW]
[ROW][C]60[/C][C]NA[/C][C]NA[/C][C]NA[/C][/ROW]
[/TABLE]
Source: https://freestatistics.org/blog/index.php?pk=35790&T=1

Globally Unique Identifier (entire table): ba.freestatistics.org/blog/index.php?pk=35790&T=1

As an alternative you can also use a QR Code:  

The GUIDs for individual cells are displayed in the table below:

Autocorrelation Function
Time lag kACF(k)T-STATP-value
10.1158570.88990.188563
2-0.168235-1.29220.100657
3-0.164038-1.260.106315
4-0.127117-0.97640.166425
50.2736532.1020.019917
6-0.019664-0.1510.44023
7-0.085968-0.66030.255806
8-0.179091-1.37560.087069
9-0.095539-0.73380.232973
100.2219681.7050.04673
110.0645240.49560.311002
12-0.032336-0.24840.402352
13-0.143043-1.09870.138174
14-0.083325-0.640.262314
150.0643510.49430.311469
16-0.039221-0.30130.382137
170.1271010.97630.166455
18-0.126114-0.96870.168325
190.0797350.61250.271294
200.182051.39840.083621
21-0.052801-0.40560.343262
22-0.010695-0.08220.467402
23-0.184658-1.41840.08067
240.0438190.33660.368814
250.2167741.66510.0506
260.0124890.09590.461951
27-0.115254-0.88530.1898
28-0.127615-0.98020.165488
29-0.007749-0.05950.476369
300.1698261.30450.098572
310.0341550.26240.396982
32-0.069074-0.53060.298855
33-0.181421-1.39350.084345
34-0.083286-0.63970.262412
350.0642310.49340.311793
360.0734010.56380.287512
370.0541430.41590.339502
38-0.0256-0.19660.422395
39-0.010409-0.080.468271
40-0.040337-0.30980.378889
410.0250960.19280.423903
420.0052490.04030.483987
43-0.098257-0.75470.226708
44-0.097411-0.74820.228646
45-0.055193-0.42390.336574
46-0.036191-0.2780.390996
470.0317190.24360.404178
480.0210850.1620.435945
490.0484490.37210.355559
500.0109790.08430.46654
51-0.008963-0.06880.472672
520.0345050.2650.395952
53-0.020978-0.16110.436269
540.0028810.02210.49121
550.0155020.11910.452811
560.0072730.05590.477821
57-0.013174-0.10120.459872
580.0019410.01490.494078
59NANANA
60NANANA


Partial Autocorrelation Function
Time lag kPACF(k)T-STATP-value
10.1158570.88990.188563
2-0.184129-1.41430.081261
3-0.125508-0.9640.169479
4-0.129987-0.99850.161069
50.2727882.09530.020222
6-0.168612-1.29510.100159
7-0.001852-0.01420.49435
8-0.182485-1.40170.083123
90.0076130.05850.476784
100.0814070.62530.267094
110.0087630.06730.473281
12-0.047227-0.36280.359041
13-0.05355-0.41130.341162
14-0.015566-0.11960.452616
15-0.062272-0.47830.317094
16-0.10578-0.81250.209882
170.158211.21520.114559
18-0.166697-1.28040.102703
190.2526371.94050.028548
200.0130930.10060.460117
21-0.001597-0.01230.495128
22-0.11498-0.88320.190362
23-0.011997-0.09220.463445
240.0110180.08460.46642
250.1969651.51290.06782
26-0.032331-0.24830.402367
27-0.119526-0.91810.181153
280.0659420.50650.307193
29-0.069863-0.53660.296772
300.0451790.3470.364903
31-0.040561-0.31160.37824
320.0471110.36190.359373
33-0.08246-0.63340.264464
34-0.048945-0.3760.354151
35-0.055939-0.42970.334498
36-0.065773-0.50520.307646
370.0861660.66190.255321
380.0823550.63260.264725
39-0.027175-0.20870.417686
40-0.055154-0.42360.336682
41-0.030031-0.23070.409183
42-0.085223-0.65460.25763
43-0.078312-0.60150.274898
44-0.067126-0.51560.304028
45-0.139273-1.06980.144538
460.0083440.06410.474557
47-0.061562-0.47290.319027
480.0195580.15020.440547
49-0.04-0.30720.379869
50-0.038414-0.29510.38449
510.026610.20440.419374
520.0701320.53870.296064
530.0295770.22720.410531
54-0.071979-0.55290.291217
550.0166350.12780.449382
56-0.049509-0.38030.35255
57-0.005628-0.04320.482831
58-0.0134-0.10290.459184
59NANANA
60NANANA

\begin{tabular}{lllllllll}
\hline
Partial Autocorrelation Function \tabularnewline
Time lag k & PACF(k) & T-STAT & P-value \tabularnewline
1 & 0.115857 & 0.8899 & 0.188563 \tabularnewline
2 & -0.184129 & -1.4143 & 0.081261 \tabularnewline
3 & -0.125508 & -0.964 & 0.169479 \tabularnewline
4 & -0.129987 & -0.9985 & 0.161069 \tabularnewline
5 & 0.272788 & 2.0953 & 0.020222 \tabularnewline
6 & -0.168612 & -1.2951 & 0.100159 \tabularnewline
7 & -0.001852 & -0.0142 & 0.49435 \tabularnewline
8 & -0.182485 & -1.4017 & 0.083123 \tabularnewline
9 & 0.007613 & 0.0585 & 0.476784 \tabularnewline
10 & 0.081407 & 0.6253 & 0.267094 \tabularnewline
11 & 0.008763 & 0.0673 & 0.473281 \tabularnewline
12 & -0.047227 & -0.3628 & 0.359041 \tabularnewline
13 & -0.05355 & -0.4113 & 0.341162 \tabularnewline
14 & -0.015566 & -0.1196 & 0.452616 \tabularnewline
15 & -0.062272 & -0.4783 & 0.317094 \tabularnewline
16 & -0.10578 & -0.8125 & 0.209882 \tabularnewline
17 & 0.15821 & 1.2152 & 0.114559 \tabularnewline
18 & -0.166697 & -1.2804 & 0.102703 \tabularnewline
19 & 0.252637 & 1.9405 & 0.028548 \tabularnewline
20 & 0.013093 & 0.1006 & 0.460117 \tabularnewline
21 & -0.001597 & -0.0123 & 0.495128 \tabularnewline
22 & -0.11498 & -0.8832 & 0.190362 \tabularnewline
23 & -0.011997 & -0.0922 & 0.463445 \tabularnewline
24 & 0.011018 & 0.0846 & 0.46642 \tabularnewline
25 & 0.196965 & 1.5129 & 0.06782 \tabularnewline
26 & -0.032331 & -0.2483 & 0.402367 \tabularnewline
27 & -0.119526 & -0.9181 & 0.181153 \tabularnewline
28 & 0.065942 & 0.5065 & 0.307193 \tabularnewline
29 & -0.069863 & -0.5366 & 0.296772 \tabularnewline
30 & 0.045179 & 0.347 & 0.364903 \tabularnewline
31 & -0.040561 & -0.3116 & 0.37824 \tabularnewline
32 & 0.047111 & 0.3619 & 0.359373 \tabularnewline
33 & -0.08246 & -0.6334 & 0.264464 \tabularnewline
34 & -0.048945 & -0.376 & 0.354151 \tabularnewline
35 & -0.055939 & -0.4297 & 0.334498 \tabularnewline
36 & -0.065773 & -0.5052 & 0.307646 \tabularnewline
37 & 0.086166 & 0.6619 & 0.255321 \tabularnewline
38 & 0.082355 & 0.6326 & 0.264725 \tabularnewline
39 & -0.027175 & -0.2087 & 0.417686 \tabularnewline
40 & -0.055154 & -0.4236 & 0.336682 \tabularnewline
41 & -0.030031 & -0.2307 & 0.409183 \tabularnewline
42 & -0.085223 & -0.6546 & 0.25763 \tabularnewline
43 & -0.078312 & -0.6015 & 0.274898 \tabularnewline
44 & -0.067126 & -0.5156 & 0.304028 \tabularnewline
45 & -0.139273 & -1.0698 & 0.144538 \tabularnewline
46 & 0.008344 & 0.0641 & 0.474557 \tabularnewline
47 & -0.061562 & -0.4729 & 0.319027 \tabularnewline
48 & 0.019558 & 0.1502 & 0.440547 \tabularnewline
49 & -0.04 & -0.3072 & 0.379869 \tabularnewline
50 & -0.038414 & -0.2951 & 0.38449 \tabularnewline
51 & 0.02661 & 0.2044 & 0.419374 \tabularnewline
52 & 0.070132 & 0.5387 & 0.296064 \tabularnewline
53 & 0.029577 & 0.2272 & 0.410531 \tabularnewline
54 & -0.071979 & -0.5529 & 0.291217 \tabularnewline
55 & 0.016635 & 0.1278 & 0.449382 \tabularnewline
56 & -0.049509 & -0.3803 & 0.35255 \tabularnewline
57 & -0.005628 & -0.0432 & 0.482831 \tabularnewline
58 & -0.0134 & -0.1029 & 0.459184 \tabularnewline
59 & NA & NA & NA \tabularnewline
60 & NA & NA & NA \tabularnewline
\hline
\end{tabular}
%Source: https://freestatistics.org/blog/index.php?pk=35790&T=2

[TABLE]
[ROW][C]Partial Autocorrelation Function[/C][/ROW]
[ROW][C]Time lag k[/C][C]PACF(k)[/C][C]T-STAT[/C][C]P-value[/C][/ROW]
[ROW][C]1[/C][C]0.115857[/C][C]0.8899[/C][C]0.188563[/C][/ROW]
[ROW][C]2[/C][C]-0.184129[/C][C]-1.4143[/C][C]0.081261[/C][/ROW]
[ROW][C]3[/C][C]-0.125508[/C][C]-0.964[/C][C]0.169479[/C][/ROW]
[ROW][C]4[/C][C]-0.129987[/C][C]-0.9985[/C][C]0.161069[/C][/ROW]
[ROW][C]5[/C][C]0.272788[/C][C]2.0953[/C][C]0.020222[/C][/ROW]
[ROW][C]6[/C][C]-0.168612[/C][C]-1.2951[/C][C]0.100159[/C][/ROW]
[ROW][C]7[/C][C]-0.001852[/C][C]-0.0142[/C][C]0.49435[/C][/ROW]
[ROW][C]8[/C][C]-0.182485[/C][C]-1.4017[/C][C]0.083123[/C][/ROW]
[ROW][C]9[/C][C]0.007613[/C][C]0.0585[/C][C]0.476784[/C][/ROW]
[ROW][C]10[/C][C]0.081407[/C][C]0.6253[/C][C]0.267094[/C][/ROW]
[ROW][C]11[/C][C]0.008763[/C][C]0.0673[/C][C]0.473281[/C][/ROW]
[ROW][C]12[/C][C]-0.047227[/C][C]-0.3628[/C][C]0.359041[/C][/ROW]
[ROW][C]13[/C][C]-0.05355[/C][C]-0.4113[/C][C]0.341162[/C][/ROW]
[ROW][C]14[/C][C]-0.015566[/C][C]-0.1196[/C][C]0.452616[/C][/ROW]
[ROW][C]15[/C][C]-0.062272[/C][C]-0.4783[/C][C]0.317094[/C][/ROW]
[ROW][C]16[/C][C]-0.10578[/C][C]-0.8125[/C][C]0.209882[/C][/ROW]
[ROW][C]17[/C][C]0.15821[/C][C]1.2152[/C][C]0.114559[/C][/ROW]
[ROW][C]18[/C][C]-0.166697[/C][C]-1.2804[/C][C]0.102703[/C][/ROW]
[ROW][C]19[/C][C]0.252637[/C][C]1.9405[/C][C]0.028548[/C][/ROW]
[ROW][C]20[/C][C]0.013093[/C][C]0.1006[/C][C]0.460117[/C][/ROW]
[ROW][C]21[/C][C]-0.001597[/C][C]-0.0123[/C][C]0.495128[/C][/ROW]
[ROW][C]22[/C][C]-0.11498[/C][C]-0.8832[/C][C]0.190362[/C][/ROW]
[ROW][C]23[/C][C]-0.011997[/C][C]-0.0922[/C][C]0.463445[/C][/ROW]
[ROW][C]24[/C][C]0.011018[/C][C]0.0846[/C][C]0.46642[/C][/ROW]
[ROW][C]25[/C][C]0.196965[/C][C]1.5129[/C][C]0.06782[/C][/ROW]
[ROW][C]26[/C][C]-0.032331[/C][C]-0.2483[/C][C]0.402367[/C][/ROW]
[ROW][C]27[/C][C]-0.119526[/C][C]-0.9181[/C][C]0.181153[/C][/ROW]
[ROW][C]28[/C][C]0.065942[/C][C]0.5065[/C][C]0.307193[/C][/ROW]
[ROW][C]29[/C][C]-0.069863[/C][C]-0.5366[/C][C]0.296772[/C][/ROW]
[ROW][C]30[/C][C]0.045179[/C][C]0.347[/C][C]0.364903[/C][/ROW]
[ROW][C]31[/C][C]-0.040561[/C][C]-0.3116[/C][C]0.37824[/C][/ROW]
[ROW][C]32[/C][C]0.047111[/C][C]0.3619[/C][C]0.359373[/C][/ROW]
[ROW][C]33[/C][C]-0.08246[/C][C]-0.6334[/C][C]0.264464[/C][/ROW]
[ROW][C]34[/C][C]-0.048945[/C][C]-0.376[/C][C]0.354151[/C][/ROW]
[ROW][C]35[/C][C]-0.055939[/C][C]-0.4297[/C][C]0.334498[/C][/ROW]
[ROW][C]36[/C][C]-0.065773[/C][C]-0.5052[/C][C]0.307646[/C][/ROW]
[ROW][C]37[/C][C]0.086166[/C][C]0.6619[/C][C]0.255321[/C][/ROW]
[ROW][C]38[/C][C]0.082355[/C][C]0.6326[/C][C]0.264725[/C][/ROW]
[ROW][C]39[/C][C]-0.027175[/C][C]-0.2087[/C][C]0.417686[/C][/ROW]
[ROW][C]40[/C][C]-0.055154[/C][C]-0.4236[/C][C]0.336682[/C][/ROW]
[ROW][C]41[/C][C]-0.030031[/C][C]-0.2307[/C][C]0.409183[/C][/ROW]
[ROW][C]42[/C][C]-0.085223[/C][C]-0.6546[/C][C]0.25763[/C][/ROW]
[ROW][C]43[/C][C]-0.078312[/C][C]-0.6015[/C][C]0.274898[/C][/ROW]
[ROW][C]44[/C][C]-0.067126[/C][C]-0.5156[/C][C]0.304028[/C][/ROW]
[ROW][C]45[/C][C]-0.139273[/C][C]-1.0698[/C][C]0.144538[/C][/ROW]
[ROW][C]46[/C][C]0.008344[/C][C]0.0641[/C][C]0.474557[/C][/ROW]
[ROW][C]47[/C][C]-0.061562[/C][C]-0.4729[/C][C]0.319027[/C][/ROW]
[ROW][C]48[/C][C]0.019558[/C][C]0.1502[/C][C]0.440547[/C][/ROW]
[ROW][C]49[/C][C]-0.04[/C][C]-0.3072[/C][C]0.379869[/C][/ROW]
[ROW][C]50[/C][C]-0.038414[/C][C]-0.2951[/C][C]0.38449[/C][/ROW]
[ROW][C]51[/C][C]0.02661[/C][C]0.2044[/C][C]0.419374[/C][/ROW]
[ROW][C]52[/C][C]0.070132[/C][C]0.5387[/C][C]0.296064[/C][/ROW]
[ROW][C]53[/C][C]0.029577[/C][C]0.2272[/C][C]0.410531[/C][/ROW]
[ROW][C]54[/C][C]-0.071979[/C][C]-0.5529[/C][C]0.291217[/C][/ROW]
[ROW][C]55[/C][C]0.016635[/C][C]0.1278[/C][C]0.449382[/C][/ROW]
[ROW][C]56[/C][C]-0.049509[/C][C]-0.3803[/C][C]0.35255[/C][/ROW]
[ROW][C]57[/C][C]-0.005628[/C][C]-0.0432[/C][C]0.482831[/C][/ROW]
[ROW][C]58[/C][C]-0.0134[/C][C]-0.1029[/C][C]0.459184[/C][/ROW]
[ROW][C]59[/C][C]NA[/C][C]NA[/C][C]NA[/C][/ROW]
[ROW][C]60[/C][C]NA[/C][C]NA[/C][C]NA[/C][/ROW]
[/TABLE]
Source: https://freestatistics.org/blog/index.php?pk=35790&T=2

Globally Unique Identifier (entire table): ba.freestatistics.org/blog/index.php?pk=35790&T=2

As an alternative you can also use a QR Code:  

The GUIDs for individual cells are displayed in the table below:

Partial Autocorrelation Function
Time lag kPACF(k)T-STATP-value
10.1158570.88990.188563
2-0.184129-1.41430.081261
3-0.125508-0.9640.169479
4-0.129987-0.99850.161069
50.2727882.09530.020222
6-0.168612-1.29510.100159
7-0.001852-0.01420.49435
8-0.182485-1.40170.083123
90.0076130.05850.476784
100.0814070.62530.267094
110.0087630.06730.473281
12-0.047227-0.36280.359041
13-0.05355-0.41130.341162
14-0.015566-0.11960.452616
15-0.062272-0.47830.317094
16-0.10578-0.81250.209882
170.158211.21520.114559
18-0.166697-1.28040.102703
190.2526371.94050.028548
200.0130930.10060.460117
21-0.001597-0.01230.495128
22-0.11498-0.88320.190362
23-0.011997-0.09220.463445
240.0110180.08460.46642
250.1969651.51290.06782
26-0.032331-0.24830.402367
27-0.119526-0.91810.181153
280.0659420.50650.307193
29-0.069863-0.53660.296772
300.0451790.3470.364903
31-0.040561-0.31160.37824
320.0471110.36190.359373
33-0.08246-0.63340.264464
34-0.048945-0.3760.354151
35-0.055939-0.42970.334498
36-0.065773-0.50520.307646
370.0861660.66190.255321
380.0823550.63260.264725
39-0.027175-0.20870.417686
40-0.055154-0.42360.336682
41-0.030031-0.23070.409183
42-0.085223-0.65460.25763
43-0.078312-0.60150.274898
44-0.067126-0.51560.304028
45-0.139273-1.06980.144538
460.0083440.06410.474557
47-0.061562-0.47290.319027
480.0195580.15020.440547
49-0.04-0.30720.379869
50-0.038414-0.29510.38449
510.026610.20440.419374
520.0701320.53870.296064
530.0295770.22720.410531
54-0.071979-0.55290.291217
550.0166350.12780.449382
56-0.049509-0.38030.35255
57-0.005628-0.04320.482831
58-0.0134-0.10290.459184
59NANANA
60NANANA


Parameters (Session):
par1 = 60 ; par2 = 0.0 ; par3 = 1 ; par4 = 0 ; par5 = 12 ;
Parameters (R input):
par1 = 60 ; par2 = 0.0 ; par3 = 1 ; par4 = 0 ; par5 = 12 ;
R code (references can be found in the software module):
if (par1 == 'Default') {
par1 = 10*log10(length(x))
} else {
par1 <- as.numeric(par1)
}
par2 <- as.numeric(par2)
par3 <- as.numeric(par3)
par4 <- as.numeric(par4)
par5 <- as.numeric(par5)
if (par2 == 0) {
x <- log(x)
} else {
x <- (x ^ par2 - 1) / par2
}
if (par3 > 0) x <- diff(x,lag=1,difference=par3)
if (par4 > 0) x <- diff(x,lag=par5,difference=par4)
bitmap(file='pic1.png')
racf <- acf(x,par1,main='Autocorrelation',xlab='lags',ylab='ACF')
dev.off()
bitmap(file='pic2.png')
rpacf <- pacf(x,par1,main='Partial Autocorrelation',xlab='lags',ylab='PACF')
dev.off()
(myacf <- c(racf$acf))
(mypacf <- c(rpacf$acf))
lengthx <- length(x)
sqrtn <- sqrt(lengthx)
load(file='createtable')
a<-table.start()
a<-table.row.start(a)
a<-table.element(a,'Autocorrelation Function',4,TRUE)
a<-table.row.end(a)
a<-table.row.start(a)
a<-table.element(a,'Time lag k',header=TRUE)
a<-table.element(a,hyperlink('basics.htm','ACF(k)','click here for more information about the Autocorrelation Function'),header=TRUE)
a<-table.element(a,'T-STAT',header=TRUE)
a<-table.element(a,'P-value',header=TRUE)
a<-table.row.end(a)
for (i in 2:(par1+1)) {
a<-table.row.start(a)
a<-table.element(a,i-1,header=TRUE)
a<-table.element(a,round(myacf[i],6))
mytstat <- myacf[i]*sqrtn
a<-table.element(a,round(mytstat,4))
a<-table.element(a,round(1-pt(abs(mytstat),lengthx),6))
a<-table.row.end(a)
}
a<-table.end(a)
table.save(a,file='mytable.tab')
a<-table.start()
a<-table.row.start(a)
a<-table.element(a,'Partial Autocorrelation Function',4,TRUE)
a<-table.row.end(a)
a<-table.row.start(a)
a<-table.element(a,'Time lag k',header=TRUE)
a<-table.element(a,hyperlink('basics.htm','PACF(k)','click here for more information about the Partial Autocorrelation Function'),header=TRUE)
a<-table.element(a,'T-STAT',header=TRUE)
a<-table.element(a,'P-value',header=TRUE)
a<-table.row.end(a)
for (i in 1:par1) {
a<-table.row.start(a)
a<-table.element(a,i,header=TRUE)
a<-table.element(a,round(mypacf[i],6))
mytstat <- mypacf[i]*sqrtn
a<-table.element(a,round(mytstat,4))
a<-table.element(a,round(1-pt(abs(mytstat),lengthx),6))
a<-table.row.end(a)
}
a<-table.end(a)
table.save(a,file='mytable1.tab')