Free Statistics

of Irreproducible Research!

Author's title

Author*Unverified author*
R Software Modulerwasp_autocorrelation.wasp
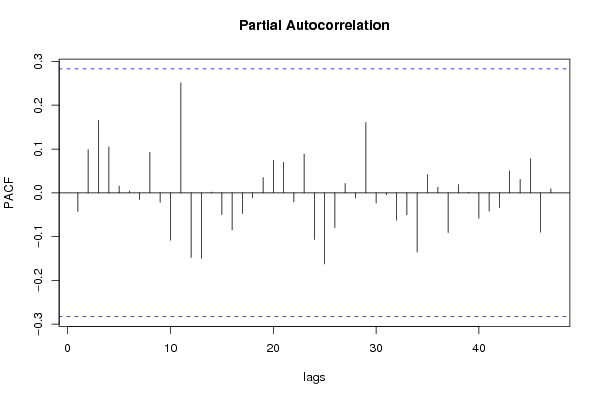
Title produced by software(Partial) Autocorrelation Function
Date of computationSun, 21 Dec 2008 12:04:19 -0700
Cite this page as followsStatistical Computations at FreeStatistics.org, Office for Research Development and Education, URL https://freestatistics.org/blog/index.php?v=date/2008/Dec/21/t1229886301yqiyza8id5pztlm.htm/, Retrieved Sun, 19 May 2024 11:12:59 +0000
Statistical Computations at FreeStatistics.org, Office for Research Development and Education, URL https://freestatistics.org/blog/index.php?pk=35762, Retrieved Sun, 19 May 2024 11:12:59 +0000
QR Codes:

Original text written by user:
IsPrivate?No (this computation is public)
User-defined keywords
Estimated Impact146
Family? (F = Feedback message, R = changed R code, M = changed R Module, P = changed Parameters, D = changed Data)
F       [(Partial) Autocorrelation Function] [] [2008-12-21 19:04:19] [d41d8cd98f00b204e9800998ecf8427e] [Current]
Feedback Forum
2009-01-08 13:08:01 [Aurélie Van Impe] [reply
Je legt niet uit wat de bedoeling is, wat je juist moet doen, welk patroon je moet herkennen. Hiervoor had je bijvoorbeeld de theoretische modellen in je paper kunnen verwerken, zodat de lezer kon zien wat je juist probeert te herkennen. Verder wil ik vermelden dat je niet perse moet zoeken in de streepjes die buiten het betrouwbaarheidsinterval komen. Je had beter kunnen vermelden dat je voor een AR proces in de ACF grafiek moet kijken. Ik zie daar met een beetje goede wil wel een dalend verloop in de eerste paar streepjes. Voor de significantie moet je vervolgens kijken in de PACF grafiek. Daar zie je dat geen enkel van die eerste streepjes buiten het betrouwbaarheidsinterval komt, waardoor we dus kunnen stellen dat p=0. Waarbij p de niet seizoenale parameter is voor je formule. Ook seizoenaliteit vind ik niet terug in de grafiek. Je had kunnen vermelden waarom je dat niet ziet. Namelijk omdat er geen opvallende hoge streepjes zijn om een regelmatig aantal periodes. P, de seizoenale parameter, is dus ook 0.
Voor een MA proces moet je dan weer kijken in de PACF. Hier zou je een verloop moeten opmerken dat convergeert naar nul, maar dan aan de onderkant, indien er een MA proces aanwezig zou zijn. Je ziet dit niet, dus er is geen niet-seizoenaal MA proces aanwezig. We kunnen er dus van uitgaan dat q nul is. Ik zie aan de onderkant echter wel een vorm van seizoenaliteit in de PACF. Ik zie om de ongeveer 12 maanden een uitstekende streep. Voor de significantie kijk ik vervolgens naar de ACF. Daar zie ik dat geen enkel van die streepjes boven het betrouwbaarheidsinterval uitkomt. Je kan er dus van uitgaan dat Q gelijk is aan 0.
Dit alles heb jij niet vermeld, waardoor de lezer niet goed weet wat je bedoelt met je uitleg. Het is wel een goed idee om je probleem te proberen oplossen met een arima backward Selection.

Post a new message
Dataseries X:
547344
554788
562325
560854
555332
543599
536662
542722
593530
610763
612613
611324
594167
595454
590865
589379
584428
573100
567456
569028
620735
628884
628232
612117
595404
597141
593408
590072
579799
574205
572775
572942
619567
625809
619916
587625
565742
557274
560576
548854
531673
525919
511038
498662
555362
564591
541657
527070
509846
514258
516922
507561
492622
490243
469357
477580
528379
533590
517945
506174
501866


Summary of computational transaction
Raw Inputview raw input (R code)
Raw Outputview raw output of R engine
Computing time1 seconds
R Server'George Udny Yule' @ 72.249.76.132

\begin{tabular}{lllllllll}
\hline
Summary of computational transaction \tabularnewline
Raw Input & view raw input (R code)  \tabularnewline
Raw Output & view raw output of R engine  \tabularnewline
Computing time & 1 seconds \tabularnewline
R Server & 'George Udny Yule' @ 72.249.76.132 \tabularnewline
\hline
\end{tabular}
%Source: https://freestatistics.org/blog/index.php?pk=35762&T=0

[TABLE]
[ROW][C]Summary of computational transaction[/C][/ROW]
[ROW][C]Raw Input[/C][C]view raw input (R code) [/C][/ROW]
[ROW][C]Raw Output[/C][C]view raw output of R engine [/C][/ROW]
[ROW][C]Computing time[/C][C]1 seconds[/C][/ROW]
[ROW][C]R Server[/C][C]'George Udny Yule' @ 72.249.76.132[/C][/ROW]
[/TABLE]
Source: https://freestatistics.org/blog/index.php?pk=35762&T=0

Globally Unique Identifier (entire table): ba.freestatistics.org/blog/index.php?pk=35762&T=0

As an alternative you can also use a QR Code:  

The GUIDs for individual cells are displayed in the table below:

Summary of computational transaction
Raw Inputview raw input (R code)
Raw Outputview raw output of R engine
Computing time1 seconds
R Server'George Udny Yule' @ 72.249.76.132


Autocorrelation Function
Time lag kACF(k)T-STATP-value
1-0.042594-0.29510.384595
20.1005140.69640.244774
30.1552411.07550.143755
40.0958610.66410.254887
50.0352080.24390.404162
60.04640.32150.374625
70.0189850.13150.447953
80.1109550.76870.222913
9-0.020955-0.14520.442587
10-0.073577-0.50980.306279
110.2766221.91650.030633
12-0.164287-1.13820.13034
13-0.094157-0.65230.258647
140.0391780.27140.39361
15-0.064925-0.44980.327436
16-0.110467-0.76530.223909
17-0.062267-0.43140.334056
18-0.060757-0.42090.33784
190.0303220.21010.417249
20-0.018277-0.12660.449882
21-0.014793-0.10250.459398
220.0773620.5360.297225
230.0035960.02490.490114
24-0.130896-0.90690.184501
25-0.047676-0.33030.371301
26-0.077635-0.53790.296576
27-0.035591-0.24660.403142
28-0.041352-0.28650.387867
290.0999950.69280.245892
30-0.031274-0.21670.41469
310.0285460.19780.422029
32-0.057123-0.39580.347019
33-0.0027-0.01870.492577
34-0.073469-0.5090.306539
35-0.045808-0.31740.376171
36-0.055068-0.38150.352251
37-0.075577-0.52360.301478
38-0.01889-0.13090.44821
39-0.057301-0.3970.346566
400.0248970.17250.431888
41-0.078861-0.54640.293673
42-0.00165-0.01140.495463
430.0295990.20510.419193
44-0.015718-0.10890.456868
45-0.022137-0.15340.439375
46-0.055176-0.38230.351975
47-0.022323-0.15470.43887
48NANANA

\begin{tabular}{lllllllll}
\hline
Autocorrelation Function \tabularnewline
Time lag k & ACF(k) & T-STAT & P-value \tabularnewline
1 & -0.042594 & -0.2951 & 0.384595 \tabularnewline
2 & 0.100514 & 0.6964 & 0.244774 \tabularnewline
3 & 0.155241 & 1.0755 & 0.143755 \tabularnewline
4 & 0.095861 & 0.6641 & 0.254887 \tabularnewline
5 & 0.035208 & 0.2439 & 0.404162 \tabularnewline
6 & 0.0464 & 0.3215 & 0.374625 \tabularnewline
7 & 0.018985 & 0.1315 & 0.447953 \tabularnewline
8 & 0.110955 & 0.7687 & 0.222913 \tabularnewline
9 & -0.020955 & -0.1452 & 0.442587 \tabularnewline
10 & -0.073577 & -0.5098 & 0.306279 \tabularnewline
11 & 0.276622 & 1.9165 & 0.030633 \tabularnewline
12 & -0.164287 & -1.1382 & 0.13034 \tabularnewline
13 & -0.094157 & -0.6523 & 0.258647 \tabularnewline
14 & 0.039178 & 0.2714 & 0.39361 \tabularnewline
15 & -0.064925 & -0.4498 & 0.327436 \tabularnewline
16 & -0.110467 & -0.7653 & 0.223909 \tabularnewline
17 & -0.062267 & -0.4314 & 0.334056 \tabularnewline
18 & -0.060757 & -0.4209 & 0.33784 \tabularnewline
19 & 0.030322 & 0.2101 & 0.417249 \tabularnewline
20 & -0.018277 & -0.1266 & 0.449882 \tabularnewline
21 & -0.014793 & -0.1025 & 0.459398 \tabularnewline
22 & 0.077362 & 0.536 & 0.297225 \tabularnewline
23 & 0.003596 & 0.0249 & 0.490114 \tabularnewline
24 & -0.130896 & -0.9069 & 0.184501 \tabularnewline
25 & -0.047676 & -0.3303 & 0.371301 \tabularnewline
26 & -0.077635 & -0.5379 & 0.296576 \tabularnewline
27 & -0.035591 & -0.2466 & 0.403142 \tabularnewline
28 & -0.041352 & -0.2865 & 0.387867 \tabularnewline
29 & 0.099995 & 0.6928 & 0.245892 \tabularnewline
30 & -0.031274 & -0.2167 & 0.41469 \tabularnewline
31 & 0.028546 & 0.1978 & 0.422029 \tabularnewline
32 & -0.057123 & -0.3958 & 0.347019 \tabularnewline
33 & -0.0027 & -0.0187 & 0.492577 \tabularnewline
34 & -0.073469 & -0.509 & 0.306539 \tabularnewline
35 & -0.045808 & -0.3174 & 0.376171 \tabularnewline
36 & -0.055068 & -0.3815 & 0.352251 \tabularnewline
37 & -0.075577 & -0.5236 & 0.301478 \tabularnewline
38 & -0.01889 & -0.1309 & 0.44821 \tabularnewline
39 & -0.057301 & -0.397 & 0.346566 \tabularnewline
40 & 0.024897 & 0.1725 & 0.431888 \tabularnewline
41 & -0.078861 & -0.5464 & 0.293673 \tabularnewline
42 & -0.00165 & -0.0114 & 0.495463 \tabularnewline
43 & 0.029599 & 0.2051 & 0.419193 \tabularnewline
44 & -0.015718 & -0.1089 & 0.456868 \tabularnewline
45 & -0.022137 & -0.1534 & 0.439375 \tabularnewline
46 & -0.055176 & -0.3823 & 0.351975 \tabularnewline
47 & -0.022323 & -0.1547 & 0.43887 \tabularnewline
48 & NA & NA & NA \tabularnewline
\hline
\end{tabular}
%Source: https://freestatistics.org/blog/index.php?pk=35762&T=1

[TABLE]
[ROW][C]Autocorrelation Function[/C][/ROW]
[ROW][C]Time lag k[/C][C]ACF(k)[/C][C]T-STAT[/C][C]P-value[/C][/ROW]
[ROW][C]1[/C][C]-0.042594[/C][C]-0.2951[/C][C]0.384595[/C][/ROW]
[ROW][C]2[/C][C]0.100514[/C][C]0.6964[/C][C]0.244774[/C][/ROW]
[ROW][C]3[/C][C]0.155241[/C][C]1.0755[/C][C]0.143755[/C][/ROW]
[ROW][C]4[/C][C]0.095861[/C][C]0.6641[/C][C]0.254887[/C][/ROW]
[ROW][C]5[/C][C]0.035208[/C][C]0.2439[/C][C]0.404162[/C][/ROW]
[ROW][C]6[/C][C]0.0464[/C][C]0.3215[/C][C]0.374625[/C][/ROW]
[ROW][C]7[/C][C]0.018985[/C][C]0.1315[/C][C]0.447953[/C][/ROW]
[ROW][C]8[/C][C]0.110955[/C][C]0.7687[/C][C]0.222913[/C][/ROW]
[ROW][C]9[/C][C]-0.020955[/C][C]-0.1452[/C][C]0.442587[/C][/ROW]
[ROW][C]10[/C][C]-0.073577[/C][C]-0.5098[/C][C]0.306279[/C][/ROW]
[ROW][C]11[/C][C]0.276622[/C][C]1.9165[/C][C]0.030633[/C][/ROW]
[ROW][C]12[/C][C]-0.164287[/C][C]-1.1382[/C][C]0.13034[/C][/ROW]
[ROW][C]13[/C][C]-0.094157[/C][C]-0.6523[/C][C]0.258647[/C][/ROW]
[ROW][C]14[/C][C]0.039178[/C][C]0.2714[/C][C]0.39361[/C][/ROW]
[ROW][C]15[/C][C]-0.064925[/C][C]-0.4498[/C][C]0.327436[/C][/ROW]
[ROW][C]16[/C][C]-0.110467[/C][C]-0.7653[/C][C]0.223909[/C][/ROW]
[ROW][C]17[/C][C]-0.062267[/C][C]-0.4314[/C][C]0.334056[/C][/ROW]
[ROW][C]18[/C][C]-0.060757[/C][C]-0.4209[/C][C]0.33784[/C][/ROW]
[ROW][C]19[/C][C]0.030322[/C][C]0.2101[/C][C]0.417249[/C][/ROW]
[ROW][C]20[/C][C]-0.018277[/C][C]-0.1266[/C][C]0.449882[/C][/ROW]
[ROW][C]21[/C][C]-0.014793[/C][C]-0.1025[/C][C]0.459398[/C][/ROW]
[ROW][C]22[/C][C]0.077362[/C][C]0.536[/C][C]0.297225[/C][/ROW]
[ROW][C]23[/C][C]0.003596[/C][C]0.0249[/C][C]0.490114[/C][/ROW]
[ROW][C]24[/C][C]-0.130896[/C][C]-0.9069[/C][C]0.184501[/C][/ROW]
[ROW][C]25[/C][C]-0.047676[/C][C]-0.3303[/C][C]0.371301[/C][/ROW]
[ROW][C]26[/C][C]-0.077635[/C][C]-0.5379[/C][C]0.296576[/C][/ROW]
[ROW][C]27[/C][C]-0.035591[/C][C]-0.2466[/C][C]0.403142[/C][/ROW]
[ROW][C]28[/C][C]-0.041352[/C][C]-0.2865[/C][C]0.387867[/C][/ROW]
[ROW][C]29[/C][C]0.099995[/C][C]0.6928[/C][C]0.245892[/C][/ROW]
[ROW][C]30[/C][C]-0.031274[/C][C]-0.2167[/C][C]0.41469[/C][/ROW]
[ROW][C]31[/C][C]0.028546[/C][C]0.1978[/C][C]0.422029[/C][/ROW]
[ROW][C]32[/C][C]-0.057123[/C][C]-0.3958[/C][C]0.347019[/C][/ROW]
[ROW][C]33[/C][C]-0.0027[/C][C]-0.0187[/C][C]0.492577[/C][/ROW]
[ROW][C]34[/C][C]-0.073469[/C][C]-0.509[/C][C]0.306539[/C][/ROW]
[ROW][C]35[/C][C]-0.045808[/C][C]-0.3174[/C][C]0.376171[/C][/ROW]
[ROW][C]36[/C][C]-0.055068[/C][C]-0.3815[/C][C]0.352251[/C][/ROW]
[ROW][C]37[/C][C]-0.075577[/C][C]-0.5236[/C][C]0.301478[/C][/ROW]
[ROW][C]38[/C][C]-0.01889[/C][C]-0.1309[/C][C]0.44821[/C][/ROW]
[ROW][C]39[/C][C]-0.057301[/C][C]-0.397[/C][C]0.346566[/C][/ROW]
[ROW][C]40[/C][C]0.024897[/C][C]0.1725[/C][C]0.431888[/C][/ROW]
[ROW][C]41[/C][C]-0.078861[/C][C]-0.5464[/C][C]0.293673[/C][/ROW]
[ROW][C]42[/C][C]-0.00165[/C][C]-0.0114[/C][C]0.495463[/C][/ROW]
[ROW][C]43[/C][C]0.029599[/C][C]0.2051[/C][C]0.419193[/C][/ROW]
[ROW][C]44[/C][C]-0.015718[/C][C]-0.1089[/C][C]0.456868[/C][/ROW]
[ROW][C]45[/C][C]-0.022137[/C][C]-0.1534[/C][C]0.439375[/C][/ROW]
[ROW][C]46[/C][C]-0.055176[/C][C]-0.3823[/C][C]0.351975[/C][/ROW]
[ROW][C]47[/C][C]-0.022323[/C][C]-0.1547[/C][C]0.43887[/C][/ROW]
[ROW][C]48[/C][C]NA[/C][C]NA[/C][C]NA[/C][/ROW]
[/TABLE]
Source: https://freestatistics.org/blog/index.php?pk=35762&T=1

Globally Unique Identifier (entire table): ba.freestatistics.org/blog/index.php?pk=35762&T=1

As an alternative you can also use a QR Code:  

The GUIDs for individual cells are displayed in the table below:

Autocorrelation Function
Time lag kACF(k)T-STATP-value
1-0.042594-0.29510.384595
20.1005140.69640.244774
30.1552411.07550.143755
40.0958610.66410.254887
50.0352080.24390.404162
60.04640.32150.374625
70.0189850.13150.447953
80.1109550.76870.222913
9-0.020955-0.14520.442587
10-0.073577-0.50980.306279
110.2766221.91650.030633
12-0.164287-1.13820.13034
13-0.094157-0.65230.258647
140.0391780.27140.39361
15-0.064925-0.44980.327436
16-0.110467-0.76530.223909
17-0.062267-0.43140.334056
18-0.060757-0.42090.33784
190.0303220.21010.417249
20-0.018277-0.12660.449882
21-0.014793-0.10250.459398
220.0773620.5360.297225
230.0035960.02490.490114
24-0.130896-0.90690.184501
25-0.047676-0.33030.371301
26-0.077635-0.53790.296576
27-0.035591-0.24660.403142
28-0.041352-0.28650.387867
290.0999950.69280.245892
30-0.031274-0.21670.41469
310.0285460.19780.422029
32-0.057123-0.39580.347019
33-0.0027-0.01870.492577
34-0.073469-0.5090.306539
35-0.045808-0.31740.376171
36-0.055068-0.38150.352251
37-0.075577-0.52360.301478
38-0.01889-0.13090.44821
39-0.057301-0.3970.346566
400.0248970.17250.431888
41-0.078861-0.54640.293673
42-0.00165-0.01140.495463
430.0295990.20510.419193
44-0.015718-0.10890.456868
45-0.022137-0.15340.439375
46-0.055176-0.38230.351975
47-0.022323-0.15470.43887
48NANANA


Partial Autocorrelation Function
Time lag kPACF(k)T-STATP-value
1-0.042594-0.29510.384595
20.0988790.68510.248302
30.1652231.14470.129006
40.104860.72650.235532
50.0155390.10770.457359
60.004120.02850.488674
7-0.015561-0.10780.457297
80.0926970.64220.261893
9-0.021674-0.15020.440632
10-0.108174-0.74950.228621
110.2513611.74150.044003
12-0.147589-1.02250.155829
13-0.150022-1.03940.151917
140.0017970.01240.49506
15-0.049671-0.34410.366127
16-0.084966-0.58870.279425
17-0.047076-0.32610.372865
18-0.011388-0.07890.468722
190.0349240.2420.404922
200.0744210.51560.304248
210.0695230.48170.316114
22-0.020679-0.14330.44334
230.0884390.61270.271476
24-0.106672-0.7390.23174
25-0.162382-1.1250.133088
26-0.079302-0.54940.292632
270.0210430.14580.442349
28-0.012111-0.08390.466741
290.1603841.11120.136014
30-0.023498-0.16280.435681
31-0.004688-0.03250.487113
32-0.062581-0.43360.333271
33-0.050176-0.34760.36482
34-0.13525-0.9370.176715
350.0418090.28970.386662
360.0126930.08790.465145
37-0.090814-0.62920.266108
380.0187730.13010.448529
390.0008240.00570.497733
40-0.058102-0.40250.344536
41-0.041626-0.28840.387142
42-0.03374-0.23380.408083
430.0500830.3470.36506
440.0306230.21220.416439
450.0778340.53930.296103
46-0.09003-0.62370.267873
470.0092490.06410.474588
48NANANA

\begin{tabular}{lllllllll}
\hline
Partial Autocorrelation Function \tabularnewline
Time lag k & PACF(k) & T-STAT & P-value \tabularnewline
1 & -0.042594 & -0.2951 & 0.384595 \tabularnewline
2 & 0.098879 & 0.6851 & 0.248302 \tabularnewline
3 & 0.165223 & 1.1447 & 0.129006 \tabularnewline
4 & 0.10486 & 0.7265 & 0.235532 \tabularnewline
5 & 0.015539 & 0.1077 & 0.457359 \tabularnewline
6 & 0.00412 & 0.0285 & 0.488674 \tabularnewline
7 & -0.015561 & -0.1078 & 0.457297 \tabularnewline
8 & 0.092697 & 0.6422 & 0.261893 \tabularnewline
9 & -0.021674 & -0.1502 & 0.440632 \tabularnewline
10 & -0.108174 & -0.7495 & 0.228621 \tabularnewline
11 & 0.251361 & 1.7415 & 0.044003 \tabularnewline
12 & -0.147589 & -1.0225 & 0.155829 \tabularnewline
13 & -0.150022 & -1.0394 & 0.151917 \tabularnewline
14 & 0.001797 & 0.0124 & 0.49506 \tabularnewline
15 & -0.049671 & -0.3441 & 0.366127 \tabularnewline
16 & -0.084966 & -0.5887 & 0.279425 \tabularnewline
17 & -0.047076 & -0.3261 & 0.372865 \tabularnewline
18 & -0.011388 & -0.0789 & 0.468722 \tabularnewline
19 & 0.034924 & 0.242 & 0.404922 \tabularnewline
20 & 0.074421 & 0.5156 & 0.304248 \tabularnewline
21 & 0.069523 & 0.4817 & 0.316114 \tabularnewline
22 & -0.020679 & -0.1433 & 0.44334 \tabularnewline
23 & 0.088439 & 0.6127 & 0.271476 \tabularnewline
24 & -0.106672 & -0.739 & 0.23174 \tabularnewline
25 & -0.162382 & -1.125 & 0.133088 \tabularnewline
26 & -0.079302 & -0.5494 & 0.292632 \tabularnewline
27 & 0.021043 & 0.1458 & 0.442349 \tabularnewline
28 & -0.012111 & -0.0839 & 0.466741 \tabularnewline
29 & 0.160384 & 1.1112 & 0.136014 \tabularnewline
30 & -0.023498 & -0.1628 & 0.435681 \tabularnewline
31 & -0.004688 & -0.0325 & 0.487113 \tabularnewline
32 & -0.062581 & -0.4336 & 0.333271 \tabularnewline
33 & -0.050176 & -0.3476 & 0.36482 \tabularnewline
34 & -0.13525 & -0.937 & 0.176715 \tabularnewline
35 & 0.041809 & 0.2897 & 0.386662 \tabularnewline
36 & 0.012693 & 0.0879 & 0.465145 \tabularnewline
37 & -0.090814 & -0.6292 & 0.266108 \tabularnewline
38 & 0.018773 & 0.1301 & 0.448529 \tabularnewline
39 & 0.000824 & 0.0057 & 0.497733 \tabularnewline
40 & -0.058102 & -0.4025 & 0.344536 \tabularnewline
41 & -0.041626 & -0.2884 & 0.387142 \tabularnewline
42 & -0.03374 & -0.2338 & 0.408083 \tabularnewline
43 & 0.050083 & 0.347 & 0.36506 \tabularnewline
44 & 0.030623 & 0.2122 & 0.416439 \tabularnewline
45 & 0.077834 & 0.5393 & 0.296103 \tabularnewline
46 & -0.09003 & -0.6237 & 0.267873 \tabularnewline
47 & 0.009249 & 0.0641 & 0.474588 \tabularnewline
48 & NA & NA & NA \tabularnewline
\hline
\end{tabular}
%Source: https://freestatistics.org/blog/index.php?pk=35762&T=2

[TABLE]
[ROW][C]Partial Autocorrelation Function[/C][/ROW]
[ROW][C]Time lag k[/C][C]PACF(k)[/C][C]T-STAT[/C][C]P-value[/C][/ROW]
[ROW][C]1[/C][C]-0.042594[/C][C]-0.2951[/C][C]0.384595[/C][/ROW]
[ROW][C]2[/C][C]0.098879[/C][C]0.6851[/C][C]0.248302[/C][/ROW]
[ROW][C]3[/C][C]0.165223[/C][C]1.1447[/C][C]0.129006[/C][/ROW]
[ROW][C]4[/C][C]0.10486[/C][C]0.7265[/C][C]0.235532[/C][/ROW]
[ROW][C]5[/C][C]0.015539[/C][C]0.1077[/C][C]0.457359[/C][/ROW]
[ROW][C]6[/C][C]0.00412[/C][C]0.0285[/C][C]0.488674[/C][/ROW]
[ROW][C]7[/C][C]-0.015561[/C][C]-0.1078[/C][C]0.457297[/C][/ROW]
[ROW][C]8[/C][C]0.092697[/C][C]0.6422[/C][C]0.261893[/C][/ROW]
[ROW][C]9[/C][C]-0.021674[/C][C]-0.1502[/C][C]0.440632[/C][/ROW]
[ROW][C]10[/C][C]-0.108174[/C][C]-0.7495[/C][C]0.228621[/C][/ROW]
[ROW][C]11[/C][C]0.251361[/C][C]1.7415[/C][C]0.044003[/C][/ROW]
[ROW][C]12[/C][C]-0.147589[/C][C]-1.0225[/C][C]0.155829[/C][/ROW]
[ROW][C]13[/C][C]-0.150022[/C][C]-1.0394[/C][C]0.151917[/C][/ROW]
[ROW][C]14[/C][C]0.001797[/C][C]0.0124[/C][C]0.49506[/C][/ROW]
[ROW][C]15[/C][C]-0.049671[/C][C]-0.3441[/C][C]0.366127[/C][/ROW]
[ROW][C]16[/C][C]-0.084966[/C][C]-0.5887[/C][C]0.279425[/C][/ROW]
[ROW][C]17[/C][C]-0.047076[/C][C]-0.3261[/C][C]0.372865[/C][/ROW]
[ROW][C]18[/C][C]-0.011388[/C][C]-0.0789[/C][C]0.468722[/C][/ROW]
[ROW][C]19[/C][C]0.034924[/C][C]0.242[/C][C]0.404922[/C][/ROW]
[ROW][C]20[/C][C]0.074421[/C][C]0.5156[/C][C]0.304248[/C][/ROW]
[ROW][C]21[/C][C]0.069523[/C][C]0.4817[/C][C]0.316114[/C][/ROW]
[ROW][C]22[/C][C]-0.020679[/C][C]-0.1433[/C][C]0.44334[/C][/ROW]
[ROW][C]23[/C][C]0.088439[/C][C]0.6127[/C][C]0.271476[/C][/ROW]
[ROW][C]24[/C][C]-0.106672[/C][C]-0.739[/C][C]0.23174[/C][/ROW]
[ROW][C]25[/C][C]-0.162382[/C][C]-1.125[/C][C]0.133088[/C][/ROW]
[ROW][C]26[/C][C]-0.079302[/C][C]-0.5494[/C][C]0.292632[/C][/ROW]
[ROW][C]27[/C][C]0.021043[/C][C]0.1458[/C][C]0.442349[/C][/ROW]
[ROW][C]28[/C][C]-0.012111[/C][C]-0.0839[/C][C]0.466741[/C][/ROW]
[ROW][C]29[/C][C]0.160384[/C][C]1.1112[/C][C]0.136014[/C][/ROW]
[ROW][C]30[/C][C]-0.023498[/C][C]-0.1628[/C][C]0.435681[/C][/ROW]
[ROW][C]31[/C][C]-0.004688[/C][C]-0.0325[/C][C]0.487113[/C][/ROW]
[ROW][C]32[/C][C]-0.062581[/C][C]-0.4336[/C][C]0.333271[/C][/ROW]
[ROW][C]33[/C][C]-0.050176[/C][C]-0.3476[/C][C]0.36482[/C][/ROW]
[ROW][C]34[/C][C]-0.13525[/C][C]-0.937[/C][C]0.176715[/C][/ROW]
[ROW][C]35[/C][C]0.041809[/C][C]0.2897[/C][C]0.386662[/C][/ROW]
[ROW][C]36[/C][C]0.012693[/C][C]0.0879[/C][C]0.465145[/C][/ROW]
[ROW][C]37[/C][C]-0.090814[/C][C]-0.6292[/C][C]0.266108[/C][/ROW]
[ROW][C]38[/C][C]0.018773[/C][C]0.1301[/C][C]0.448529[/C][/ROW]
[ROW][C]39[/C][C]0.000824[/C][C]0.0057[/C][C]0.497733[/C][/ROW]
[ROW][C]40[/C][C]-0.058102[/C][C]-0.4025[/C][C]0.344536[/C][/ROW]
[ROW][C]41[/C][C]-0.041626[/C][C]-0.2884[/C][C]0.387142[/C][/ROW]
[ROW][C]42[/C][C]-0.03374[/C][C]-0.2338[/C][C]0.408083[/C][/ROW]
[ROW][C]43[/C][C]0.050083[/C][C]0.347[/C][C]0.36506[/C][/ROW]
[ROW][C]44[/C][C]0.030623[/C][C]0.2122[/C][C]0.416439[/C][/ROW]
[ROW][C]45[/C][C]0.077834[/C][C]0.5393[/C][C]0.296103[/C][/ROW]
[ROW][C]46[/C][C]-0.09003[/C][C]-0.6237[/C][C]0.267873[/C][/ROW]
[ROW][C]47[/C][C]0.009249[/C][C]0.0641[/C][C]0.474588[/C][/ROW]
[ROW][C]48[/C][C]NA[/C][C]NA[/C][C]NA[/C][/ROW]
[/TABLE]
Source: https://freestatistics.org/blog/index.php?pk=35762&T=2

Globally Unique Identifier (entire table): ba.freestatistics.org/blog/index.php?pk=35762&T=2

As an alternative you can also use a QR Code:  

The GUIDs for individual cells are displayed in the table below:

Partial Autocorrelation Function
Time lag kPACF(k)T-STATP-value
1-0.042594-0.29510.384595
20.0988790.68510.248302
30.1652231.14470.129006
40.104860.72650.235532
50.0155390.10770.457359
60.004120.02850.488674
7-0.015561-0.10780.457297
80.0926970.64220.261893
9-0.021674-0.15020.440632
10-0.108174-0.74950.228621
110.2513611.74150.044003
12-0.147589-1.02250.155829
13-0.150022-1.03940.151917
140.0017970.01240.49506
15-0.049671-0.34410.366127
16-0.084966-0.58870.279425
17-0.047076-0.32610.372865
18-0.011388-0.07890.468722
190.0349240.2420.404922
200.0744210.51560.304248
210.0695230.48170.316114
22-0.020679-0.14330.44334
230.0884390.61270.271476
24-0.106672-0.7390.23174
25-0.162382-1.1250.133088
26-0.079302-0.54940.292632
270.0210430.14580.442349
28-0.012111-0.08390.466741
290.1603841.11120.136014
30-0.023498-0.16280.435681
31-0.004688-0.03250.487113
32-0.062581-0.43360.333271
33-0.050176-0.34760.36482
34-0.13525-0.9370.176715
350.0418090.28970.386662
360.0126930.08790.465145
37-0.090814-0.62920.266108
380.0187730.13010.448529
390.0008240.00570.497733
40-0.058102-0.40250.344536
41-0.041626-0.28840.387142
42-0.03374-0.23380.408083
430.0500830.3470.36506
440.0306230.21220.416439
450.0778340.53930.296103
46-0.09003-0.62370.267873
470.0092490.06410.474588
48NANANA


Parameters (Session):
par1 = 48 ; par2 = 1 ; par3 = 1 ; par4 = 1 ; par5 = 12 ;
Parameters (R input):
par1 = 48 ; par2 = 1 ; par3 = 1 ; par4 = 1 ; par5 = 12 ;
R code (references can be found in the software module):
if (par1 == 'Default') {
par1 = 10*log10(length(x))
} else {
par1 <- as.numeric(par1)
}
par2 <- as.numeric(par2)
par3 <- as.numeric(par3)
par4 <- as.numeric(par4)
par5 <- as.numeric(par5)
if (par2 == 0) {
x <- log(x)
} else {
x <- (x ^ par2 - 1) / par2
}
if (par3 > 0) x <- diff(x,lag=1,difference=par3)
if (par4 > 0) x <- diff(x,lag=par5,difference=par4)
bitmap(file='pic1.png')
racf <- acf(x,par1,main='Autocorrelation',xlab='lags',ylab='ACF')
dev.off()
bitmap(file='pic2.png')
rpacf <- pacf(x,par1,main='Partial Autocorrelation',xlab='lags',ylab='PACF')
dev.off()
(myacf <- c(racf$acf))
(mypacf <- c(rpacf$acf))
lengthx <- length(x)
sqrtn <- sqrt(lengthx)
load(file='createtable')
a<-table.start()
a<-table.row.start(a)
a<-table.element(a,'Autocorrelation Function',4,TRUE)
a<-table.row.end(a)
a<-table.row.start(a)
a<-table.element(a,'Time lag k',header=TRUE)
a<-table.element(a,hyperlink('basics.htm','ACF(k)','click here for more information about the Autocorrelation Function'),header=TRUE)
a<-table.element(a,'T-STAT',header=TRUE)
a<-table.element(a,'P-value',header=TRUE)
a<-table.row.end(a)
for (i in 2:(par1+1)) {
a<-table.row.start(a)
a<-table.element(a,i-1,header=TRUE)
a<-table.element(a,round(myacf[i],6))
mytstat <- myacf[i]*sqrtn
a<-table.element(a,round(mytstat,4))
a<-table.element(a,round(1-pt(abs(mytstat),lengthx),6))
a<-table.row.end(a)
}
a<-table.end(a)
table.save(a,file='mytable.tab')
a<-table.start()
a<-table.row.start(a)
a<-table.element(a,'Partial Autocorrelation Function',4,TRUE)
a<-table.row.end(a)
a<-table.row.start(a)
a<-table.element(a,'Time lag k',header=TRUE)
a<-table.element(a,hyperlink('basics.htm','PACF(k)','click here for more information about the Partial Autocorrelation Function'),header=TRUE)
a<-table.element(a,'T-STAT',header=TRUE)
a<-table.element(a,'P-value',header=TRUE)
a<-table.row.end(a)
for (i in 1:par1) {
a<-table.row.start(a)
a<-table.element(a,i,header=TRUE)
a<-table.element(a,round(mypacf[i],6))
mytstat <- mypacf[i]*sqrtn
a<-table.element(a,round(mytstat,4))
a<-table.element(a,round(1-pt(abs(mytstat),lengthx),6))
a<-table.row.end(a)
}
a<-table.end(a)
table.save(a,file='mytable1.tab')