Free Statistics
of Irreproducible Research!
Description of Statistical Computation | |||||||||||||||||||||||||||||||||||||||||
|---|---|---|---|---|---|---|---|---|---|---|---|---|---|---|---|---|---|---|---|---|---|---|---|---|---|---|---|---|---|---|---|---|---|---|---|---|---|---|---|---|---|
| Author's title | |||||||||||||||||||||||||||||||||||||||||
| Author | *Unverified author* | ||||||||||||||||||||||||||||||||||||||||
| R Software Module | rwasp_univariatedataseries.wasp | ||||||||||||||||||||||||||||||||||||||||
| Title produced by software | Univariate Data Series | ||||||||||||||||||||||||||||||||||||||||
| Date of computation | Sun, 21 Dec 2008 11:33:47 -0700 | ||||||||||||||||||||||||||||||||||||||||
| Cite this page as follows | Statistical Computations at FreeStatistics.org, Office for Research Development and Education, URL https://freestatistics.org/blog/index.php?v=date/2008/Dec/21/t1229884457pyzpz1ynhdghh4q.htm/, Retrieved Sun, 19 May 2024 08:45:40 +0000 | ||||||||||||||||||||||||||||||||||||||||
| Statistical Computations at FreeStatistics.org, Office for Research Development and Education, URL https://freestatistics.org/blog/index.php?pk=35741, Retrieved Sun, 19 May 2024 08:45:40 +0000 | |||||||||||||||||||||||||||||||||||||||||
| QR Codes: | |||||||||||||||||||||||||||||||||||||||||
|
| |||||||||||||||||||||||||||||||||||||||||
| Original text written by user: | |||||||||||||||||||||||||||||||||||||||||
| IsPrivate? | No (this computation is public) | ||||||||||||||||||||||||||||||||||||||||
| User-defined keywords | |||||||||||||||||||||||||||||||||||||||||
| Estimated Impact | 161 | ||||||||||||||||||||||||||||||||||||||||
Tree of Dependent Computations | |||||||||||||||||||||||||||||||||||||||||
| Family? (F = Feedback message, R = changed R code, M = changed R Module, P = changed Parameters, D = changed Data) | |||||||||||||||||||||||||||||||||||||||||
| - [Univariate Data Series] [Buitenlandse Hand...] [2008-10-13 22:33:57] [bd51eba1292ec8d03a55225bfbdeaf98] - PD [Univariate Data Series] [Tijdreeks - Food ...] [2008-12-10 08:38:14] [6f54f97492451bf8edc5dd186465ee4a] - PD [Univariate Data Series] [Belgian Export: F...] [2008-12-21 18:32:05] [d7f17de546c455a6cc3e244ffe795733] - PD [Univariate Data Series] [Belgian Export: D...] [2008-12-21 18:33:47] [4ef5c191fa12c0a7497d8cf4a02b2cfe] [Current] - PD [Univariate Data Series] [Belgian Export: N...] [2008-12-21 18:35:28] [d7f17de546c455a6cc3e244ffe795733] | |||||||||||||||||||||||||||||||||||||||||
| Feedback Forum | |||||||||||||||||||||||||||||||||||||||||
Post a new message | |||||||||||||||||||||||||||||||||||||||||
Dataset | |||||||||||||||||||||||||||||||||||||||||
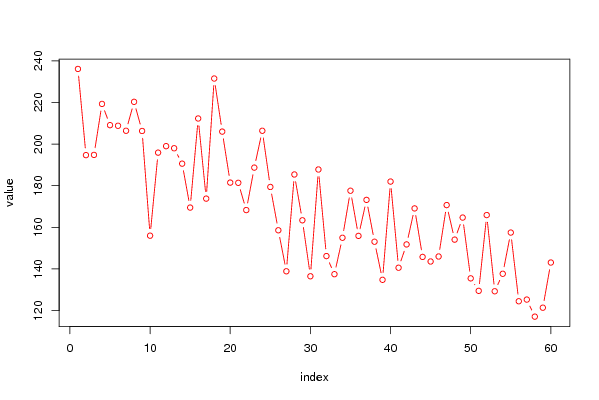
| Dataseries X: | |||||||||||||||||||||||||||||||||||||||||
236.1 194.7 194.8 219.3 209.1 208.8 206.4 220.3 206.3 156.0 195.9 199.0 198.0 190.6 169.5 212.3 173.8 231.5 206.0 181.5 181.4 168.3 188.7 206.4 179.4 158.6 138.9 185.4 163.4 136.5 187.8 146.2 137.5 155.0 177.6 155.9 173.2 153.1 134.8 182.0 140.6 151.8 169.1 145.8 143.6 146.0 170.7 154.1 164.7 135.5 129.5 165.9 129.3 137.7 157.5 124.5 125.3 117.1 121.4 143.1 | |||||||||||||||||||||||||||||||||||||||||
Tables (Output of Computation) | |||||||||||||||||||||||||||||||||||||||||
| |||||||||||||||||||||||||||||||||||||||||
Figures (Output of Computation) | |||||||||||||||||||||||||||||||||||||||||
Input Parameters & R Code | |||||||||||||||||||||||||||||||||||||||||
| Parameters (Session): | |||||||||||||||||||||||||||||||||||||||||
| par1 = Belgian Export: Denemarken ; par2 = http://www.nbb.be/belgostat/PresentationLinker?TableId=365000038&Lang=E ; par3 = Belgian Export: Denemarken ; | |||||||||||||||||||||||||||||||||||||||||
| Parameters (R input): | |||||||||||||||||||||||||||||||||||||||||
| par1 = Belgian Export: Denemarken ; par2 = http://www.nbb.be/belgostat/PresentationLinker?TableId=365000038&Lang=E ; par3 = Belgian Export: Denemarken ; | |||||||||||||||||||||||||||||||||||||||||
| R code (references can be found in the software module): | |||||||||||||||||||||||||||||||||||||||||
bitmap(file='test1.png') | |||||||||||||||||||||||||||||||||||||||||