Free Statistics

of Irreproducible Research!

Author's title

Author*Unverified author*
R Software Modulerwasp_autocorrelation.wasp
Title produced by software(Partial) Autocorrelation Function
Date of computationSun, 21 Dec 2008 11:02:12 -0700
Cite this page as followsStatistical Computations at FreeStatistics.org, Office for Research Development and Education, URL https://freestatistics.org/blog/index.php?v=date/2008/Dec/21/t1229882568kquchf1519695fv.htm/, Retrieved Sun, 19 May 2024 11:32:50 +0000
Statistical Computations at FreeStatistics.org, Office for Research Development and Education, URL https://freestatistics.org/blog/index.php?pk=35723, Retrieved Sun, 19 May 2024 11:32:50 +0000
QR Codes:

Original text written by user:
IsPrivate?No (this computation is public)
User-defined keywords
Estimated Impact127
Family? (F = Feedback message, R = changed R code, M = changed R Module, P = changed Parameters, D = changed Data)
-       [(Partial) Autocorrelation Function] [] [2008-12-21 18:02:12] [a2d5a6282476ec2b5afae6fb53d308f8] [Current]
Feedback Forum

Post a new message
Dataseries X:
10244
10511
10812
10738
10171
9721
9897
9828
9924
10371
10846
10413
10709
10662
10570
10297
10635
10872
10296
10383
10431
10574
10653
10805
10872
10625
10407
10463
10556
10646
10702
11353
11346
11451
11964
12574
13031
13812
14544
14931
14886
16005
17064
15168
16050
15839
15137
14954
15648
15305
15579
16348
15928
16171
15937
15713
15594
15683
16438
17032


Summary of computational transaction
Raw Inputview raw input (R code)
Raw Outputview raw output of R engine
Computing time3 seconds
R Server'Sir Ronald Aylmer Fisher' @ 193.190.124.24

\begin{tabular}{lllllllll}
\hline
Summary of computational transaction \tabularnewline
Raw Input & view raw input (R code)  \tabularnewline
Raw Output & view raw output of R engine  \tabularnewline
Computing time & 3 seconds \tabularnewline
R Server & 'Sir Ronald Aylmer Fisher' @ 193.190.124.24 \tabularnewline
\hline
\end{tabular}
%Source: https://freestatistics.org/blog/index.php?pk=35723&T=0

[TABLE]
[ROW][C]Summary of computational transaction[/C][/ROW]
[ROW][C]Raw Input[/C][C]view raw input (R code) [/C][/ROW]
[ROW][C]Raw Output[/C][C]view raw output of R engine [/C][/ROW]
[ROW][C]Computing time[/C][C]3 seconds[/C][/ROW]
[ROW][C]R Server[/C][C]'Sir Ronald Aylmer Fisher' @ 193.190.124.24[/C][/ROW]
[/TABLE]
Source: https://freestatistics.org/blog/index.php?pk=35723&T=0

Globally Unique Identifier (entire table): ba.freestatistics.org/blog/index.php?pk=35723&T=0

As an alternative you can also use a QR Code:  

The GUIDs for individual cells are displayed in the table below:

Summary of computational transaction
Raw Inputview raw input (R code)
Raw Outputview raw output of R engine
Computing time3 seconds
R Server'Sir Ronald Aylmer Fisher' @ 193.190.124.24


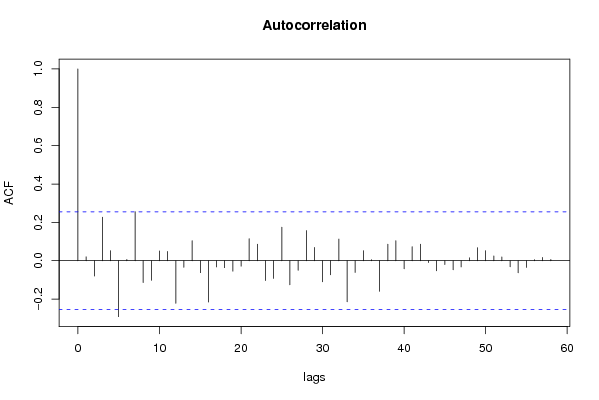
Autocorrelation Function
Time lag kACF(k)T-STATP-value
10.0201970.15510.438622
2-0.079338-0.60940.272298
30.2265511.74020.043522
40.052050.39980.345373
5-0.291641-2.24010.014431
60.0064790.04980.480239
70.2556471.96370.027144
8-0.113601-0.87260.193213
9-0.102377-0.78640.217397
100.0511440.39280.347924
110.0478180.36730.357356
12-0.222249-1.70710.046529
13-0.034235-0.2630.396747
140.1042060.80040.213338
15-0.062341-0.47890.316907
16-0.215774-1.65740.051375
17-0.032275-0.24790.402532
18-0.036102-0.27730.391258
19-0.054398-0.41780.338792
20-0.028277-0.21720.414402
210.1146780.88090.190984
220.0862290.66230.255166
23-0.103495-0.7950.21491
24-0.092107-0.70750.241024
250.1747911.34260.092273
26-0.125365-0.96290.169752
27-0.050184-0.38550.350639
280.1569631.20570.116382
290.0691420.53110.298674
30-0.11022-0.84660.200314
31-0.07314-0.56180.28819
320.1127250.86590.195037
33-0.213802-1.64220.05293
34-0.060957-0.46820.320676
350.0520710.40.345314
360.0052280.04020.484051
37-0.159637-1.22620.112499
380.0860220.66070.255673
390.1040440.79920.213697
40-0.041796-0.3210.374658
410.0728380.55950.288975
420.0855740.65730.256771
43-0.009453-0.07260.47118
44-0.052094-0.40010.34525
45-0.019747-0.15170.439978
46-0.046956-0.36070.359814
47-0.032243-0.24770.402626
480.0148850.11430.454681
490.0681720.52360.301246
500.0522970.40170.344679
510.0249670.19180.424289
520.0192790.14810.441389
53-0.031253-0.24010.405559
54-0.062583-0.48070.316249
55-0.0349-0.26810.394788
560.004930.03790.484962
570.0171020.13140.447967
580.0065130.050.480136
59NANANA
60NANANA

\begin{tabular}{lllllllll}
\hline
Autocorrelation Function \tabularnewline
Time lag k & ACF(k) & T-STAT & P-value \tabularnewline
1 & 0.020197 & 0.1551 & 0.438622 \tabularnewline
2 & -0.079338 & -0.6094 & 0.272298 \tabularnewline
3 & 0.226551 & 1.7402 & 0.043522 \tabularnewline
4 & 0.05205 & 0.3998 & 0.345373 \tabularnewline
5 & -0.291641 & -2.2401 & 0.014431 \tabularnewline
6 & 0.006479 & 0.0498 & 0.480239 \tabularnewline
7 & 0.255647 & 1.9637 & 0.027144 \tabularnewline
8 & -0.113601 & -0.8726 & 0.193213 \tabularnewline
9 & -0.102377 & -0.7864 & 0.217397 \tabularnewline
10 & 0.051144 & 0.3928 & 0.347924 \tabularnewline
11 & 0.047818 & 0.3673 & 0.357356 \tabularnewline
12 & -0.222249 & -1.7071 & 0.046529 \tabularnewline
13 & -0.034235 & -0.263 & 0.396747 \tabularnewline
14 & 0.104206 & 0.8004 & 0.213338 \tabularnewline
15 & -0.062341 & -0.4789 & 0.316907 \tabularnewline
16 & -0.215774 & -1.6574 & 0.051375 \tabularnewline
17 & -0.032275 & -0.2479 & 0.402532 \tabularnewline
18 & -0.036102 & -0.2773 & 0.391258 \tabularnewline
19 & -0.054398 & -0.4178 & 0.338792 \tabularnewline
20 & -0.028277 & -0.2172 & 0.414402 \tabularnewline
21 & 0.114678 & 0.8809 & 0.190984 \tabularnewline
22 & 0.086229 & 0.6623 & 0.255166 \tabularnewline
23 & -0.103495 & -0.795 & 0.21491 \tabularnewline
24 & -0.092107 & -0.7075 & 0.241024 \tabularnewline
25 & 0.174791 & 1.3426 & 0.092273 \tabularnewline
26 & -0.125365 & -0.9629 & 0.169752 \tabularnewline
27 & -0.050184 & -0.3855 & 0.350639 \tabularnewline
28 & 0.156963 & 1.2057 & 0.116382 \tabularnewline
29 & 0.069142 & 0.5311 & 0.298674 \tabularnewline
30 & -0.11022 & -0.8466 & 0.200314 \tabularnewline
31 & -0.07314 & -0.5618 & 0.28819 \tabularnewline
32 & 0.112725 & 0.8659 & 0.195037 \tabularnewline
33 & -0.213802 & -1.6422 & 0.05293 \tabularnewline
34 & -0.060957 & -0.4682 & 0.320676 \tabularnewline
35 & 0.052071 & 0.4 & 0.345314 \tabularnewline
36 & 0.005228 & 0.0402 & 0.484051 \tabularnewline
37 & -0.159637 & -1.2262 & 0.112499 \tabularnewline
38 & 0.086022 & 0.6607 & 0.255673 \tabularnewline
39 & 0.104044 & 0.7992 & 0.213697 \tabularnewline
40 & -0.041796 & -0.321 & 0.374658 \tabularnewline
41 & 0.072838 & 0.5595 & 0.288975 \tabularnewline
42 & 0.085574 & 0.6573 & 0.256771 \tabularnewline
43 & -0.009453 & -0.0726 & 0.47118 \tabularnewline
44 & -0.052094 & -0.4001 & 0.34525 \tabularnewline
45 & -0.019747 & -0.1517 & 0.439978 \tabularnewline
46 & -0.046956 & -0.3607 & 0.359814 \tabularnewline
47 & -0.032243 & -0.2477 & 0.402626 \tabularnewline
48 & 0.014885 & 0.1143 & 0.454681 \tabularnewline
49 & 0.068172 & 0.5236 & 0.301246 \tabularnewline
50 & 0.052297 & 0.4017 & 0.344679 \tabularnewline
51 & 0.024967 & 0.1918 & 0.424289 \tabularnewline
52 & 0.019279 & 0.1481 & 0.441389 \tabularnewline
53 & -0.031253 & -0.2401 & 0.405559 \tabularnewline
54 & -0.062583 & -0.4807 & 0.316249 \tabularnewline
55 & -0.0349 & -0.2681 & 0.394788 \tabularnewline
56 & 0.00493 & 0.0379 & 0.484962 \tabularnewline
57 & 0.017102 & 0.1314 & 0.447967 \tabularnewline
58 & 0.006513 & 0.05 & 0.480136 \tabularnewline
59 & NA & NA & NA \tabularnewline
60 & NA & NA & NA \tabularnewline
\hline
\end{tabular}
%Source: https://freestatistics.org/blog/index.php?pk=35723&T=1

[TABLE]
[ROW][C]Autocorrelation Function[/C][/ROW]
[ROW][C]Time lag k[/C][C]ACF(k)[/C][C]T-STAT[/C][C]P-value[/C][/ROW]
[ROW][C]1[/C][C]0.020197[/C][C]0.1551[/C][C]0.438622[/C][/ROW]
[ROW][C]2[/C][C]-0.079338[/C][C]-0.6094[/C][C]0.272298[/C][/ROW]
[ROW][C]3[/C][C]0.226551[/C][C]1.7402[/C][C]0.043522[/C][/ROW]
[ROW][C]4[/C][C]0.05205[/C][C]0.3998[/C][C]0.345373[/C][/ROW]
[ROW][C]5[/C][C]-0.291641[/C][C]-2.2401[/C][C]0.014431[/C][/ROW]
[ROW][C]6[/C][C]0.006479[/C][C]0.0498[/C][C]0.480239[/C][/ROW]
[ROW][C]7[/C][C]0.255647[/C][C]1.9637[/C][C]0.027144[/C][/ROW]
[ROW][C]8[/C][C]-0.113601[/C][C]-0.8726[/C][C]0.193213[/C][/ROW]
[ROW][C]9[/C][C]-0.102377[/C][C]-0.7864[/C][C]0.217397[/C][/ROW]
[ROW][C]10[/C][C]0.051144[/C][C]0.3928[/C][C]0.347924[/C][/ROW]
[ROW][C]11[/C][C]0.047818[/C][C]0.3673[/C][C]0.357356[/C][/ROW]
[ROW][C]12[/C][C]-0.222249[/C][C]-1.7071[/C][C]0.046529[/C][/ROW]
[ROW][C]13[/C][C]-0.034235[/C][C]-0.263[/C][C]0.396747[/C][/ROW]
[ROW][C]14[/C][C]0.104206[/C][C]0.8004[/C][C]0.213338[/C][/ROW]
[ROW][C]15[/C][C]-0.062341[/C][C]-0.4789[/C][C]0.316907[/C][/ROW]
[ROW][C]16[/C][C]-0.215774[/C][C]-1.6574[/C][C]0.051375[/C][/ROW]
[ROW][C]17[/C][C]-0.032275[/C][C]-0.2479[/C][C]0.402532[/C][/ROW]
[ROW][C]18[/C][C]-0.036102[/C][C]-0.2773[/C][C]0.391258[/C][/ROW]
[ROW][C]19[/C][C]-0.054398[/C][C]-0.4178[/C][C]0.338792[/C][/ROW]
[ROW][C]20[/C][C]-0.028277[/C][C]-0.2172[/C][C]0.414402[/C][/ROW]
[ROW][C]21[/C][C]0.114678[/C][C]0.8809[/C][C]0.190984[/C][/ROW]
[ROW][C]22[/C][C]0.086229[/C][C]0.6623[/C][C]0.255166[/C][/ROW]
[ROW][C]23[/C][C]-0.103495[/C][C]-0.795[/C][C]0.21491[/C][/ROW]
[ROW][C]24[/C][C]-0.092107[/C][C]-0.7075[/C][C]0.241024[/C][/ROW]
[ROW][C]25[/C][C]0.174791[/C][C]1.3426[/C][C]0.092273[/C][/ROW]
[ROW][C]26[/C][C]-0.125365[/C][C]-0.9629[/C][C]0.169752[/C][/ROW]
[ROW][C]27[/C][C]-0.050184[/C][C]-0.3855[/C][C]0.350639[/C][/ROW]
[ROW][C]28[/C][C]0.156963[/C][C]1.2057[/C][C]0.116382[/C][/ROW]
[ROW][C]29[/C][C]0.069142[/C][C]0.5311[/C][C]0.298674[/C][/ROW]
[ROW][C]30[/C][C]-0.11022[/C][C]-0.8466[/C][C]0.200314[/C][/ROW]
[ROW][C]31[/C][C]-0.07314[/C][C]-0.5618[/C][C]0.28819[/C][/ROW]
[ROW][C]32[/C][C]0.112725[/C][C]0.8659[/C][C]0.195037[/C][/ROW]
[ROW][C]33[/C][C]-0.213802[/C][C]-1.6422[/C][C]0.05293[/C][/ROW]
[ROW][C]34[/C][C]-0.060957[/C][C]-0.4682[/C][C]0.320676[/C][/ROW]
[ROW][C]35[/C][C]0.052071[/C][C]0.4[/C][C]0.345314[/C][/ROW]
[ROW][C]36[/C][C]0.005228[/C][C]0.0402[/C][C]0.484051[/C][/ROW]
[ROW][C]37[/C][C]-0.159637[/C][C]-1.2262[/C][C]0.112499[/C][/ROW]
[ROW][C]38[/C][C]0.086022[/C][C]0.6607[/C][C]0.255673[/C][/ROW]
[ROW][C]39[/C][C]0.104044[/C][C]0.7992[/C][C]0.213697[/C][/ROW]
[ROW][C]40[/C][C]-0.041796[/C][C]-0.321[/C][C]0.374658[/C][/ROW]
[ROW][C]41[/C][C]0.072838[/C][C]0.5595[/C][C]0.288975[/C][/ROW]
[ROW][C]42[/C][C]0.085574[/C][C]0.6573[/C][C]0.256771[/C][/ROW]
[ROW][C]43[/C][C]-0.009453[/C][C]-0.0726[/C][C]0.47118[/C][/ROW]
[ROW][C]44[/C][C]-0.052094[/C][C]-0.4001[/C][C]0.34525[/C][/ROW]
[ROW][C]45[/C][C]-0.019747[/C][C]-0.1517[/C][C]0.439978[/C][/ROW]
[ROW][C]46[/C][C]-0.046956[/C][C]-0.3607[/C][C]0.359814[/C][/ROW]
[ROW][C]47[/C][C]-0.032243[/C][C]-0.2477[/C][C]0.402626[/C][/ROW]
[ROW][C]48[/C][C]0.014885[/C][C]0.1143[/C][C]0.454681[/C][/ROW]
[ROW][C]49[/C][C]0.068172[/C][C]0.5236[/C][C]0.301246[/C][/ROW]
[ROW][C]50[/C][C]0.052297[/C][C]0.4017[/C][C]0.344679[/C][/ROW]
[ROW][C]51[/C][C]0.024967[/C][C]0.1918[/C][C]0.424289[/C][/ROW]
[ROW][C]52[/C][C]0.019279[/C][C]0.1481[/C][C]0.441389[/C][/ROW]
[ROW][C]53[/C][C]-0.031253[/C][C]-0.2401[/C][C]0.405559[/C][/ROW]
[ROW][C]54[/C][C]-0.062583[/C][C]-0.4807[/C][C]0.316249[/C][/ROW]
[ROW][C]55[/C][C]-0.0349[/C][C]-0.2681[/C][C]0.394788[/C][/ROW]
[ROW][C]56[/C][C]0.00493[/C][C]0.0379[/C][C]0.484962[/C][/ROW]
[ROW][C]57[/C][C]0.017102[/C][C]0.1314[/C][C]0.447967[/C][/ROW]
[ROW][C]58[/C][C]0.006513[/C][C]0.05[/C][C]0.480136[/C][/ROW]
[ROW][C]59[/C][C]NA[/C][C]NA[/C][C]NA[/C][/ROW]
[ROW][C]60[/C][C]NA[/C][C]NA[/C][C]NA[/C][/ROW]
[/TABLE]
Source: https://freestatistics.org/blog/index.php?pk=35723&T=1

Globally Unique Identifier (entire table): ba.freestatistics.org/blog/index.php?pk=35723&T=1

As an alternative you can also use a QR Code:  

The GUIDs for individual cells are displayed in the table below:

Autocorrelation Function
Time lag kACF(k)T-STATP-value
10.0201970.15510.438622
2-0.079338-0.60940.272298
30.2265511.74020.043522
40.052050.39980.345373
5-0.291641-2.24010.014431
60.0064790.04980.480239
70.2556471.96370.027144
8-0.113601-0.87260.193213
9-0.102377-0.78640.217397
100.0511440.39280.347924
110.0478180.36730.357356
12-0.222249-1.70710.046529
13-0.034235-0.2630.396747
140.1042060.80040.213338
15-0.062341-0.47890.316907
16-0.215774-1.65740.051375
17-0.032275-0.24790.402532
18-0.036102-0.27730.391258
19-0.054398-0.41780.338792
20-0.028277-0.21720.414402
210.1146780.88090.190984
220.0862290.66230.255166
23-0.103495-0.7950.21491
24-0.092107-0.70750.241024
250.1747911.34260.092273
26-0.125365-0.96290.169752
27-0.050184-0.38550.350639
280.1569631.20570.116382
290.0691420.53110.298674
30-0.11022-0.84660.200314
31-0.07314-0.56180.28819
320.1127250.86590.195037
33-0.213802-1.64220.05293
34-0.060957-0.46820.320676
350.0520710.40.345314
360.0052280.04020.484051
37-0.159637-1.22620.112499
380.0860220.66070.255673
390.1040440.79920.213697
40-0.041796-0.3210.374658
410.0728380.55950.288975
420.0855740.65730.256771
43-0.009453-0.07260.47118
44-0.052094-0.40010.34525
45-0.019747-0.15170.439978
46-0.046956-0.36070.359814
47-0.032243-0.24770.402626
480.0148850.11430.454681
490.0681720.52360.301246
500.0522970.40170.344679
510.0249670.19180.424289
520.0192790.14810.441389
53-0.031253-0.24010.405559
54-0.062583-0.48070.316249
55-0.0349-0.26810.394788
560.004930.03790.484962
570.0171020.13140.447967
580.0065130.050.480136
59NANANA
60NANANA


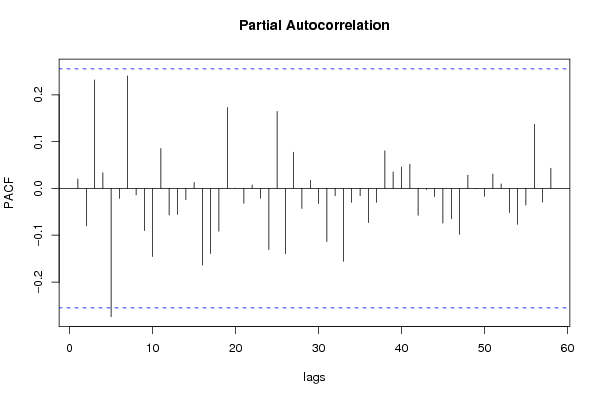
Partial Autocorrelation Function
Time lag kPACF(k)T-STATP-value
10.0201970.15510.438622
2-0.079778-0.61280.271186
30.2314591.77790.040289
40.0335320.25760.398819
5-0.2739-2.10390.019831
6-0.021323-0.16380.43523
70.2400111.84360.035136
8-0.013892-0.10670.457693
9-0.08979-0.68970.246547
10-0.145507-1.11770.134122
110.0850880.65360.257963
12-0.057024-0.4380.33149
13-0.055473-0.42610.335795
14-0.024048-0.18470.427043
150.0127230.09770.46124
16-0.163736-1.25770.106731
17-0.138942-1.06720.145107
18-0.091287-0.70120.24297
190.1730371.32910.094462
200.0003060.00230.499068
21-0.031668-0.24320.404328
220.0074960.05760.477138
23-0.02095-0.16090.436353
24-0.130373-1.00140.160358
250.1642121.26130.106076
26-0.139547-1.07190.14407
270.0774620.5950.277059
28-0.042657-0.32770.372167
290.0173260.13310.447289
30-0.032165-0.24710.402859
31-0.113596-0.87260.193223
32-0.015676-0.12040.452283
33-0.155448-1.1940.118624
34-0.029743-0.22850.410039
35-0.015934-0.12240.451503
36-0.072966-0.56050.288644
37-0.029737-0.22840.410058
380.0802760.61660.269933
390.0351060.26970.394185
400.0456850.35090.363452
410.0517040.39710.346347
42-0.057202-0.43940.330996
43-0.002315-0.01780.492935
44-0.017267-0.13260.44747
45-0.07379-0.56680.286502
46-0.064706-0.4970.310511
47-0.097784-0.75110.227792
480.0280840.21570.414975
49-0.000607-0.00470.498148
50-0.016936-0.13010.448469
510.0305930.2350.407514
520.0095650.07350.47084
53-0.051468-0.39530.347011
54-0.076668-0.58890.279088
55-0.035625-0.27360.392659
560.1371761.05370.148166
57-0.029122-0.22370.411885
580.0431520.33150.370736
59NANANA
60NANANA

\begin{tabular}{lllllllll}
\hline
Partial Autocorrelation Function \tabularnewline
Time lag k & PACF(k) & T-STAT & P-value \tabularnewline
1 & 0.020197 & 0.1551 & 0.438622 \tabularnewline
2 & -0.079778 & -0.6128 & 0.271186 \tabularnewline
3 & 0.231459 & 1.7779 & 0.040289 \tabularnewline
4 & 0.033532 & 0.2576 & 0.398819 \tabularnewline
5 & -0.2739 & -2.1039 & 0.019831 \tabularnewline
6 & -0.021323 & -0.1638 & 0.43523 \tabularnewline
7 & 0.240011 & 1.8436 & 0.035136 \tabularnewline
8 & -0.013892 & -0.1067 & 0.457693 \tabularnewline
9 & -0.08979 & -0.6897 & 0.246547 \tabularnewline
10 & -0.145507 & -1.1177 & 0.134122 \tabularnewline
11 & 0.085088 & 0.6536 & 0.257963 \tabularnewline
12 & -0.057024 & -0.438 & 0.33149 \tabularnewline
13 & -0.055473 & -0.4261 & 0.335795 \tabularnewline
14 & -0.024048 & -0.1847 & 0.427043 \tabularnewline
15 & 0.012723 & 0.0977 & 0.46124 \tabularnewline
16 & -0.163736 & -1.2577 & 0.106731 \tabularnewline
17 & -0.138942 & -1.0672 & 0.145107 \tabularnewline
18 & -0.091287 & -0.7012 & 0.24297 \tabularnewline
19 & 0.173037 & 1.3291 & 0.094462 \tabularnewline
20 & 0.000306 & 0.0023 & 0.499068 \tabularnewline
21 & -0.031668 & -0.2432 & 0.404328 \tabularnewline
22 & 0.007496 & 0.0576 & 0.477138 \tabularnewline
23 & -0.02095 & -0.1609 & 0.436353 \tabularnewline
24 & -0.130373 & -1.0014 & 0.160358 \tabularnewline
25 & 0.164212 & 1.2613 & 0.106076 \tabularnewline
26 & -0.139547 & -1.0719 & 0.14407 \tabularnewline
27 & 0.077462 & 0.595 & 0.277059 \tabularnewline
28 & -0.042657 & -0.3277 & 0.372167 \tabularnewline
29 & 0.017326 & 0.1331 & 0.447289 \tabularnewline
30 & -0.032165 & -0.2471 & 0.402859 \tabularnewline
31 & -0.113596 & -0.8726 & 0.193223 \tabularnewline
32 & -0.015676 & -0.1204 & 0.452283 \tabularnewline
33 & -0.155448 & -1.194 & 0.118624 \tabularnewline
34 & -0.029743 & -0.2285 & 0.410039 \tabularnewline
35 & -0.015934 & -0.1224 & 0.451503 \tabularnewline
36 & -0.072966 & -0.5605 & 0.288644 \tabularnewline
37 & -0.029737 & -0.2284 & 0.410058 \tabularnewline
38 & 0.080276 & 0.6166 & 0.269933 \tabularnewline
39 & 0.035106 & 0.2697 & 0.394185 \tabularnewline
40 & 0.045685 & 0.3509 & 0.363452 \tabularnewline
41 & 0.051704 & 0.3971 & 0.346347 \tabularnewline
42 & -0.057202 & -0.4394 & 0.330996 \tabularnewline
43 & -0.002315 & -0.0178 & 0.492935 \tabularnewline
44 & -0.017267 & -0.1326 & 0.44747 \tabularnewline
45 & -0.07379 & -0.5668 & 0.286502 \tabularnewline
46 & -0.064706 & -0.497 & 0.310511 \tabularnewline
47 & -0.097784 & -0.7511 & 0.227792 \tabularnewline
48 & 0.028084 & 0.2157 & 0.414975 \tabularnewline
49 & -0.000607 & -0.0047 & 0.498148 \tabularnewline
50 & -0.016936 & -0.1301 & 0.448469 \tabularnewline
51 & 0.030593 & 0.235 & 0.407514 \tabularnewline
52 & 0.009565 & 0.0735 & 0.47084 \tabularnewline
53 & -0.051468 & -0.3953 & 0.347011 \tabularnewline
54 & -0.076668 & -0.5889 & 0.279088 \tabularnewline
55 & -0.035625 & -0.2736 & 0.392659 \tabularnewline
56 & 0.137176 & 1.0537 & 0.148166 \tabularnewline
57 & -0.029122 & -0.2237 & 0.411885 \tabularnewline
58 & 0.043152 & 0.3315 & 0.370736 \tabularnewline
59 & NA & NA & NA \tabularnewline
60 & NA & NA & NA \tabularnewline
\hline
\end{tabular}
%Source: https://freestatistics.org/blog/index.php?pk=35723&T=2

[TABLE]
[ROW][C]Partial Autocorrelation Function[/C][/ROW]
[ROW][C]Time lag k[/C][C]PACF(k)[/C][C]T-STAT[/C][C]P-value[/C][/ROW]
[ROW][C]1[/C][C]0.020197[/C][C]0.1551[/C][C]0.438622[/C][/ROW]
[ROW][C]2[/C][C]-0.079778[/C][C]-0.6128[/C][C]0.271186[/C][/ROW]
[ROW][C]3[/C][C]0.231459[/C][C]1.7779[/C][C]0.040289[/C][/ROW]
[ROW][C]4[/C][C]0.033532[/C][C]0.2576[/C][C]0.398819[/C][/ROW]
[ROW][C]5[/C][C]-0.2739[/C][C]-2.1039[/C][C]0.019831[/C][/ROW]
[ROW][C]6[/C][C]-0.021323[/C][C]-0.1638[/C][C]0.43523[/C][/ROW]
[ROW][C]7[/C][C]0.240011[/C][C]1.8436[/C][C]0.035136[/C][/ROW]
[ROW][C]8[/C][C]-0.013892[/C][C]-0.1067[/C][C]0.457693[/C][/ROW]
[ROW][C]9[/C][C]-0.08979[/C][C]-0.6897[/C][C]0.246547[/C][/ROW]
[ROW][C]10[/C][C]-0.145507[/C][C]-1.1177[/C][C]0.134122[/C][/ROW]
[ROW][C]11[/C][C]0.085088[/C][C]0.6536[/C][C]0.257963[/C][/ROW]
[ROW][C]12[/C][C]-0.057024[/C][C]-0.438[/C][C]0.33149[/C][/ROW]
[ROW][C]13[/C][C]-0.055473[/C][C]-0.4261[/C][C]0.335795[/C][/ROW]
[ROW][C]14[/C][C]-0.024048[/C][C]-0.1847[/C][C]0.427043[/C][/ROW]
[ROW][C]15[/C][C]0.012723[/C][C]0.0977[/C][C]0.46124[/C][/ROW]
[ROW][C]16[/C][C]-0.163736[/C][C]-1.2577[/C][C]0.106731[/C][/ROW]
[ROW][C]17[/C][C]-0.138942[/C][C]-1.0672[/C][C]0.145107[/C][/ROW]
[ROW][C]18[/C][C]-0.091287[/C][C]-0.7012[/C][C]0.24297[/C][/ROW]
[ROW][C]19[/C][C]0.173037[/C][C]1.3291[/C][C]0.094462[/C][/ROW]
[ROW][C]20[/C][C]0.000306[/C][C]0.0023[/C][C]0.499068[/C][/ROW]
[ROW][C]21[/C][C]-0.031668[/C][C]-0.2432[/C][C]0.404328[/C][/ROW]
[ROW][C]22[/C][C]0.007496[/C][C]0.0576[/C][C]0.477138[/C][/ROW]
[ROW][C]23[/C][C]-0.02095[/C][C]-0.1609[/C][C]0.436353[/C][/ROW]
[ROW][C]24[/C][C]-0.130373[/C][C]-1.0014[/C][C]0.160358[/C][/ROW]
[ROW][C]25[/C][C]0.164212[/C][C]1.2613[/C][C]0.106076[/C][/ROW]
[ROW][C]26[/C][C]-0.139547[/C][C]-1.0719[/C][C]0.14407[/C][/ROW]
[ROW][C]27[/C][C]0.077462[/C][C]0.595[/C][C]0.277059[/C][/ROW]
[ROW][C]28[/C][C]-0.042657[/C][C]-0.3277[/C][C]0.372167[/C][/ROW]
[ROW][C]29[/C][C]0.017326[/C][C]0.1331[/C][C]0.447289[/C][/ROW]
[ROW][C]30[/C][C]-0.032165[/C][C]-0.2471[/C][C]0.402859[/C][/ROW]
[ROW][C]31[/C][C]-0.113596[/C][C]-0.8726[/C][C]0.193223[/C][/ROW]
[ROW][C]32[/C][C]-0.015676[/C][C]-0.1204[/C][C]0.452283[/C][/ROW]
[ROW][C]33[/C][C]-0.155448[/C][C]-1.194[/C][C]0.118624[/C][/ROW]
[ROW][C]34[/C][C]-0.029743[/C][C]-0.2285[/C][C]0.410039[/C][/ROW]
[ROW][C]35[/C][C]-0.015934[/C][C]-0.1224[/C][C]0.451503[/C][/ROW]
[ROW][C]36[/C][C]-0.072966[/C][C]-0.5605[/C][C]0.288644[/C][/ROW]
[ROW][C]37[/C][C]-0.029737[/C][C]-0.2284[/C][C]0.410058[/C][/ROW]
[ROW][C]38[/C][C]0.080276[/C][C]0.6166[/C][C]0.269933[/C][/ROW]
[ROW][C]39[/C][C]0.035106[/C][C]0.2697[/C][C]0.394185[/C][/ROW]
[ROW][C]40[/C][C]0.045685[/C][C]0.3509[/C][C]0.363452[/C][/ROW]
[ROW][C]41[/C][C]0.051704[/C][C]0.3971[/C][C]0.346347[/C][/ROW]
[ROW][C]42[/C][C]-0.057202[/C][C]-0.4394[/C][C]0.330996[/C][/ROW]
[ROW][C]43[/C][C]-0.002315[/C][C]-0.0178[/C][C]0.492935[/C][/ROW]
[ROW][C]44[/C][C]-0.017267[/C][C]-0.1326[/C][C]0.44747[/C][/ROW]
[ROW][C]45[/C][C]-0.07379[/C][C]-0.5668[/C][C]0.286502[/C][/ROW]
[ROW][C]46[/C][C]-0.064706[/C][C]-0.497[/C][C]0.310511[/C][/ROW]
[ROW][C]47[/C][C]-0.097784[/C][C]-0.7511[/C][C]0.227792[/C][/ROW]
[ROW][C]48[/C][C]0.028084[/C][C]0.2157[/C][C]0.414975[/C][/ROW]
[ROW][C]49[/C][C]-0.000607[/C][C]-0.0047[/C][C]0.498148[/C][/ROW]
[ROW][C]50[/C][C]-0.016936[/C][C]-0.1301[/C][C]0.448469[/C][/ROW]
[ROW][C]51[/C][C]0.030593[/C][C]0.235[/C][C]0.407514[/C][/ROW]
[ROW][C]52[/C][C]0.009565[/C][C]0.0735[/C][C]0.47084[/C][/ROW]
[ROW][C]53[/C][C]-0.051468[/C][C]-0.3953[/C][C]0.347011[/C][/ROW]
[ROW][C]54[/C][C]-0.076668[/C][C]-0.5889[/C][C]0.279088[/C][/ROW]
[ROW][C]55[/C][C]-0.035625[/C][C]-0.2736[/C][C]0.392659[/C][/ROW]
[ROW][C]56[/C][C]0.137176[/C][C]1.0537[/C][C]0.148166[/C][/ROW]
[ROW][C]57[/C][C]-0.029122[/C][C]-0.2237[/C][C]0.411885[/C][/ROW]
[ROW][C]58[/C][C]0.043152[/C][C]0.3315[/C][C]0.370736[/C][/ROW]
[ROW][C]59[/C][C]NA[/C][C]NA[/C][C]NA[/C][/ROW]
[ROW][C]60[/C][C]NA[/C][C]NA[/C][C]NA[/C][/ROW]
[/TABLE]
Source: https://freestatistics.org/blog/index.php?pk=35723&T=2

Globally Unique Identifier (entire table): ba.freestatistics.org/blog/index.php?pk=35723&T=2

As an alternative you can also use a QR Code:  

The GUIDs for individual cells are displayed in the table below:

Partial Autocorrelation Function
Time lag kPACF(k)T-STATP-value
10.0201970.15510.438622
2-0.079778-0.61280.271186
30.2314591.77790.040289
40.0335320.25760.398819
5-0.2739-2.10390.019831
6-0.021323-0.16380.43523
70.2400111.84360.035136
8-0.013892-0.10670.457693
9-0.08979-0.68970.246547
10-0.145507-1.11770.134122
110.0850880.65360.257963
12-0.057024-0.4380.33149
13-0.055473-0.42610.335795
14-0.024048-0.18470.427043
150.0127230.09770.46124
16-0.163736-1.25770.106731
17-0.138942-1.06720.145107
18-0.091287-0.70120.24297
190.1730371.32910.094462
200.0003060.00230.499068
21-0.031668-0.24320.404328
220.0074960.05760.477138
23-0.02095-0.16090.436353
24-0.130373-1.00140.160358
250.1642121.26130.106076
26-0.139547-1.07190.14407
270.0774620.5950.277059
28-0.042657-0.32770.372167
290.0173260.13310.447289
30-0.032165-0.24710.402859
31-0.113596-0.87260.193223
32-0.015676-0.12040.452283
33-0.155448-1.1940.118624
34-0.029743-0.22850.410039
35-0.015934-0.12240.451503
36-0.072966-0.56050.288644
37-0.029737-0.22840.410058
380.0802760.61660.269933
390.0351060.26970.394185
400.0456850.35090.363452
410.0517040.39710.346347
42-0.057202-0.43940.330996
43-0.002315-0.01780.492935
44-0.017267-0.13260.44747
45-0.07379-0.56680.286502
46-0.064706-0.4970.310511
47-0.097784-0.75110.227792
480.0280840.21570.414975
49-0.000607-0.00470.498148
50-0.016936-0.13010.448469
510.0305930.2350.407514
520.0095650.07350.47084
53-0.051468-0.39530.347011
54-0.076668-0.58890.279088
55-0.035625-0.27360.392659
560.1371761.05370.148166
57-0.029122-0.22370.411885
580.0431520.33150.370736
59NANANA
60NANANA


Parameters (Session):
par1 = 4 ;
Parameters (R input):
par1 = 60 ; par2 = -0.8 ; par3 = 1 ; par4 = 0 ; par5 = 12 ;
R code (references can be found in the software module):
if (par1 == 'Default') {
par1 = 10*log10(length(x))
} else {
par1 <- as.numeric(par1)
}
par2 <- as.numeric(par2)
par3 <- as.numeric(par3)
par4 <- as.numeric(par4)
par5 <- as.numeric(par5)
if (par2 == 0) {
x <- log(x)
} else {
x <- (x ^ par2 - 1) / par2
}
if (par3 > 0) x <- diff(x,lag=1,difference=par3)
if (par4 > 0) x <- diff(x,lag=par5,difference=par4)
bitmap(file='pic1.png')
racf <- acf(x,par1,main='Autocorrelation',xlab='lags',ylab='ACF')
dev.off()
bitmap(file='pic2.png')
rpacf <- pacf(x,par1,main='Partial Autocorrelation',xlab='lags',ylab='PACF')
dev.off()
(myacf <- c(racf$acf))
(mypacf <- c(rpacf$acf))
lengthx <- length(x)
sqrtn <- sqrt(lengthx)
load(file='createtable')
a<-table.start()
a<-table.row.start(a)
a<-table.element(a,'Autocorrelation Function',4,TRUE)
a<-table.row.end(a)
a<-table.row.start(a)
a<-table.element(a,'Time lag k',header=TRUE)
a<-table.element(a,hyperlink('basics.htm','ACF(k)','click here for more information about the Autocorrelation Function'),header=TRUE)
a<-table.element(a,'T-STAT',header=TRUE)
a<-table.element(a,'P-value',header=TRUE)
a<-table.row.end(a)
for (i in 2:(par1+1)) {
a<-table.row.start(a)
a<-table.element(a,i-1,header=TRUE)
a<-table.element(a,round(myacf[i],6))
mytstat <- myacf[i]*sqrtn
a<-table.element(a,round(mytstat,4))
a<-table.element(a,round(1-pt(abs(mytstat),lengthx),6))
a<-table.row.end(a)
}
a<-table.end(a)
table.save(a,file='mytable.tab')
a<-table.start()
a<-table.row.start(a)
a<-table.element(a,'Partial Autocorrelation Function',4,TRUE)
a<-table.row.end(a)
a<-table.row.start(a)
a<-table.element(a,'Time lag k',header=TRUE)
a<-table.element(a,hyperlink('basics.htm','PACF(k)','click here for more information about the Partial Autocorrelation Function'),header=TRUE)
a<-table.element(a,'T-STAT',header=TRUE)
a<-table.element(a,'P-value',header=TRUE)
a<-table.row.end(a)
for (i in 1:par1) {
a<-table.row.start(a)
a<-table.element(a,i,header=TRUE)
a<-table.element(a,round(mypacf[i],6))
mytstat <- mypacf[i]*sqrtn
a<-table.element(a,round(mytstat,4))
a<-table.element(a,round(1-pt(abs(mytstat),lengthx),6))
a<-table.row.end(a)
}
a<-table.end(a)
table.save(a,file='mytable1.tab')