Free Statistics

of Irreproducible Research!

Author's title

Author*Unverified author*
R Software Modulerwasp_autocorrelation.wasp
Title produced by software(Partial) Autocorrelation Function
Date of computationSun, 21 Dec 2008 11:00:26 -0700
Cite this page as followsStatistical Computations at FreeStatistics.org, Office for Research Development and Education, URL https://freestatistics.org/blog/index.php?v=date/2008/Dec/21/t12298824558otox84c46kq0p0.htm/, Retrieved Sun, 19 May 2024 11:29:58 +0000
Statistical Computations at FreeStatistics.org, Office for Research Development and Education, URL https://freestatistics.org/blog/index.php?pk=35720, Retrieved Sun, 19 May 2024 11:29:58 +0000
QR Codes:

Original text written by user:
IsPrivate?No (this computation is public)
User-defined keywords
Estimated Impact116
Family? (F = Feedback message, R = changed R code, M = changed R Module, P = changed Parameters, D = changed Data)
-       [(Partial) Autocorrelation Function] [] [2008-12-21 18:00:26] [a2d5a6282476ec2b5afae6fb53d308f8] [Current]
Feedback Forum

Post a new message
Dataseries X:
10244
10511
10812
10738
10171
9721
9897
9828
9924
10371
10846
10413
10709
10662
10570
10297
10635
10872
10296
10383
10431
10574
10653
10805
10872
10625
10407
10463
10556
10646
10702
11353
11346
11451
11964
12574
13031
13812
14544
14931
14886
16005
17064
15168
16050
15839
15137
14954
15648
15305
15579
16348
15928
16171
15937
15713
15594
15683
16438
17032


Summary of computational transaction
Raw Inputview raw input (R code)
Raw Outputview raw output of R engine
Computing time1 seconds
R Server'George Udny Yule' @ 72.249.76.132

\begin{tabular}{lllllllll}
\hline
Summary of computational transaction \tabularnewline
Raw Input & view raw input (R code)  \tabularnewline
Raw Output & view raw output of R engine  \tabularnewline
Computing time & 1 seconds \tabularnewline
R Server & 'George Udny Yule' @ 72.249.76.132 \tabularnewline
\hline
\end{tabular}
%Source: https://freestatistics.org/blog/index.php?pk=35720&T=0

[TABLE]
[ROW][C]Summary of computational transaction[/C][/ROW]
[ROW][C]Raw Input[/C][C]view raw input (R code) [/C][/ROW]
[ROW][C]Raw Output[/C][C]view raw output of R engine [/C][/ROW]
[ROW][C]Computing time[/C][C]1 seconds[/C][/ROW]
[ROW][C]R Server[/C][C]'George Udny Yule' @ 72.249.76.132[/C][/ROW]
[/TABLE]
Source: https://freestatistics.org/blog/index.php?pk=35720&T=0

Globally Unique Identifier (entire table): ba.freestatistics.org/blog/index.php?pk=35720&T=0

As an alternative you can also use a QR Code:  

The GUIDs for individual cells are displayed in the table below:

Summary of computational transaction
Raw Inputview raw input (R code)
Raw Outputview raw output of R engine
Computing time1 seconds
R Server'George Udny Yule' @ 72.249.76.132


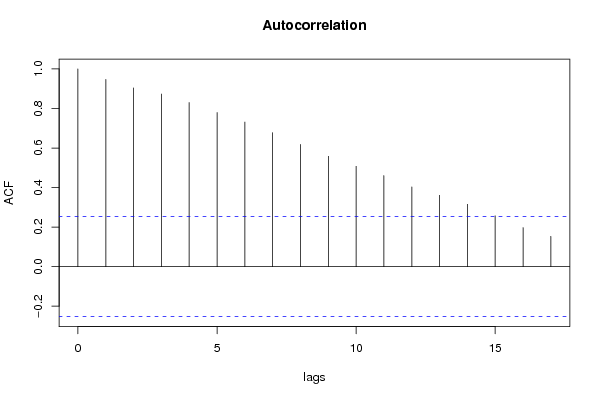
Autocorrelation Function
Time lag kACF(k)T-STATP-value
10.9466847.3330
20.9038237.0010
30.8730536.76260
40.8298246.42780
50.7793846.03710
60.7316475.66730
70.6775455.24821e-06
80.6178784.78616e-06
90.558224.3242.9e-05
100.5076343.93210.00011
110.4604073.56630.000359
120.4032913.12390.001374
130.3609532.79590.003471
140.3154732.44360.008749
150.2573961.99380.025364
160.1973441.52860.065807
170.1530651.18560.12022

\begin{tabular}{lllllllll}
\hline
Autocorrelation Function \tabularnewline
Time lag k & ACF(k) & T-STAT & P-value \tabularnewline
1 & 0.946684 & 7.333 & 0 \tabularnewline
2 & 0.903823 & 7.001 & 0 \tabularnewline
3 & 0.873053 & 6.7626 & 0 \tabularnewline
4 & 0.829824 & 6.4278 & 0 \tabularnewline
5 & 0.779384 & 6.0371 & 0 \tabularnewline
6 & 0.731647 & 5.6673 & 0 \tabularnewline
7 & 0.677545 & 5.2482 & 1e-06 \tabularnewline
8 & 0.617878 & 4.7861 & 6e-06 \tabularnewline
9 & 0.55822 & 4.324 & 2.9e-05 \tabularnewline
10 & 0.507634 & 3.9321 & 0.00011 \tabularnewline
11 & 0.460407 & 3.5663 & 0.000359 \tabularnewline
12 & 0.403291 & 3.1239 & 0.001374 \tabularnewline
13 & 0.360953 & 2.7959 & 0.003471 \tabularnewline
14 & 0.315473 & 2.4436 & 0.008749 \tabularnewline
15 & 0.257396 & 1.9938 & 0.025364 \tabularnewline
16 & 0.197344 & 1.5286 & 0.065807 \tabularnewline
17 & 0.153065 & 1.1856 & 0.12022 \tabularnewline
\hline
\end{tabular}
%Source: https://freestatistics.org/blog/index.php?pk=35720&T=1

[TABLE]
[ROW][C]Autocorrelation Function[/C][/ROW]
[ROW][C]Time lag k[/C][C]ACF(k)[/C][C]T-STAT[/C][C]P-value[/C][/ROW]
[ROW][C]1[/C][C]0.946684[/C][C]7.333[/C][C]0[/C][/ROW]
[ROW][C]2[/C][C]0.903823[/C][C]7.001[/C][C]0[/C][/ROW]
[ROW][C]3[/C][C]0.873053[/C][C]6.7626[/C][C]0[/C][/ROW]
[ROW][C]4[/C][C]0.829824[/C][C]6.4278[/C][C]0[/C][/ROW]
[ROW][C]5[/C][C]0.779384[/C][C]6.0371[/C][C]0[/C][/ROW]
[ROW][C]6[/C][C]0.731647[/C][C]5.6673[/C][C]0[/C][/ROW]
[ROW][C]7[/C][C]0.677545[/C][C]5.2482[/C][C]1e-06[/C][/ROW]
[ROW][C]8[/C][C]0.617878[/C][C]4.7861[/C][C]6e-06[/C][/ROW]
[ROW][C]9[/C][C]0.55822[/C][C]4.324[/C][C]2.9e-05[/C][/ROW]
[ROW][C]10[/C][C]0.507634[/C][C]3.9321[/C][C]0.00011[/C][/ROW]
[ROW][C]11[/C][C]0.460407[/C][C]3.5663[/C][C]0.000359[/C][/ROW]
[ROW][C]12[/C][C]0.403291[/C][C]3.1239[/C][C]0.001374[/C][/ROW]
[ROW][C]13[/C][C]0.360953[/C][C]2.7959[/C][C]0.003471[/C][/ROW]
[ROW][C]14[/C][C]0.315473[/C][C]2.4436[/C][C]0.008749[/C][/ROW]
[ROW][C]15[/C][C]0.257396[/C][C]1.9938[/C][C]0.025364[/C][/ROW]
[ROW][C]16[/C][C]0.197344[/C][C]1.5286[/C][C]0.065807[/C][/ROW]
[ROW][C]17[/C][C]0.153065[/C][C]1.1856[/C][C]0.12022[/C][/ROW]
[/TABLE]
Source: https://freestatistics.org/blog/index.php?pk=35720&T=1

Globally Unique Identifier (entire table): ba.freestatistics.org/blog/index.php?pk=35720&T=1

As an alternative you can also use a QR Code:  

The GUIDs for individual cells are displayed in the table below:

Autocorrelation Function
Time lag kACF(k)T-STATP-value
10.9466847.3330
20.9038237.0010
30.8730536.76260
40.8298246.42780
50.7793846.03710
60.7316475.66730
70.6775455.24821e-06
80.6178784.78616e-06
90.558224.3242.9e-05
100.5076343.93210.00011
110.4604073.56630.000359
120.4032913.12390.001374
130.3609532.79590.003471
140.3154732.44360.008749
150.2573961.99380.025364
160.1973441.52860.065807
170.1530651.18560.12022


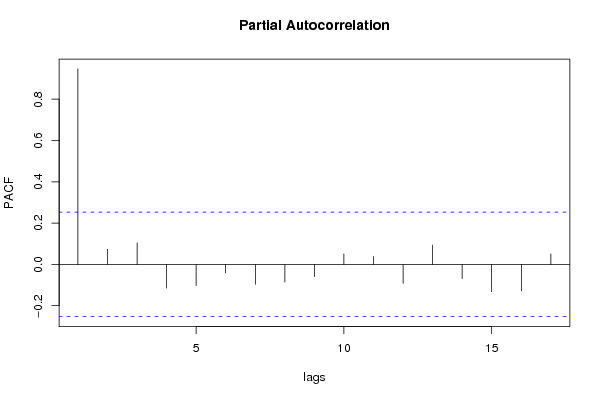
Partial Autocorrelation Function
Time lag kPACF(k)T-STATP-value
10.9466847.3330
20.0733470.56810.286029
30.1040350.80590.211755
4-0.114494-0.88690.189346
5-0.102456-0.79360.215271
6-0.041349-0.32030.374932
7-0.095554-0.74020.231045
8-0.085512-0.66240.255135
9-0.059522-0.46110.323213
100.0507170.39290.34791
110.03820.29590.384167
12-0.091586-0.70940.240405
130.0939470.72770.23481
14-0.068655-0.53180.298414
15-0.131905-1.02170.155506
16-0.127615-0.98850.163439
170.0505580.39160.348363

\begin{tabular}{lllllllll}
\hline
Partial Autocorrelation Function \tabularnewline
Time lag k & PACF(k) & T-STAT & P-value \tabularnewline
1 & 0.946684 & 7.333 & 0 \tabularnewline
2 & 0.073347 & 0.5681 & 0.286029 \tabularnewline
3 & 0.104035 & 0.8059 & 0.211755 \tabularnewline
4 & -0.114494 & -0.8869 & 0.189346 \tabularnewline
5 & -0.102456 & -0.7936 & 0.215271 \tabularnewline
6 & -0.041349 & -0.3203 & 0.374932 \tabularnewline
7 & -0.095554 & -0.7402 & 0.231045 \tabularnewline
8 & -0.085512 & -0.6624 & 0.255135 \tabularnewline
9 & -0.059522 & -0.4611 & 0.323213 \tabularnewline
10 & 0.050717 & 0.3929 & 0.34791 \tabularnewline
11 & 0.0382 & 0.2959 & 0.384167 \tabularnewline
12 & -0.091586 & -0.7094 & 0.240405 \tabularnewline
13 & 0.093947 & 0.7277 & 0.23481 \tabularnewline
14 & -0.068655 & -0.5318 & 0.298414 \tabularnewline
15 & -0.131905 & -1.0217 & 0.155506 \tabularnewline
16 & -0.127615 & -0.9885 & 0.163439 \tabularnewline
17 & 0.050558 & 0.3916 & 0.348363 \tabularnewline
\hline
\end{tabular}
%Source: https://freestatistics.org/blog/index.php?pk=35720&T=2

[TABLE]
[ROW][C]Partial Autocorrelation Function[/C][/ROW]
[ROW][C]Time lag k[/C][C]PACF(k)[/C][C]T-STAT[/C][C]P-value[/C][/ROW]
[ROW][C]1[/C][C]0.946684[/C][C]7.333[/C][C]0[/C][/ROW]
[ROW][C]2[/C][C]0.073347[/C][C]0.5681[/C][C]0.286029[/C][/ROW]
[ROW][C]3[/C][C]0.104035[/C][C]0.8059[/C][C]0.211755[/C][/ROW]
[ROW][C]4[/C][C]-0.114494[/C][C]-0.8869[/C][C]0.189346[/C][/ROW]
[ROW][C]5[/C][C]-0.102456[/C][C]-0.7936[/C][C]0.215271[/C][/ROW]
[ROW][C]6[/C][C]-0.041349[/C][C]-0.3203[/C][C]0.374932[/C][/ROW]
[ROW][C]7[/C][C]-0.095554[/C][C]-0.7402[/C][C]0.231045[/C][/ROW]
[ROW][C]8[/C][C]-0.085512[/C][C]-0.6624[/C][C]0.255135[/C][/ROW]
[ROW][C]9[/C][C]-0.059522[/C][C]-0.4611[/C][C]0.323213[/C][/ROW]
[ROW][C]10[/C][C]0.050717[/C][C]0.3929[/C][C]0.34791[/C][/ROW]
[ROW][C]11[/C][C]0.0382[/C][C]0.2959[/C][C]0.384167[/C][/ROW]
[ROW][C]12[/C][C]-0.091586[/C][C]-0.7094[/C][C]0.240405[/C][/ROW]
[ROW][C]13[/C][C]0.093947[/C][C]0.7277[/C][C]0.23481[/C][/ROW]
[ROW][C]14[/C][C]-0.068655[/C][C]-0.5318[/C][C]0.298414[/C][/ROW]
[ROW][C]15[/C][C]-0.131905[/C][C]-1.0217[/C][C]0.155506[/C][/ROW]
[ROW][C]16[/C][C]-0.127615[/C][C]-0.9885[/C][C]0.163439[/C][/ROW]
[ROW][C]17[/C][C]0.050558[/C][C]0.3916[/C][C]0.348363[/C][/ROW]
[/TABLE]
Source: https://freestatistics.org/blog/index.php?pk=35720&T=2

Globally Unique Identifier (entire table): ba.freestatistics.org/blog/index.php?pk=35720&T=2

As an alternative you can also use a QR Code:  

The GUIDs for individual cells are displayed in the table below:

Partial Autocorrelation Function
Time lag kPACF(k)T-STATP-value
10.9466847.3330
20.0733470.56810.286029
30.1040350.80590.211755
4-0.114494-0.88690.189346
5-0.102456-0.79360.215271
6-0.041349-0.32030.374932
7-0.095554-0.74020.231045
8-0.085512-0.66240.255135
9-0.059522-0.46110.323213
100.0507170.39290.34791
110.03820.29590.384167
12-0.091586-0.70940.240405
130.0939470.72770.23481
14-0.068655-0.53180.298414
15-0.131905-1.02170.155506
16-0.127615-0.98850.163439
170.0505580.39160.348363


Parameters (Session):
par1 = 4 ;
Parameters (R input):
par1 = Default ; par2 = 1 ; par3 = 0 ; par4 = 0 ; par5 = 12 ;
R code (references can be found in the software module):
if (par1 == 'Default') {
par1 = 10*log10(length(x))
} else {
par1 <- as.numeric(par1)
}
par2 <- as.numeric(par2)
par3 <- as.numeric(par3)
par4 <- as.numeric(par4)
par5 <- as.numeric(par5)
if (par2 == 0) {
x <- log(x)
} else {
x <- (x ^ par2 - 1) / par2
}
if (par3 > 0) x <- diff(x,lag=1,difference=par3)
if (par4 > 0) x <- diff(x,lag=par5,difference=par4)
bitmap(file='pic1.png')
racf <- acf(x,par1,main='Autocorrelation',xlab='lags',ylab='ACF')
dev.off()
bitmap(file='pic2.png')
rpacf <- pacf(x,par1,main='Partial Autocorrelation',xlab='lags',ylab='PACF')
dev.off()
(myacf <- c(racf$acf))
(mypacf <- c(rpacf$acf))
lengthx <- length(x)
sqrtn <- sqrt(lengthx)
load(file='createtable')
a<-table.start()
a<-table.row.start(a)
a<-table.element(a,'Autocorrelation Function',4,TRUE)
a<-table.row.end(a)
a<-table.row.start(a)
a<-table.element(a,'Time lag k',header=TRUE)
a<-table.element(a,hyperlink('basics.htm','ACF(k)','click here for more information about the Autocorrelation Function'),header=TRUE)
a<-table.element(a,'T-STAT',header=TRUE)
a<-table.element(a,'P-value',header=TRUE)
a<-table.row.end(a)
for (i in 2:(par1+1)) {
a<-table.row.start(a)
a<-table.element(a,i-1,header=TRUE)
a<-table.element(a,round(myacf[i],6))
mytstat <- myacf[i]*sqrtn
a<-table.element(a,round(mytstat,4))
a<-table.element(a,round(1-pt(abs(mytstat),lengthx),6))
a<-table.row.end(a)
}
a<-table.end(a)
table.save(a,file='mytable.tab')
a<-table.start()
a<-table.row.start(a)
a<-table.element(a,'Partial Autocorrelation Function',4,TRUE)
a<-table.row.end(a)
a<-table.row.start(a)
a<-table.element(a,'Time lag k',header=TRUE)
a<-table.element(a,hyperlink('basics.htm','PACF(k)','click here for more information about the Partial Autocorrelation Function'),header=TRUE)
a<-table.element(a,'T-STAT',header=TRUE)
a<-table.element(a,'P-value',header=TRUE)
a<-table.row.end(a)
for (i in 1:par1) {
a<-table.row.start(a)
a<-table.element(a,i,header=TRUE)
a<-table.element(a,round(mypacf[i],6))
mytstat <- mypacf[i]*sqrtn
a<-table.element(a,round(mytstat,4))
a<-table.element(a,round(1-pt(abs(mytstat),lengthx),6))
a<-table.row.end(a)
}
a<-table.end(a)
table.save(a,file='mytable1.tab')