Free Statistics

of Irreproducible Research!

Author's title

Author*Unverified author*
R Software Modulerwasp_autocorrelation.wasp
Title produced by software(Partial) Autocorrelation Function
Date of computationSun, 21 Dec 2008 10:51:52 -0700
Cite this page as followsStatistical Computations at FreeStatistics.org, Office for Research Development and Education, URL https://freestatistics.org/blog/index.php?v=date/2008/Dec/21/t1229881949h73go4izwmhtsks.htm/, Retrieved Sun, 19 May 2024 10:06:46 +0000
Statistical Computations at FreeStatistics.org, Office for Research Development and Education, URL https://freestatistics.org/blog/index.php?pk=35714, Retrieved Sun, 19 May 2024 10:06:46 +0000
QR Codes:

Original text written by user:
IsPrivate?No (this computation is public)
User-defined keywords
Estimated Impact146
Family? (F = Feedback message, R = changed R code, M = changed R Module, P = changed Parameters, D = changed Data)
-       [(Partial) Autocorrelation Function] [] [2008-12-21 17:51:52] [a2d5a6282476ec2b5afae6fb53d308f8] [Current]
Feedback Forum

Post a new message
Dataseries X:
1.0014
1.0183
1.0622
1.0773
1.0807
1.0848
1.1582
1.1663
1.1372
1.1139
1.1222
1.1692
1.1702
1.2286
1.2613
1.2646
1.2262
1.1985
1.2007
1.2138
1.2266
1.2176
1.2218
1.2490
1.2991
1.3408
1.3119
1.3014
1.3201
1.2938
1.2694
1.2165
1.2037
1.2292
1.2256
1.2015
1.1786
1.1856
1.2103
1.1938
1.2020
1.2271
1.2770
1.2650
1.2684
1.2811
1.2727
1.2611
1.2881
1.3213
1.2999
1.3074
1.3242
1.3516
1.3511
1.3419
1.3716
1.3622
1.3896
1.4227


Summary of computational transaction
Raw Inputview raw input (R code)
Raw Outputview raw output of R engine
Computing time2 seconds
R Server'Sir Ronald Aylmer Fisher' @ 193.190.124.24

\begin{tabular}{lllllllll}
\hline
Summary of computational transaction \tabularnewline
Raw Input & view raw input (R code)  \tabularnewline
Raw Output & view raw output of R engine  \tabularnewline
Computing time & 2 seconds \tabularnewline
R Server & 'Sir Ronald Aylmer Fisher' @ 193.190.124.24 \tabularnewline
\hline
\end{tabular}
%Source: https://freestatistics.org/blog/index.php?pk=35714&T=0

[TABLE]
[ROW][C]Summary of computational transaction[/C][/ROW]
[ROW][C]Raw Input[/C][C]view raw input (R code) [/C][/ROW]
[ROW][C]Raw Output[/C][C]view raw output of R engine [/C][/ROW]
[ROW][C]Computing time[/C][C]2 seconds[/C][/ROW]
[ROW][C]R Server[/C][C]'Sir Ronald Aylmer Fisher' @ 193.190.124.24[/C][/ROW]
[/TABLE]
Source: https://freestatistics.org/blog/index.php?pk=35714&T=0

Globally Unique Identifier (entire table): ba.freestatistics.org/blog/index.php?pk=35714&T=0

As an alternative you can also use a QR Code:  

The GUIDs for individual cells are displayed in the table below:

Summary of computational transaction
Raw Inputview raw input (R code)
Raw Outputview raw output of R engine
Computing time2 seconds
R Server'Sir Ronald Aylmer Fisher' @ 193.190.124.24


Autocorrelation Function
Time lag kACF(k)T-STATP-value
10.2273151.7460.043005
2-0.193427-1.48570.071336
3-0.118167-0.90770.183876
40.1352531.03890.151546
50.0709450.54490.293924
6-0.253376-1.94620.028198
7-0.049308-0.37870.353118
80.0290880.22340.411987
90.0822410.63170.26501
100.0331950.2550.399815
110.0154980.1190.452824
12-0.014481-0.11120.455906
130.011840.09090.463923
140.1112430.85450.198149
15-0.078359-0.60190.274777
16-0.143999-1.10610.136591
170.0014910.01150.49545
180.0873350.67080.252472
190.0676220.51940.302708
20-0.060273-0.4630.322547
21-0.017643-0.13550.446333
220.0079290.06090.47582
23-0.014734-0.11320.455139
24-0.086828-0.66690.253706
25-0.190889-1.46620.073945
26-0.070172-0.5390.295958
270.019730.15160.440028
28-0.010655-0.08180.467524
29-0.084833-0.65160.25859
30-0.102837-0.78990.216373
310.0872380.67010.252708
32-0.091437-0.70230.242615
33-0.178683-1.37250.087553
340.010930.0840.466689
350.0994440.76380.224002
360.0653450.50190.308793
37-0.095081-0.73030.23404
380.0658850.50610.307345
390.045210.34730.364813
40-0.013789-0.10590.458003
41-0.059104-0.4540.325751
420.0266930.2050.419125
430.018960.14560.442354
44-0.125862-0.96680.168803
450.0390510.30.382632
460.0735590.5650.287101
470.0708970.54460.294051
48-0.017125-0.13150.447897
49-0.033078-0.25410.400161
500.0141770.10890.456828
51-0.031984-0.24570.403394
520.0287350.22070.413039
530.031420.24130.405064
540.0098370.07560.470012
55-0.008305-0.06380.474675
560.0202660.15570.438413
570.0295550.2270.410597
580.00650.04990.480175
59NANANA
60NANANA

\begin{tabular}{lllllllll}
\hline
Autocorrelation Function \tabularnewline
Time lag k & ACF(k) & T-STAT & P-value \tabularnewline
1 & 0.227315 & 1.746 & 0.043005 \tabularnewline
2 & -0.193427 & -1.4857 & 0.071336 \tabularnewline
3 & -0.118167 & -0.9077 & 0.183876 \tabularnewline
4 & 0.135253 & 1.0389 & 0.151546 \tabularnewline
5 & 0.070945 & 0.5449 & 0.293924 \tabularnewline
6 & -0.253376 & -1.9462 & 0.028198 \tabularnewline
7 & -0.049308 & -0.3787 & 0.353118 \tabularnewline
8 & 0.029088 & 0.2234 & 0.411987 \tabularnewline
9 & 0.082241 & 0.6317 & 0.26501 \tabularnewline
10 & 0.033195 & 0.255 & 0.399815 \tabularnewline
11 & 0.015498 & 0.119 & 0.452824 \tabularnewline
12 & -0.014481 & -0.1112 & 0.455906 \tabularnewline
13 & 0.01184 & 0.0909 & 0.463923 \tabularnewline
14 & 0.111243 & 0.8545 & 0.198149 \tabularnewline
15 & -0.078359 & -0.6019 & 0.274777 \tabularnewline
16 & -0.143999 & -1.1061 & 0.136591 \tabularnewline
17 & 0.001491 & 0.0115 & 0.49545 \tabularnewline
18 & 0.087335 & 0.6708 & 0.252472 \tabularnewline
19 & 0.067622 & 0.5194 & 0.302708 \tabularnewline
20 & -0.060273 & -0.463 & 0.322547 \tabularnewline
21 & -0.017643 & -0.1355 & 0.446333 \tabularnewline
22 & 0.007929 & 0.0609 & 0.47582 \tabularnewline
23 & -0.014734 & -0.1132 & 0.455139 \tabularnewline
24 & -0.086828 & -0.6669 & 0.253706 \tabularnewline
25 & -0.190889 & -1.4662 & 0.073945 \tabularnewline
26 & -0.070172 & -0.539 & 0.295958 \tabularnewline
27 & 0.01973 & 0.1516 & 0.440028 \tabularnewline
28 & -0.010655 & -0.0818 & 0.467524 \tabularnewline
29 & -0.084833 & -0.6516 & 0.25859 \tabularnewline
30 & -0.102837 & -0.7899 & 0.216373 \tabularnewline
31 & 0.087238 & 0.6701 & 0.252708 \tabularnewline
32 & -0.091437 & -0.7023 & 0.242615 \tabularnewline
33 & -0.178683 & -1.3725 & 0.087553 \tabularnewline
34 & 0.01093 & 0.084 & 0.466689 \tabularnewline
35 & 0.099444 & 0.7638 & 0.224002 \tabularnewline
36 & 0.065345 & 0.5019 & 0.308793 \tabularnewline
37 & -0.095081 & -0.7303 & 0.23404 \tabularnewline
38 & 0.065885 & 0.5061 & 0.307345 \tabularnewline
39 & 0.04521 & 0.3473 & 0.364813 \tabularnewline
40 & -0.013789 & -0.1059 & 0.458003 \tabularnewline
41 & -0.059104 & -0.454 & 0.325751 \tabularnewline
42 & 0.026693 & 0.205 & 0.419125 \tabularnewline
43 & 0.01896 & 0.1456 & 0.442354 \tabularnewline
44 & -0.125862 & -0.9668 & 0.168803 \tabularnewline
45 & 0.039051 & 0.3 & 0.382632 \tabularnewline
46 & 0.073559 & 0.565 & 0.287101 \tabularnewline
47 & 0.070897 & 0.5446 & 0.294051 \tabularnewline
48 & -0.017125 & -0.1315 & 0.447897 \tabularnewline
49 & -0.033078 & -0.2541 & 0.400161 \tabularnewline
50 & 0.014177 & 0.1089 & 0.456828 \tabularnewline
51 & -0.031984 & -0.2457 & 0.403394 \tabularnewline
52 & 0.028735 & 0.2207 & 0.413039 \tabularnewline
53 & 0.03142 & 0.2413 & 0.405064 \tabularnewline
54 & 0.009837 & 0.0756 & 0.470012 \tabularnewline
55 & -0.008305 & -0.0638 & 0.474675 \tabularnewline
56 & 0.020266 & 0.1557 & 0.438413 \tabularnewline
57 & 0.029555 & 0.227 & 0.410597 \tabularnewline
58 & 0.0065 & 0.0499 & 0.480175 \tabularnewline
59 & NA & NA & NA \tabularnewline
60 & NA & NA & NA \tabularnewline
\hline
\end{tabular}
%Source: https://freestatistics.org/blog/index.php?pk=35714&T=1

[TABLE]
[ROW][C]Autocorrelation Function[/C][/ROW]
[ROW][C]Time lag k[/C][C]ACF(k)[/C][C]T-STAT[/C][C]P-value[/C][/ROW]
[ROW][C]1[/C][C]0.227315[/C][C]1.746[/C][C]0.043005[/C][/ROW]
[ROW][C]2[/C][C]-0.193427[/C][C]-1.4857[/C][C]0.071336[/C][/ROW]
[ROW][C]3[/C][C]-0.118167[/C][C]-0.9077[/C][C]0.183876[/C][/ROW]
[ROW][C]4[/C][C]0.135253[/C][C]1.0389[/C][C]0.151546[/C][/ROW]
[ROW][C]5[/C][C]0.070945[/C][C]0.5449[/C][C]0.293924[/C][/ROW]
[ROW][C]6[/C][C]-0.253376[/C][C]-1.9462[/C][C]0.028198[/C][/ROW]
[ROW][C]7[/C][C]-0.049308[/C][C]-0.3787[/C][C]0.353118[/C][/ROW]
[ROW][C]8[/C][C]0.029088[/C][C]0.2234[/C][C]0.411987[/C][/ROW]
[ROW][C]9[/C][C]0.082241[/C][C]0.6317[/C][C]0.26501[/C][/ROW]
[ROW][C]10[/C][C]0.033195[/C][C]0.255[/C][C]0.399815[/C][/ROW]
[ROW][C]11[/C][C]0.015498[/C][C]0.119[/C][C]0.452824[/C][/ROW]
[ROW][C]12[/C][C]-0.014481[/C][C]-0.1112[/C][C]0.455906[/C][/ROW]
[ROW][C]13[/C][C]0.01184[/C][C]0.0909[/C][C]0.463923[/C][/ROW]
[ROW][C]14[/C][C]0.111243[/C][C]0.8545[/C][C]0.198149[/C][/ROW]
[ROW][C]15[/C][C]-0.078359[/C][C]-0.6019[/C][C]0.274777[/C][/ROW]
[ROW][C]16[/C][C]-0.143999[/C][C]-1.1061[/C][C]0.136591[/C][/ROW]
[ROW][C]17[/C][C]0.001491[/C][C]0.0115[/C][C]0.49545[/C][/ROW]
[ROW][C]18[/C][C]0.087335[/C][C]0.6708[/C][C]0.252472[/C][/ROW]
[ROW][C]19[/C][C]0.067622[/C][C]0.5194[/C][C]0.302708[/C][/ROW]
[ROW][C]20[/C][C]-0.060273[/C][C]-0.463[/C][C]0.322547[/C][/ROW]
[ROW][C]21[/C][C]-0.017643[/C][C]-0.1355[/C][C]0.446333[/C][/ROW]
[ROW][C]22[/C][C]0.007929[/C][C]0.0609[/C][C]0.47582[/C][/ROW]
[ROW][C]23[/C][C]-0.014734[/C][C]-0.1132[/C][C]0.455139[/C][/ROW]
[ROW][C]24[/C][C]-0.086828[/C][C]-0.6669[/C][C]0.253706[/C][/ROW]
[ROW][C]25[/C][C]-0.190889[/C][C]-1.4662[/C][C]0.073945[/C][/ROW]
[ROW][C]26[/C][C]-0.070172[/C][C]-0.539[/C][C]0.295958[/C][/ROW]
[ROW][C]27[/C][C]0.01973[/C][C]0.1516[/C][C]0.440028[/C][/ROW]
[ROW][C]28[/C][C]-0.010655[/C][C]-0.0818[/C][C]0.467524[/C][/ROW]
[ROW][C]29[/C][C]-0.084833[/C][C]-0.6516[/C][C]0.25859[/C][/ROW]
[ROW][C]30[/C][C]-0.102837[/C][C]-0.7899[/C][C]0.216373[/C][/ROW]
[ROW][C]31[/C][C]0.087238[/C][C]0.6701[/C][C]0.252708[/C][/ROW]
[ROW][C]32[/C][C]-0.091437[/C][C]-0.7023[/C][C]0.242615[/C][/ROW]
[ROW][C]33[/C][C]-0.178683[/C][C]-1.3725[/C][C]0.087553[/C][/ROW]
[ROW][C]34[/C][C]0.01093[/C][C]0.084[/C][C]0.466689[/C][/ROW]
[ROW][C]35[/C][C]0.099444[/C][C]0.7638[/C][C]0.224002[/C][/ROW]
[ROW][C]36[/C][C]0.065345[/C][C]0.5019[/C][C]0.308793[/C][/ROW]
[ROW][C]37[/C][C]-0.095081[/C][C]-0.7303[/C][C]0.23404[/C][/ROW]
[ROW][C]38[/C][C]0.065885[/C][C]0.5061[/C][C]0.307345[/C][/ROW]
[ROW][C]39[/C][C]0.04521[/C][C]0.3473[/C][C]0.364813[/C][/ROW]
[ROW][C]40[/C][C]-0.013789[/C][C]-0.1059[/C][C]0.458003[/C][/ROW]
[ROW][C]41[/C][C]-0.059104[/C][C]-0.454[/C][C]0.325751[/C][/ROW]
[ROW][C]42[/C][C]0.026693[/C][C]0.205[/C][C]0.419125[/C][/ROW]
[ROW][C]43[/C][C]0.01896[/C][C]0.1456[/C][C]0.442354[/C][/ROW]
[ROW][C]44[/C][C]-0.125862[/C][C]-0.9668[/C][C]0.168803[/C][/ROW]
[ROW][C]45[/C][C]0.039051[/C][C]0.3[/C][C]0.382632[/C][/ROW]
[ROW][C]46[/C][C]0.073559[/C][C]0.565[/C][C]0.287101[/C][/ROW]
[ROW][C]47[/C][C]0.070897[/C][C]0.5446[/C][C]0.294051[/C][/ROW]
[ROW][C]48[/C][C]-0.017125[/C][C]-0.1315[/C][C]0.447897[/C][/ROW]
[ROW][C]49[/C][C]-0.033078[/C][C]-0.2541[/C][C]0.400161[/C][/ROW]
[ROW][C]50[/C][C]0.014177[/C][C]0.1089[/C][C]0.456828[/C][/ROW]
[ROW][C]51[/C][C]-0.031984[/C][C]-0.2457[/C][C]0.403394[/C][/ROW]
[ROW][C]52[/C][C]0.028735[/C][C]0.2207[/C][C]0.413039[/C][/ROW]
[ROW][C]53[/C][C]0.03142[/C][C]0.2413[/C][C]0.405064[/C][/ROW]
[ROW][C]54[/C][C]0.009837[/C][C]0.0756[/C][C]0.470012[/C][/ROW]
[ROW][C]55[/C][C]-0.008305[/C][C]-0.0638[/C][C]0.474675[/C][/ROW]
[ROW][C]56[/C][C]0.020266[/C][C]0.1557[/C][C]0.438413[/C][/ROW]
[ROW][C]57[/C][C]0.029555[/C][C]0.227[/C][C]0.410597[/C][/ROW]
[ROW][C]58[/C][C]0.0065[/C][C]0.0499[/C][C]0.480175[/C][/ROW]
[ROW][C]59[/C][C]NA[/C][C]NA[/C][C]NA[/C][/ROW]
[ROW][C]60[/C][C]NA[/C][C]NA[/C][C]NA[/C][/ROW]
[/TABLE]
Source: https://freestatistics.org/blog/index.php?pk=35714&T=1

Globally Unique Identifier (entire table): ba.freestatistics.org/blog/index.php?pk=35714&T=1

As an alternative you can also use a QR Code:  

The GUIDs for individual cells are displayed in the table below:

Autocorrelation Function
Time lag kACF(k)T-STATP-value
10.2273151.7460.043005
2-0.193427-1.48570.071336
3-0.118167-0.90770.183876
40.1352531.03890.151546
50.0709450.54490.293924
6-0.253376-1.94620.028198
7-0.049308-0.37870.353118
80.0290880.22340.411987
90.0822410.63170.26501
100.0331950.2550.399815
110.0154980.1190.452824
12-0.014481-0.11120.455906
130.011840.09090.463923
140.1112430.85450.198149
15-0.078359-0.60190.274777
16-0.143999-1.10610.136591
170.0014910.01150.49545
180.0873350.67080.252472
190.0676220.51940.302708
20-0.060273-0.4630.322547
21-0.017643-0.13550.446333
220.0079290.06090.47582
23-0.014734-0.11320.455139
24-0.086828-0.66690.253706
25-0.190889-1.46620.073945
26-0.070172-0.5390.295958
270.019730.15160.440028
28-0.010655-0.08180.467524
29-0.084833-0.65160.25859
30-0.102837-0.78990.216373
310.0872380.67010.252708
32-0.091437-0.70230.242615
33-0.178683-1.37250.087553
340.010930.0840.466689
350.0994440.76380.224002
360.0653450.50190.308793
37-0.095081-0.73030.23404
380.0658850.50610.307345
390.045210.34730.364813
40-0.013789-0.10590.458003
41-0.059104-0.4540.325751
420.0266930.2050.419125
430.018960.14560.442354
44-0.125862-0.96680.168803
450.0390510.30.382632
460.0735590.5650.287101
470.0708970.54460.294051
48-0.017125-0.13150.447897
49-0.033078-0.25410.400161
500.0141770.10890.456828
51-0.031984-0.24570.403394
520.0287350.22070.413039
530.031420.24130.405064
540.0098370.07560.470012
55-0.008305-0.06380.474675
560.0202660.15570.438413
570.0295550.2270.410597
580.00650.04990.480175
59NANANA
60NANANA


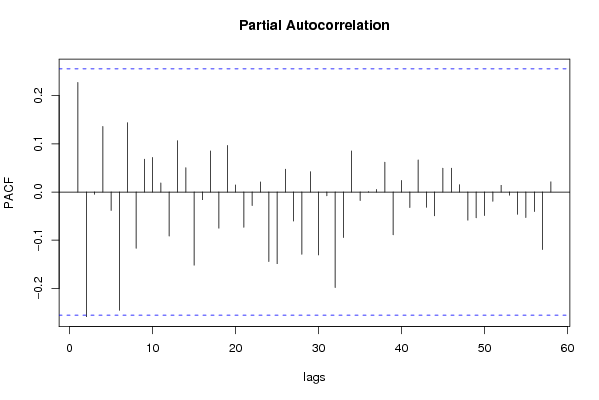
Partial Autocorrelation Function
Time lag kPACF(k)T-STATP-value
10.2273151.7460.043005
2-0.258454-1.98520.025887
3-0.004615-0.03540.485922
40.1358561.04350.15048
5-0.038206-0.29350.385099
6-0.245308-1.88420.032231
70.1435811.10290.137282
8-0.116577-0.89540.187095
90.0680370.52260.301603
100.0714820.54910.292517
110.0185590.14260.443565
12-0.091108-0.69980.243396
130.1064750.81790.208366
140.0504190.38730.349972
15-0.151657-1.16490.124374
16-0.01584-0.12170.451787
170.0850120.6530.25815
18-0.074978-0.57590.28343
190.0965660.74170.230595
200.0146220.11230.455478
21-0.07303-0.5610.288477
22-0.027995-0.2150.415242
230.0209070.16060.436481
24-0.143976-1.10590.136629
25-0.148615-1.14150.12913
260.0470640.36150.359507
27-0.060021-0.4610.323236
28-0.129133-0.99190.162651
290.0420570.3230.3739
30-0.130363-1.00130.160377
31-0.008019-0.06160.475546
32-0.198181-1.52230.066644
33-0.094467-0.72560.235471
340.0851890.65440.257714
35-0.017543-0.13480.446634
360.0005820.00450.498224
370.0053060.04080.483815
380.0616910.47390.318676
39-0.088505-0.67980.249639
400.0237340.18230.427984
41-0.031995-0.24580.403362
420.0665740.51140.305502
43-0.031712-0.24360.404198
44-0.049343-0.3790.35302
450.0492720.37850.353222
460.0494280.37970.35278
470.0151280.11620.453943
48-0.058329-0.4480.327884
49-0.053296-0.40940.341875
50-0.048733-0.37430.354751
51-0.019365-0.14870.441131
520.0137740.10580.458051
53-0.006525-0.05010.480098
54-0.046118-0.35420.36221
55-0.05292-0.40650.342928
56-0.040648-0.31220.377985
57-0.119082-0.91470.182039
580.0210660.16180.436003
59NANANA
60NANANA

\begin{tabular}{lllllllll}
\hline
Partial Autocorrelation Function \tabularnewline
Time lag k & PACF(k) & T-STAT & P-value \tabularnewline
1 & 0.227315 & 1.746 & 0.043005 \tabularnewline
2 & -0.258454 & -1.9852 & 0.025887 \tabularnewline
3 & -0.004615 & -0.0354 & 0.485922 \tabularnewline
4 & 0.135856 & 1.0435 & 0.15048 \tabularnewline
5 & -0.038206 & -0.2935 & 0.385099 \tabularnewline
6 & -0.245308 & -1.8842 & 0.032231 \tabularnewline
7 & 0.143581 & 1.1029 & 0.137282 \tabularnewline
8 & -0.116577 & -0.8954 & 0.187095 \tabularnewline
9 & 0.068037 & 0.5226 & 0.301603 \tabularnewline
10 & 0.071482 & 0.5491 & 0.292517 \tabularnewline
11 & 0.018559 & 0.1426 & 0.443565 \tabularnewline
12 & -0.091108 & -0.6998 & 0.243396 \tabularnewline
13 & 0.106475 & 0.8179 & 0.208366 \tabularnewline
14 & 0.050419 & 0.3873 & 0.349972 \tabularnewline
15 & -0.151657 & -1.1649 & 0.124374 \tabularnewline
16 & -0.01584 & -0.1217 & 0.451787 \tabularnewline
17 & 0.085012 & 0.653 & 0.25815 \tabularnewline
18 & -0.074978 & -0.5759 & 0.28343 \tabularnewline
19 & 0.096566 & 0.7417 & 0.230595 \tabularnewline
20 & 0.014622 & 0.1123 & 0.455478 \tabularnewline
21 & -0.07303 & -0.561 & 0.288477 \tabularnewline
22 & -0.027995 & -0.215 & 0.415242 \tabularnewline
23 & 0.020907 & 0.1606 & 0.436481 \tabularnewline
24 & -0.143976 & -1.1059 & 0.136629 \tabularnewline
25 & -0.148615 & -1.1415 & 0.12913 \tabularnewline
26 & 0.047064 & 0.3615 & 0.359507 \tabularnewline
27 & -0.060021 & -0.461 & 0.323236 \tabularnewline
28 & -0.129133 & -0.9919 & 0.162651 \tabularnewline
29 & 0.042057 & 0.323 & 0.3739 \tabularnewline
30 & -0.130363 & -1.0013 & 0.160377 \tabularnewline
31 & -0.008019 & -0.0616 & 0.475546 \tabularnewline
32 & -0.198181 & -1.5223 & 0.066644 \tabularnewline
33 & -0.094467 & -0.7256 & 0.235471 \tabularnewline
34 & 0.085189 & 0.6544 & 0.257714 \tabularnewline
35 & -0.017543 & -0.1348 & 0.446634 \tabularnewline
36 & 0.000582 & 0.0045 & 0.498224 \tabularnewline
37 & 0.005306 & 0.0408 & 0.483815 \tabularnewline
38 & 0.061691 & 0.4739 & 0.318676 \tabularnewline
39 & -0.088505 & -0.6798 & 0.249639 \tabularnewline
40 & 0.023734 & 0.1823 & 0.427984 \tabularnewline
41 & -0.031995 & -0.2458 & 0.403362 \tabularnewline
42 & 0.066574 & 0.5114 & 0.305502 \tabularnewline
43 & -0.031712 & -0.2436 & 0.404198 \tabularnewline
44 & -0.049343 & -0.379 & 0.35302 \tabularnewline
45 & 0.049272 & 0.3785 & 0.353222 \tabularnewline
46 & 0.049428 & 0.3797 & 0.35278 \tabularnewline
47 & 0.015128 & 0.1162 & 0.453943 \tabularnewline
48 & -0.058329 & -0.448 & 0.327884 \tabularnewline
49 & -0.053296 & -0.4094 & 0.341875 \tabularnewline
50 & -0.048733 & -0.3743 & 0.354751 \tabularnewline
51 & -0.019365 & -0.1487 & 0.441131 \tabularnewline
52 & 0.013774 & 0.1058 & 0.458051 \tabularnewline
53 & -0.006525 & -0.0501 & 0.480098 \tabularnewline
54 & -0.046118 & -0.3542 & 0.36221 \tabularnewline
55 & -0.05292 & -0.4065 & 0.342928 \tabularnewline
56 & -0.040648 & -0.3122 & 0.377985 \tabularnewline
57 & -0.119082 & -0.9147 & 0.182039 \tabularnewline
58 & 0.021066 & 0.1618 & 0.436003 \tabularnewline
59 & NA & NA & NA \tabularnewline
60 & NA & NA & NA \tabularnewline
\hline
\end{tabular}
%Source: https://freestatistics.org/blog/index.php?pk=35714&T=2

[TABLE]
[ROW][C]Partial Autocorrelation Function[/C][/ROW]
[ROW][C]Time lag k[/C][C]PACF(k)[/C][C]T-STAT[/C][C]P-value[/C][/ROW]
[ROW][C]1[/C][C]0.227315[/C][C]1.746[/C][C]0.043005[/C][/ROW]
[ROW][C]2[/C][C]-0.258454[/C][C]-1.9852[/C][C]0.025887[/C][/ROW]
[ROW][C]3[/C][C]-0.004615[/C][C]-0.0354[/C][C]0.485922[/C][/ROW]
[ROW][C]4[/C][C]0.135856[/C][C]1.0435[/C][C]0.15048[/C][/ROW]
[ROW][C]5[/C][C]-0.038206[/C][C]-0.2935[/C][C]0.385099[/C][/ROW]
[ROW][C]6[/C][C]-0.245308[/C][C]-1.8842[/C][C]0.032231[/C][/ROW]
[ROW][C]7[/C][C]0.143581[/C][C]1.1029[/C][C]0.137282[/C][/ROW]
[ROW][C]8[/C][C]-0.116577[/C][C]-0.8954[/C][C]0.187095[/C][/ROW]
[ROW][C]9[/C][C]0.068037[/C][C]0.5226[/C][C]0.301603[/C][/ROW]
[ROW][C]10[/C][C]0.071482[/C][C]0.5491[/C][C]0.292517[/C][/ROW]
[ROW][C]11[/C][C]0.018559[/C][C]0.1426[/C][C]0.443565[/C][/ROW]
[ROW][C]12[/C][C]-0.091108[/C][C]-0.6998[/C][C]0.243396[/C][/ROW]
[ROW][C]13[/C][C]0.106475[/C][C]0.8179[/C][C]0.208366[/C][/ROW]
[ROW][C]14[/C][C]0.050419[/C][C]0.3873[/C][C]0.349972[/C][/ROW]
[ROW][C]15[/C][C]-0.151657[/C][C]-1.1649[/C][C]0.124374[/C][/ROW]
[ROW][C]16[/C][C]-0.01584[/C][C]-0.1217[/C][C]0.451787[/C][/ROW]
[ROW][C]17[/C][C]0.085012[/C][C]0.653[/C][C]0.25815[/C][/ROW]
[ROW][C]18[/C][C]-0.074978[/C][C]-0.5759[/C][C]0.28343[/C][/ROW]
[ROW][C]19[/C][C]0.096566[/C][C]0.7417[/C][C]0.230595[/C][/ROW]
[ROW][C]20[/C][C]0.014622[/C][C]0.1123[/C][C]0.455478[/C][/ROW]
[ROW][C]21[/C][C]-0.07303[/C][C]-0.561[/C][C]0.288477[/C][/ROW]
[ROW][C]22[/C][C]-0.027995[/C][C]-0.215[/C][C]0.415242[/C][/ROW]
[ROW][C]23[/C][C]0.020907[/C][C]0.1606[/C][C]0.436481[/C][/ROW]
[ROW][C]24[/C][C]-0.143976[/C][C]-1.1059[/C][C]0.136629[/C][/ROW]
[ROW][C]25[/C][C]-0.148615[/C][C]-1.1415[/C][C]0.12913[/C][/ROW]
[ROW][C]26[/C][C]0.047064[/C][C]0.3615[/C][C]0.359507[/C][/ROW]
[ROW][C]27[/C][C]-0.060021[/C][C]-0.461[/C][C]0.323236[/C][/ROW]
[ROW][C]28[/C][C]-0.129133[/C][C]-0.9919[/C][C]0.162651[/C][/ROW]
[ROW][C]29[/C][C]0.042057[/C][C]0.323[/C][C]0.3739[/C][/ROW]
[ROW][C]30[/C][C]-0.130363[/C][C]-1.0013[/C][C]0.160377[/C][/ROW]
[ROW][C]31[/C][C]-0.008019[/C][C]-0.0616[/C][C]0.475546[/C][/ROW]
[ROW][C]32[/C][C]-0.198181[/C][C]-1.5223[/C][C]0.066644[/C][/ROW]
[ROW][C]33[/C][C]-0.094467[/C][C]-0.7256[/C][C]0.235471[/C][/ROW]
[ROW][C]34[/C][C]0.085189[/C][C]0.6544[/C][C]0.257714[/C][/ROW]
[ROW][C]35[/C][C]-0.017543[/C][C]-0.1348[/C][C]0.446634[/C][/ROW]
[ROW][C]36[/C][C]0.000582[/C][C]0.0045[/C][C]0.498224[/C][/ROW]
[ROW][C]37[/C][C]0.005306[/C][C]0.0408[/C][C]0.483815[/C][/ROW]
[ROW][C]38[/C][C]0.061691[/C][C]0.4739[/C][C]0.318676[/C][/ROW]
[ROW][C]39[/C][C]-0.088505[/C][C]-0.6798[/C][C]0.249639[/C][/ROW]
[ROW][C]40[/C][C]0.023734[/C][C]0.1823[/C][C]0.427984[/C][/ROW]
[ROW][C]41[/C][C]-0.031995[/C][C]-0.2458[/C][C]0.403362[/C][/ROW]
[ROW][C]42[/C][C]0.066574[/C][C]0.5114[/C][C]0.305502[/C][/ROW]
[ROW][C]43[/C][C]-0.031712[/C][C]-0.2436[/C][C]0.404198[/C][/ROW]
[ROW][C]44[/C][C]-0.049343[/C][C]-0.379[/C][C]0.35302[/C][/ROW]
[ROW][C]45[/C][C]0.049272[/C][C]0.3785[/C][C]0.353222[/C][/ROW]
[ROW][C]46[/C][C]0.049428[/C][C]0.3797[/C][C]0.35278[/C][/ROW]
[ROW][C]47[/C][C]0.015128[/C][C]0.1162[/C][C]0.453943[/C][/ROW]
[ROW][C]48[/C][C]-0.058329[/C][C]-0.448[/C][C]0.327884[/C][/ROW]
[ROW][C]49[/C][C]-0.053296[/C][C]-0.4094[/C][C]0.341875[/C][/ROW]
[ROW][C]50[/C][C]-0.048733[/C][C]-0.3743[/C][C]0.354751[/C][/ROW]
[ROW][C]51[/C][C]-0.019365[/C][C]-0.1487[/C][C]0.441131[/C][/ROW]
[ROW][C]52[/C][C]0.013774[/C][C]0.1058[/C][C]0.458051[/C][/ROW]
[ROW][C]53[/C][C]-0.006525[/C][C]-0.0501[/C][C]0.480098[/C][/ROW]
[ROW][C]54[/C][C]-0.046118[/C][C]-0.3542[/C][C]0.36221[/C][/ROW]
[ROW][C]55[/C][C]-0.05292[/C][C]-0.4065[/C][C]0.342928[/C][/ROW]
[ROW][C]56[/C][C]-0.040648[/C][C]-0.3122[/C][C]0.377985[/C][/ROW]
[ROW][C]57[/C][C]-0.119082[/C][C]-0.9147[/C][C]0.182039[/C][/ROW]
[ROW][C]58[/C][C]0.021066[/C][C]0.1618[/C][C]0.436003[/C][/ROW]
[ROW][C]59[/C][C]NA[/C][C]NA[/C][C]NA[/C][/ROW]
[ROW][C]60[/C][C]NA[/C][C]NA[/C][C]NA[/C][/ROW]
[/TABLE]
Source: https://freestatistics.org/blog/index.php?pk=35714&T=2

Globally Unique Identifier (entire table): ba.freestatistics.org/blog/index.php?pk=35714&T=2

As an alternative you can also use a QR Code:  

The GUIDs for individual cells are displayed in the table below:

Partial Autocorrelation Function
Time lag kPACF(k)T-STATP-value
10.2273151.7460.043005
2-0.258454-1.98520.025887
3-0.004615-0.03540.485922
40.1358561.04350.15048
5-0.038206-0.29350.385099
6-0.245308-1.88420.032231
70.1435811.10290.137282
8-0.116577-0.89540.187095
90.0680370.52260.301603
100.0714820.54910.292517
110.0185590.14260.443565
12-0.091108-0.69980.243396
130.1064750.81790.208366
140.0504190.38730.349972
15-0.151657-1.16490.124374
16-0.01584-0.12170.451787
170.0850120.6530.25815
18-0.074978-0.57590.28343
190.0965660.74170.230595
200.0146220.11230.455478
21-0.07303-0.5610.288477
22-0.027995-0.2150.415242
230.0209070.16060.436481
24-0.143976-1.10590.136629
25-0.148615-1.14150.12913
260.0470640.36150.359507
27-0.060021-0.4610.323236
28-0.129133-0.99190.162651
290.0420570.3230.3739
30-0.130363-1.00130.160377
31-0.008019-0.06160.475546
32-0.198181-1.52230.066644
33-0.094467-0.72560.235471
340.0851890.65440.257714
35-0.017543-0.13480.446634
360.0005820.00450.498224
370.0053060.04080.483815
380.0616910.47390.318676
39-0.088505-0.67980.249639
400.0237340.18230.427984
41-0.031995-0.24580.403362
420.0665740.51140.305502
43-0.031712-0.24360.404198
44-0.049343-0.3790.35302
450.0492720.37850.353222
460.0494280.37970.35278
470.0151280.11620.453943
48-0.058329-0.4480.327884
49-0.053296-0.40940.341875
50-0.048733-0.37430.354751
51-0.019365-0.14870.441131
520.0137740.10580.458051
53-0.006525-0.05010.480098
54-0.046118-0.35420.36221
55-0.05292-0.40650.342928
56-0.040648-0.31220.377985
57-0.119082-0.91470.182039
580.0210660.16180.436003
59NANANA
60NANANA


Parameters (Session):
par1 = 4 ;
Parameters (R input):
par1 = 60 ; par2 = 1 ; par3 = 1 ; par4 = 0 ; par5 = 12 ;
R code (references can be found in the software module):
if (par1 == 'Default') {
par1 = 10*log10(length(x))
} else {
par1 <- as.numeric(par1)
}
par2 <- as.numeric(par2)
par3 <- as.numeric(par3)
par4 <- as.numeric(par4)
par5 <- as.numeric(par5)
if (par2 == 0) {
x <- log(x)
} else {
x <- (x ^ par2 - 1) / par2
}
if (par3 > 0) x <- diff(x,lag=1,difference=par3)
if (par4 > 0) x <- diff(x,lag=par5,difference=par4)
bitmap(file='pic1.png')
racf <- acf(x,par1,main='Autocorrelation',xlab='lags',ylab='ACF')
dev.off()
bitmap(file='pic2.png')
rpacf <- pacf(x,par1,main='Partial Autocorrelation',xlab='lags',ylab='PACF')
dev.off()
(myacf <- c(racf$acf))
(mypacf <- c(rpacf$acf))
lengthx <- length(x)
sqrtn <- sqrt(lengthx)
load(file='createtable')
a<-table.start()
a<-table.row.start(a)
a<-table.element(a,'Autocorrelation Function',4,TRUE)
a<-table.row.end(a)
a<-table.row.start(a)
a<-table.element(a,'Time lag k',header=TRUE)
a<-table.element(a,hyperlink('basics.htm','ACF(k)','click here for more information about the Autocorrelation Function'),header=TRUE)
a<-table.element(a,'T-STAT',header=TRUE)
a<-table.element(a,'P-value',header=TRUE)
a<-table.row.end(a)
for (i in 2:(par1+1)) {
a<-table.row.start(a)
a<-table.element(a,i-1,header=TRUE)
a<-table.element(a,round(myacf[i],6))
mytstat <- myacf[i]*sqrtn
a<-table.element(a,round(mytstat,4))
a<-table.element(a,round(1-pt(abs(mytstat),lengthx),6))
a<-table.row.end(a)
}
a<-table.end(a)
table.save(a,file='mytable.tab')
a<-table.start()
a<-table.row.start(a)
a<-table.element(a,'Partial Autocorrelation Function',4,TRUE)
a<-table.row.end(a)
a<-table.row.start(a)
a<-table.element(a,'Time lag k',header=TRUE)
a<-table.element(a,hyperlink('basics.htm','PACF(k)','click here for more information about the Partial Autocorrelation Function'),header=TRUE)
a<-table.element(a,'T-STAT',header=TRUE)
a<-table.element(a,'P-value',header=TRUE)
a<-table.row.end(a)
for (i in 1:par1) {
a<-table.row.start(a)
a<-table.element(a,i,header=TRUE)
a<-table.element(a,round(mypacf[i],6))
mytstat <- mypacf[i]*sqrtn
a<-table.element(a,round(mytstat,4))
a<-table.element(a,round(1-pt(abs(mytstat),lengthx),6))
a<-table.row.end(a)
}
a<-table.end(a)
table.save(a,file='mytable1.tab')