Free Statistics

of Irreproducible Research!

Author's title

Author*Unverified author*
R Software Modulerwasp_smp.wasp
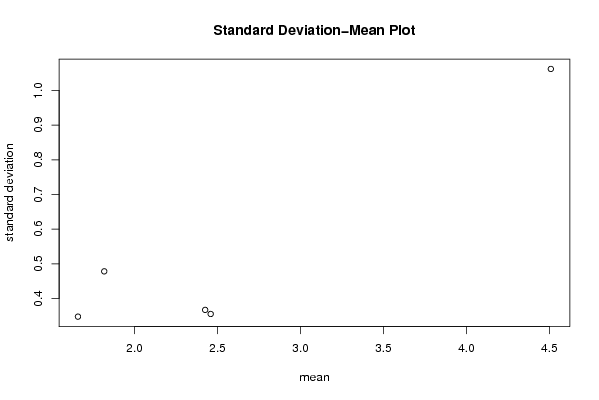
Title produced by softwareStandard Deviation-Mean Plot
Date of computationSun, 21 Dec 2008 10:01:52 -0700
Cite this page as followsStatistical Computations at FreeStatistics.org, Office for Research Development and Education, URL https://freestatistics.org/blog/index.php?v=date/2008/Dec/21/t1229881151cycusfu3tgo7mww.htm/, Retrieved Sun, 19 May 2024 08:50:59 +0000
Statistical Computations at FreeStatistics.org, Office for Research Development and Education, URL https://freestatistics.org/blog/index.php?pk=35707, Retrieved Sun, 19 May 2024 08:50:59 +0000
QR Codes:

Original text written by user:
IsPrivate?No (this computation is public)
User-defined keywords
Estimated Impact137
Family? (F = Feedback message, R = changed R code, M = changed R Module, P = changed Parameters, D = changed Data)
F       [Standard Deviation-Mean Plot] [Paper ] [2008-12-21 17:01:52] [d41d8cd98f00b204e9800998ecf8427e] [Current]
F RMPD    [Cross Correlation Function] [Paper ] [2008-12-21 21:37:45] [fadb34a91ae52f73505d685a320f62da]
F RMPD    [Cross Correlation Function] [Paper ] [2008-12-21 21:49:43] [fadb34a91ae52f73505d685a320f62da]
Feedback Forum
2009-01-07 19:22:01 [Aurélie Van Impe] [reply
Hier heb je gebruik gemaakt van de standaarddeviatie, dat is goed. Je uitleg is hier correcter.Je hebt ook de correcte lambda gebruikt hier. Opnieuw moet ik vermelden dat ik niet weet over welke nulhypothese je het hebt, die had je erbij mogen vermelden.

Post a new message
Dataseries X:
1,8
1,7
1,4
1,2
1
1,7
2,4
2
2,1
2
1,8
2,7
2,3
1,9
2
2,3
2,8
2,4
2,3
2,7
2,7
2,9
3
2,2
2,3
2,8
2,8
2,8
2,2
2,6
2,8
2,5
2,4
2,3
1,9
1,7
2
2,1
1,7
1,8
1,8
1,8
1,3
1,3
1,3
1,2
1,4
2,2
2,9
3,1
3,5
3,6
4,4
4,1
5,1
5,8
5,9
5,4
5,5
4,8
3,2


Summary of computational transaction
Raw Inputview raw input (R code)
Raw Outputview raw output of R engine
Computing time4 seconds
R Server'Herman Ole Andreas Wold' @ 193.190.124.10:1001

\begin{tabular}{lllllllll}
\hline
Summary of computational transaction \tabularnewline
Raw Input & view raw input (R code)  \tabularnewline
Raw Output & view raw output of R engine  \tabularnewline
Computing time & 4 seconds \tabularnewline
R Server & 'Herman Ole Andreas Wold' @ 193.190.124.10:1001 \tabularnewline
\hline
\end{tabular}
%Source: https://freestatistics.org/blog/index.php?pk=35707&T=0

[TABLE]
[ROW][C]Summary of computational transaction[/C][/ROW]
[ROW][C]Raw Input[/C][C]view raw input (R code) [/C][/ROW]
[ROW][C]Raw Output[/C][C]view raw output of R engine [/C][/ROW]
[ROW][C]Computing time[/C][C]4 seconds[/C][/ROW]
[ROW][C]R Server[/C][C]'Herman Ole Andreas Wold' @ 193.190.124.10:1001[/C][/ROW]
[/TABLE]
Source: https://freestatistics.org/blog/index.php?pk=35707&T=0

Globally Unique Identifier (entire table): ba.freestatistics.org/blog/index.php?pk=35707&T=0

As an alternative you can also use a QR Code:  

The GUIDs for individual cells are displayed in the table below:

Summary of computational transaction
Raw Inputview raw input (R code)
Raw Outputview raw output of R engine
Computing time4 seconds
R Server'Herman Ole Andreas Wold' @ 193.190.124.10:1001


Standard Deviation-Mean Plot
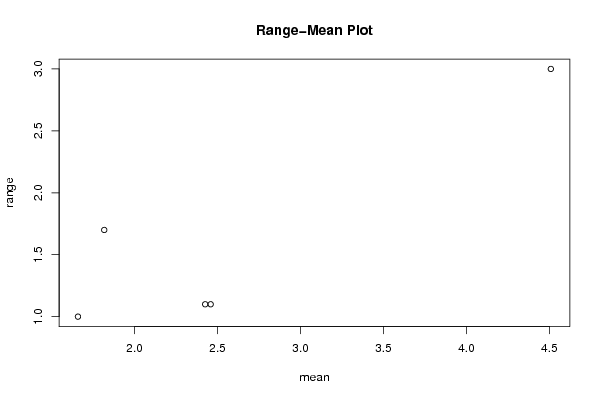
SectionMeanStandard DeviationRange
11.816666666666670.4783177592227561.7
22.458333333333330.3553700589355821.1
32.4250.3671140521319321.1
41.658333333333330.3476108935769041
54.508333333333331.062123373533443

\begin{tabular}{lllllllll}
\hline
Standard Deviation-Mean Plot \tabularnewline
Section & Mean & Standard Deviation & Range \tabularnewline
1 & 1.81666666666667 & 0.478317759222756 & 1.7 \tabularnewline
2 & 2.45833333333333 & 0.355370058935582 & 1.1 \tabularnewline
3 & 2.425 & 0.367114052131932 & 1.1 \tabularnewline
4 & 1.65833333333333 & 0.347610893576904 & 1 \tabularnewline
5 & 4.50833333333333 & 1.06212337353344 & 3 \tabularnewline
\hline
\end{tabular}
%Source: https://freestatistics.org/blog/index.php?pk=35707&T=1

[TABLE]
[ROW][C]Standard Deviation-Mean Plot[/C][/ROW]
[ROW][C]Section[/C][C]Mean[/C][C]Standard Deviation[/C][C]Range[/C][/ROW]
[ROW][C]1[/C][C]1.81666666666667[/C][C]0.478317759222756[/C][C]1.7[/C][/ROW]
[ROW][C]2[/C][C]2.45833333333333[/C][C]0.355370058935582[/C][C]1.1[/C][/ROW]
[ROW][C]3[/C][C]2.425[/C][C]0.367114052131932[/C][C]1.1[/C][/ROW]
[ROW][C]4[/C][C]1.65833333333333[/C][C]0.347610893576904[/C][C]1[/C][/ROW]
[ROW][C]5[/C][C]4.50833333333333[/C][C]1.06212337353344[/C][C]3[/C][/ROW]
[/TABLE]
Source: https://freestatistics.org/blog/index.php?pk=35707&T=1

Globally Unique Identifier (entire table): ba.freestatistics.org/blog/index.php?pk=35707&T=1

As an alternative you can also use a QR Code:  

The GUIDs for individual cells are displayed in the table below:

Standard Deviation-Mean Plot
SectionMeanStandard DeviationRange
11.816666666666670.4783177592227561.7
22.458333333333330.3553700589355821.1
32.4250.3671140521319321.1
41.658333333333330.3476108935769041
54.508333333333331.062123373533443


Regression: S.E.(k) = alpha + beta * Mean(k)
alpha-0.112592142496535
beta0.246644832892484
S.D.0.062148255042303
T-STAT3.96865258283757
p-value0.0285906151475686

\begin{tabular}{lllllllll}
\hline
Regression: S.E.(k) = alpha + beta * Mean(k) \tabularnewline
alpha & -0.112592142496535 \tabularnewline
beta & 0.246644832892484 \tabularnewline
S.D. & 0.062148255042303 \tabularnewline
T-STAT & 3.96865258283757 \tabularnewline
p-value & 0.0285906151475686 \tabularnewline
\hline
\end{tabular}
%Source: https://freestatistics.org/blog/index.php?pk=35707&T=2

[TABLE]
[ROW][C]Regression: S.E.(k) = alpha + beta * Mean(k)[/C][/ROW]
[ROW][C]alpha[/C][C]-0.112592142496535[/C][/ROW]
[ROW][C]beta[/C][C]0.246644832892484[/C][/ROW]
[ROW][C]S.D.[/C][C]0.062148255042303[/C][/ROW]
[ROW][C]T-STAT[/C][C]3.96865258283757[/C][/ROW]
[ROW][C]p-value[/C][C]0.0285906151475686[/C][/ROW]
[/TABLE]
Source: https://freestatistics.org/blog/index.php?pk=35707&T=2

Globally Unique Identifier (entire table): ba.freestatistics.org/blog/index.php?pk=35707&T=2

As an alternative you can also use a QR Code:  

The GUIDs for individual cells are displayed in the table below:

Regression: S.E.(k) = alpha + beta * Mean(k)
alpha-0.112592142496535
beta0.246644832892484
S.D.0.062148255042303
T-STAT3.96865258283757
p-value0.0285906151475686


Regression: ln S.E.(k) = alpha + beta * ln Mean(k)
alpha-1.63155380849455
beta0.998441118904237
S.D.0.393764841002997
T-STAT2.53562790512482
p-value0.0850040844052694
Lambda0.00155888109576252

\begin{tabular}{lllllllll}
\hline
Regression: ln S.E.(k) = alpha + beta * ln Mean(k) \tabularnewline
alpha & -1.63155380849455 \tabularnewline
beta & 0.998441118904237 \tabularnewline
S.D. & 0.393764841002997 \tabularnewline
T-STAT & 2.53562790512482 \tabularnewline
p-value & 0.0850040844052694 \tabularnewline
Lambda & 0.00155888109576252 \tabularnewline
\hline
\end{tabular}
%Source: https://freestatistics.org/blog/index.php?pk=35707&T=3

[TABLE]
[ROW][C]Regression: ln S.E.(k) = alpha + beta * ln Mean(k)[/C][/ROW]
[ROW][C]alpha[/C][C]-1.63155380849455[/C][/ROW]
[ROW][C]beta[/C][C]0.998441118904237[/C][/ROW]
[ROW][C]S.D.[/C][C]0.393764841002997[/C][/ROW]
[ROW][C]T-STAT[/C][C]2.53562790512482[/C][/ROW]
[ROW][C]p-value[/C][C]0.0850040844052694[/C][/ROW]
[ROW][C]Lambda[/C][C]0.00155888109576252[/C][/ROW]
[/TABLE]
Source: https://freestatistics.org/blog/index.php?pk=35707&T=3

Globally Unique Identifier (entire table): ba.freestatistics.org/blog/index.php?pk=35707&T=3

As an alternative you can also use a QR Code:  

The GUIDs for individual cells are displayed in the table below:

Regression: ln S.E.(k) = alpha + beta * ln Mean(k)
alpha-1.63155380849455
beta0.998441118904237
S.D.0.393764841002997
T-STAT2.53562790512482
p-value0.0850040844052694
Lambda0.00155888109576252


Parameters (Session):
par1 = 12 ;
Parameters (R input):
par1 = 12 ;
R code (references can be found in the software module):
par1 <- as.numeric(par1)
(n <- length(x))
(np <- floor(n / par1))
arr <- array(NA,dim=c(par1,np))
j <- 0
k <- 1
for (i in 1:(np*par1))
{
j = j + 1
arr[j,k] <- x[i]
if (j == par1) {
j = 0
k=k+1
}
}
arr
arr.mean <- array(NA,dim=np)
arr.sd <- array(NA,dim=np)
arr.range <- array(NA,dim=np)
for (j in 1:np)
{
arr.mean[j] <- mean(arr[,j],na.rm=TRUE)
arr.sd[j] <- sd(arr[,j],na.rm=TRUE)
arr.range[j] <- max(arr[,j],na.rm=TRUE) - min(arr[,j],na.rm=TRUE)
}
arr.mean
arr.sd
arr.range
(lm1 <- lm(arr.sd~arr.mean))
(lnlm1 <- lm(log(arr.sd)~log(arr.mean)))
(lm2 <- lm(arr.range~arr.mean))
bitmap(file='test1.png')
plot(arr.mean,arr.sd,main='Standard Deviation-Mean Plot',xlab='mean',ylab='standard deviation')
dev.off()
bitmap(file='test2.png')
plot(arr.mean,arr.range,main='Range-Mean Plot',xlab='mean',ylab='range')
dev.off()
load(file='createtable')
a<-table.start()
a<-table.row.start(a)
a<-table.element(a,'Standard Deviation-Mean Plot',4,TRUE)
a<-table.row.end(a)
a<-table.row.start(a)
a<-table.element(a,'Section',header=TRUE)
a<-table.element(a,'Mean',header=TRUE)
a<-table.element(a,'Standard Deviation',header=TRUE)
a<-table.element(a,'Range',header=TRUE)
a<-table.row.end(a)
for (j in 1:np) {
a<-table.row.start(a)
a<-table.element(a,j,header=TRUE)
a<-table.element(a,arr.mean[j])
a<-table.element(a,arr.sd[j] )
a<-table.element(a,arr.range[j] )
a<-table.row.end(a)
}
a<-table.end(a)
table.save(a,file='mytable.tab')
a<-table.start()
a<-table.row.start(a)
a<-table.element(a,'Regression: S.E.(k) = alpha + beta * Mean(k)',2,TRUE)
a<-table.row.end(a)
a<-table.row.start(a)
a<-table.element(a,'alpha',header=TRUE)
a<-table.element(a,lm1$coefficients[[1]])
a<-table.row.end(a)
a<-table.row.start(a)
a<-table.element(a,'beta',header=TRUE)
a<-table.element(a,lm1$coefficients[[2]])
a<-table.row.end(a)
a<-table.row.start(a)
a<-table.element(a,'S.D.',header=TRUE)
a<-table.element(a,summary(lm1)$coefficients[2,2])
a<-table.row.end(a)
a<-table.row.start(a)
a<-table.element(a,'T-STAT',header=TRUE)
a<-table.element(a,summary(lm1)$coefficients[2,3])
a<-table.row.end(a)
a<-table.row.start(a)
a<-table.element(a,'p-value',header=TRUE)
a<-table.element(a,summary(lm1)$coefficients[2,4])
a<-table.row.end(a)
a<-table.end(a)
table.save(a,file='mytable1.tab')
a<-table.start()
a<-table.row.start(a)
a<-table.element(a,'Regression: ln S.E.(k) = alpha + beta * ln Mean(k)',2,TRUE)
a<-table.row.end(a)
a<-table.row.start(a)
a<-table.element(a,'alpha',header=TRUE)
a<-table.element(a,lnlm1$coefficients[[1]])
a<-table.row.end(a)
a<-table.row.start(a)
a<-table.element(a,'beta',header=TRUE)
a<-table.element(a,lnlm1$coefficients[[2]])
a<-table.row.end(a)
a<-table.row.start(a)
a<-table.element(a,'S.D.',header=TRUE)
a<-table.element(a,summary(lnlm1)$coefficients[2,2])
a<-table.row.end(a)
a<-table.row.start(a)
a<-table.element(a,'T-STAT',header=TRUE)
a<-table.element(a,summary(lnlm1)$coefficients[2,3])
a<-table.row.end(a)
a<-table.row.start(a)
a<-table.element(a,'p-value',header=TRUE)
a<-table.element(a,summary(lnlm1)$coefficients[2,4])
a<-table.row.end(a)
a<-table.row.start(a)
a<-table.element(a,'Lambda',header=TRUE)
a<-table.element(a,1-lnlm1$coefficients[[2]])
a<-table.row.end(a)
a<-table.end(a)
table.save(a,file='mytable2.tab')