Free Statistics

of Irreproducible Research!

Author's title

Author*The author of this computation has been verified*
R Software Modulerwasp_autocorrelation.wasp
Title produced by software(Partial) Autocorrelation Function
Date of computationSun, 21 Dec 2008 06:57:40 -0700
Cite this page as followsStatistical Computations at FreeStatistics.org, Office for Research Development and Education, URL https://freestatistics.org/blog/index.php?v=date/2008/Dec/21/t1229867954ixniw04cvgo1pfh.htm/, Retrieved Sun, 19 May 2024 11:15:42 +0000
Statistical Computations at FreeStatistics.org, Office for Research Development and Education, URL https://freestatistics.org/blog/index.php?pk=35582, Retrieved Sun, 19 May 2024 11:15:42 +0000
QR Codes:

Original text written by user:
IsPrivate?No (this computation is public)
User-defined keywords
Estimated Impact172
Family? (F = Feedback message, R = changed R code, M = changed R Module, P = changed Parameters, D = changed Data)
-     [(Partial) Autocorrelation Function] [(Partial) autocor...] [2008-12-21 10:44:06] [8b0d202c3a0c4ea223fd8b8e731dacd8]
-   P   [(Partial) Autocorrelation Function] [ACF werkloosheid] [2008-12-21 11:01:48] [8b0d202c3a0c4ea223fd8b8e731dacd8]
-   PD    [(Partial) Autocorrelation Function] [ACF, PACF inschri...] [2008-12-21 13:24:41] [8b0d202c3a0c4ea223fd8b8e731dacd8]
-   P         [(Partial) Autocorrelation Function] [ACF inschr. perso...] [2008-12-21 13:57:40] [9ba97de59bb4d2edf0cfeac4ca7d2b73] [Current]
Feedback Forum

Post a new message
Dataseries X:
58608
46865
51378
46235
47206
45382
41227
33795
31295
42625
33625
21538
56421
53152
53536
52408
41454
38271
35306
26414
31917
38030
27534
18387
50556
43901
48572
43899
37532
40357
35489
29027
34485
42598
30306
26451
47460
50104
61465
53726
39477
43895
31481
29896
33842
39120
33702
25094
51442
45594
52518
48564
41745
49585
32747
33379
35645
37034
35681
20972
58552
54955
65540
51570
51145
46641
35704
33253
35193
41668
34865
21210
56126
49231
59723
48103
47472
50497
40059
34149
36860
46356
36577
23872


Summary of computational transaction
Raw Inputview raw input (R code)
Raw Outputview raw output of R engine
Computing time1 seconds
R Server'Gwilym Jenkins' @ 72.249.127.135

\begin{tabular}{lllllllll}
\hline
Summary of computational transaction \tabularnewline
Raw Input & view raw input (R code)  \tabularnewline
Raw Output & view raw output of R engine  \tabularnewline
Computing time & 1 seconds \tabularnewline
R Server & 'Gwilym Jenkins' @ 72.249.127.135 \tabularnewline
\hline
\end{tabular}
%Source: https://freestatistics.org/blog/index.php?pk=35582&T=0

[TABLE]
[ROW][C]Summary of computational transaction[/C][/ROW]
[ROW][C]Raw Input[/C][C]view raw input (R code) [/C][/ROW]
[ROW][C]Raw Output[/C][C]view raw output of R engine [/C][/ROW]
[ROW][C]Computing time[/C][C]1 seconds[/C][/ROW]
[ROW][C]R Server[/C][C]'Gwilym Jenkins' @ 72.249.127.135[/C][/ROW]
[/TABLE]
Source: https://freestatistics.org/blog/index.php?pk=35582&T=0

Globally Unique Identifier (entire table): ba.freestatistics.org/blog/index.php?pk=35582&T=0

As an alternative you can also use a QR Code:  

The GUIDs for individual cells are displayed in the table below:

Summary of computational transaction
Raw Inputview raw input (R code)
Raw Outputview raw output of R engine
Computing time1 seconds
R Server'Gwilym Jenkins' @ 72.249.127.135


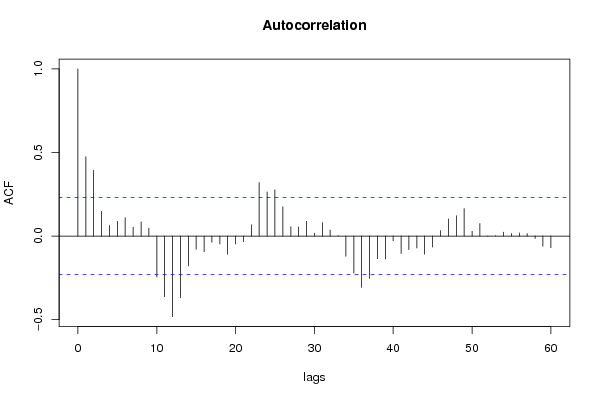
Autocorrelation Function
Time lag kACF(k)T-STATP-value
10.4752624.03276.8e-05
20.3931733.33620.000673
30.148311.25850.106147
40.0636490.54010.295406
50.0880460.74710.228719
60.109760.93130.177394
70.0532240.45160.32645
80.0845520.71740.23771
90.0476540.40440.343574
10-0.244977-2.07870.020604
11-0.3637-3.08610.001439
12-0.48208-4.09065.5e-05
13-0.3697-3.1370.001236
14-0.178271-1.51270.067369
15-0.079298-0.67290.251594
16-0.093431-0.79280.215252
17-0.037305-0.31650.376253
18-0.047235-0.40080.344876
19-0.108901-0.92410.179272
20-0.047169-0.40020.345082
21-0.033885-0.28750.387269
220.0674580.57240.284417
230.3199292.71470.004149
240.2639472.23970.014101
250.2771752.35190.010708
260.1758551.49220.07001
270.0560030.47520.318042
280.0546470.46370.322132
290.088260.74890.228176
300.0164140.13930.444808
310.0803670.68190.248734
320.0358080.30380.381063
330.002310.01960.492207
34-0.120718-1.02430.154556
35-0.221505-1.87950.032109
36-0.307305-2.60760.005539
37-0.254463-2.15920.017084
38-0.135231-1.14750.127492
39-0.136496-1.15820.125304
40-0.028453-0.24140.404953
41-0.104515-0.88680.189059
42-0.081004-0.68730.247038
43-0.071231-0.60440.273734
44-0.108423-0.920.180324
45-0.065483-0.55560.290089
460.0328730.27890.390548
470.1026880.87130.193233
480.1215981.03180.152811
490.1646641.39720.083319
500.0285620.24240.404596
510.0752210.63830.26266
52-0.000914-0.00780.496917
530.0016470.0140.494445
540.0233380.1980.42179
550.0159320.13520.44642
560.0188280.15980.43676
570.0148890.12630.449908
58-0.014334-0.12160.451765
59-0.060955-0.51720.303292
60-0.069257-0.58770.279299

\begin{tabular}{lllllllll}
\hline
Autocorrelation Function \tabularnewline
Time lag k & ACF(k) & T-STAT & P-value \tabularnewline
1 & 0.475262 & 4.0327 & 6.8e-05 \tabularnewline
2 & 0.393173 & 3.3362 & 0.000673 \tabularnewline
3 & 0.14831 & 1.2585 & 0.106147 \tabularnewline
4 & 0.063649 & 0.5401 & 0.295406 \tabularnewline
5 & 0.088046 & 0.7471 & 0.228719 \tabularnewline
6 & 0.10976 & 0.9313 & 0.177394 \tabularnewline
7 & 0.053224 & 0.4516 & 0.32645 \tabularnewline
8 & 0.084552 & 0.7174 & 0.23771 \tabularnewline
9 & 0.047654 & 0.4044 & 0.343574 \tabularnewline
10 & -0.244977 & -2.0787 & 0.020604 \tabularnewline
11 & -0.3637 & -3.0861 & 0.001439 \tabularnewline
12 & -0.48208 & -4.0906 & 5.5e-05 \tabularnewline
13 & -0.3697 & -3.137 & 0.001236 \tabularnewline
14 & -0.178271 & -1.5127 & 0.067369 \tabularnewline
15 & -0.079298 & -0.6729 & 0.251594 \tabularnewline
16 & -0.093431 & -0.7928 & 0.215252 \tabularnewline
17 & -0.037305 & -0.3165 & 0.376253 \tabularnewline
18 & -0.047235 & -0.4008 & 0.344876 \tabularnewline
19 & -0.108901 & -0.9241 & 0.179272 \tabularnewline
20 & -0.047169 & -0.4002 & 0.345082 \tabularnewline
21 & -0.033885 & -0.2875 & 0.387269 \tabularnewline
22 & 0.067458 & 0.5724 & 0.284417 \tabularnewline
23 & 0.319929 & 2.7147 & 0.004149 \tabularnewline
24 & 0.263947 & 2.2397 & 0.014101 \tabularnewline
25 & 0.277175 & 2.3519 & 0.010708 \tabularnewline
26 & 0.175855 & 1.4922 & 0.07001 \tabularnewline
27 & 0.056003 & 0.4752 & 0.318042 \tabularnewline
28 & 0.054647 & 0.4637 & 0.322132 \tabularnewline
29 & 0.08826 & 0.7489 & 0.228176 \tabularnewline
30 & 0.016414 & 0.1393 & 0.444808 \tabularnewline
31 & 0.080367 & 0.6819 & 0.248734 \tabularnewline
32 & 0.035808 & 0.3038 & 0.381063 \tabularnewline
33 & 0.00231 & 0.0196 & 0.492207 \tabularnewline
34 & -0.120718 & -1.0243 & 0.154556 \tabularnewline
35 & -0.221505 & -1.8795 & 0.032109 \tabularnewline
36 & -0.307305 & -2.6076 & 0.005539 \tabularnewline
37 & -0.254463 & -2.1592 & 0.017084 \tabularnewline
38 & -0.135231 & -1.1475 & 0.127492 \tabularnewline
39 & -0.136496 & -1.1582 & 0.125304 \tabularnewline
40 & -0.028453 & -0.2414 & 0.404953 \tabularnewline
41 & -0.104515 & -0.8868 & 0.189059 \tabularnewline
42 & -0.081004 & -0.6873 & 0.247038 \tabularnewline
43 & -0.071231 & -0.6044 & 0.273734 \tabularnewline
44 & -0.108423 & -0.92 & 0.180324 \tabularnewline
45 & -0.065483 & -0.5556 & 0.290089 \tabularnewline
46 & 0.032873 & 0.2789 & 0.390548 \tabularnewline
47 & 0.102688 & 0.8713 & 0.193233 \tabularnewline
48 & 0.121598 & 1.0318 & 0.152811 \tabularnewline
49 & 0.164664 & 1.3972 & 0.083319 \tabularnewline
50 & 0.028562 & 0.2424 & 0.404596 \tabularnewline
51 & 0.075221 & 0.6383 & 0.26266 \tabularnewline
52 & -0.000914 & -0.0078 & 0.496917 \tabularnewline
53 & 0.001647 & 0.014 & 0.494445 \tabularnewline
54 & 0.023338 & 0.198 & 0.42179 \tabularnewline
55 & 0.015932 & 0.1352 & 0.44642 \tabularnewline
56 & 0.018828 & 0.1598 & 0.43676 \tabularnewline
57 & 0.014889 & 0.1263 & 0.449908 \tabularnewline
58 & -0.014334 & -0.1216 & 0.451765 \tabularnewline
59 & -0.060955 & -0.5172 & 0.303292 \tabularnewline
60 & -0.069257 & -0.5877 & 0.279299 \tabularnewline
\hline
\end{tabular}
%Source: https://freestatistics.org/blog/index.php?pk=35582&T=1

[TABLE]
[ROW][C]Autocorrelation Function[/C][/ROW]
[ROW][C]Time lag k[/C][C]ACF(k)[/C][C]T-STAT[/C][C]P-value[/C][/ROW]
[ROW][C]1[/C][C]0.475262[/C][C]4.0327[/C][C]6.8e-05[/C][/ROW]
[ROW][C]2[/C][C]0.393173[/C][C]3.3362[/C][C]0.000673[/C][/ROW]
[ROW][C]3[/C][C]0.14831[/C][C]1.2585[/C][C]0.106147[/C][/ROW]
[ROW][C]4[/C][C]0.063649[/C][C]0.5401[/C][C]0.295406[/C][/ROW]
[ROW][C]5[/C][C]0.088046[/C][C]0.7471[/C][C]0.228719[/C][/ROW]
[ROW][C]6[/C][C]0.10976[/C][C]0.9313[/C][C]0.177394[/C][/ROW]
[ROW][C]7[/C][C]0.053224[/C][C]0.4516[/C][C]0.32645[/C][/ROW]
[ROW][C]8[/C][C]0.084552[/C][C]0.7174[/C][C]0.23771[/C][/ROW]
[ROW][C]9[/C][C]0.047654[/C][C]0.4044[/C][C]0.343574[/C][/ROW]
[ROW][C]10[/C][C]-0.244977[/C][C]-2.0787[/C][C]0.020604[/C][/ROW]
[ROW][C]11[/C][C]-0.3637[/C][C]-3.0861[/C][C]0.001439[/C][/ROW]
[ROW][C]12[/C][C]-0.48208[/C][C]-4.0906[/C][C]5.5e-05[/C][/ROW]
[ROW][C]13[/C][C]-0.3697[/C][C]-3.137[/C][C]0.001236[/C][/ROW]
[ROW][C]14[/C][C]-0.178271[/C][C]-1.5127[/C][C]0.067369[/C][/ROW]
[ROW][C]15[/C][C]-0.079298[/C][C]-0.6729[/C][C]0.251594[/C][/ROW]
[ROW][C]16[/C][C]-0.093431[/C][C]-0.7928[/C][C]0.215252[/C][/ROW]
[ROW][C]17[/C][C]-0.037305[/C][C]-0.3165[/C][C]0.376253[/C][/ROW]
[ROW][C]18[/C][C]-0.047235[/C][C]-0.4008[/C][C]0.344876[/C][/ROW]
[ROW][C]19[/C][C]-0.108901[/C][C]-0.9241[/C][C]0.179272[/C][/ROW]
[ROW][C]20[/C][C]-0.047169[/C][C]-0.4002[/C][C]0.345082[/C][/ROW]
[ROW][C]21[/C][C]-0.033885[/C][C]-0.2875[/C][C]0.387269[/C][/ROW]
[ROW][C]22[/C][C]0.067458[/C][C]0.5724[/C][C]0.284417[/C][/ROW]
[ROW][C]23[/C][C]0.319929[/C][C]2.7147[/C][C]0.004149[/C][/ROW]
[ROW][C]24[/C][C]0.263947[/C][C]2.2397[/C][C]0.014101[/C][/ROW]
[ROW][C]25[/C][C]0.277175[/C][C]2.3519[/C][C]0.010708[/C][/ROW]
[ROW][C]26[/C][C]0.175855[/C][C]1.4922[/C][C]0.07001[/C][/ROW]
[ROW][C]27[/C][C]0.056003[/C][C]0.4752[/C][C]0.318042[/C][/ROW]
[ROW][C]28[/C][C]0.054647[/C][C]0.4637[/C][C]0.322132[/C][/ROW]
[ROW][C]29[/C][C]0.08826[/C][C]0.7489[/C][C]0.228176[/C][/ROW]
[ROW][C]30[/C][C]0.016414[/C][C]0.1393[/C][C]0.444808[/C][/ROW]
[ROW][C]31[/C][C]0.080367[/C][C]0.6819[/C][C]0.248734[/C][/ROW]
[ROW][C]32[/C][C]0.035808[/C][C]0.3038[/C][C]0.381063[/C][/ROW]
[ROW][C]33[/C][C]0.00231[/C][C]0.0196[/C][C]0.492207[/C][/ROW]
[ROW][C]34[/C][C]-0.120718[/C][C]-1.0243[/C][C]0.154556[/C][/ROW]
[ROW][C]35[/C][C]-0.221505[/C][C]-1.8795[/C][C]0.032109[/C][/ROW]
[ROW][C]36[/C][C]-0.307305[/C][C]-2.6076[/C][C]0.005539[/C][/ROW]
[ROW][C]37[/C][C]-0.254463[/C][C]-2.1592[/C][C]0.017084[/C][/ROW]
[ROW][C]38[/C][C]-0.135231[/C][C]-1.1475[/C][C]0.127492[/C][/ROW]
[ROW][C]39[/C][C]-0.136496[/C][C]-1.1582[/C][C]0.125304[/C][/ROW]
[ROW][C]40[/C][C]-0.028453[/C][C]-0.2414[/C][C]0.404953[/C][/ROW]
[ROW][C]41[/C][C]-0.104515[/C][C]-0.8868[/C][C]0.189059[/C][/ROW]
[ROW][C]42[/C][C]-0.081004[/C][C]-0.6873[/C][C]0.247038[/C][/ROW]
[ROW][C]43[/C][C]-0.071231[/C][C]-0.6044[/C][C]0.273734[/C][/ROW]
[ROW][C]44[/C][C]-0.108423[/C][C]-0.92[/C][C]0.180324[/C][/ROW]
[ROW][C]45[/C][C]-0.065483[/C][C]-0.5556[/C][C]0.290089[/C][/ROW]
[ROW][C]46[/C][C]0.032873[/C][C]0.2789[/C][C]0.390548[/C][/ROW]
[ROW][C]47[/C][C]0.102688[/C][C]0.8713[/C][C]0.193233[/C][/ROW]
[ROW][C]48[/C][C]0.121598[/C][C]1.0318[/C][C]0.152811[/C][/ROW]
[ROW][C]49[/C][C]0.164664[/C][C]1.3972[/C][C]0.083319[/C][/ROW]
[ROW][C]50[/C][C]0.028562[/C][C]0.2424[/C][C]0.404596[/C][/ROW]
[ROW][C]51[/C][C]0.075221[/C][C]0.6383[/C][C]0.26266[/C][/ROW]
[ROW][C]52[/C][C]-0.000914[/C][C]-0.0078[/C][C]0.496917[/C][/ROW]
[ROW][C]53[/C][C]0.001647[/C][C]0.014[/C][C]0.494445[/C][/ROW]
[ROW][C]54[/C][C]0.023338[/C][C]0.198[/C][C]0.42179[/C][/ROW]
[ROW][C]55[/C][C]0.015932[/C][C]0.1352[/C][C]0.44642[/C][/ROW]
[ROW][C]56[/C][C]0.018828[/C][C]0.1598[/C][C]0.43676[/C][/ROW]
[ROW][C]57[/C][C]0.014889[/C][C]0.1263[/C][C]0.449908[/C][/ROW]
[ROW][C]58[/C][C]-0.014334[/C][C]-0.1216[/C][C]0.451765[/C][/ROW]
[ROW][C]59[/C][C]-0.060955[/C][C]-0.5172[/C][C]0.303292[/C][/ROW]
[ROW][C]60[/C][C]-0.069257[/C][C]-0.5877[/C][C]0.279299[/C][/ROW]
[/TABLE]
Source: https://freestatistics.org/blog/index.php?pk=35582&T=1

Globally Unique Identifier (entire table): ba.freestatistics.org/blog/index.php?pk=35582&T=1

As an alternative you can also use a QR Code:  

The GUIDs for individual cells are displayed in the table below:

Autocorrelation Function
Time lag kACF(k)T-STATP-value
10.4752624.03276.8e-05
20.3931733.33620.000673
30.148311.25850.106147
40.0636490.54010.295406
50.0880460.74710.228719
60.109760.93130.177394
70.0532240.45160.32645
80.0845520.71740.23771
90.0476540.40440.343574
10-0.244977-2.07870.020604
11-0.3637-3.08610.001439
12-0.48208-4.09065.5e-05
13-0.3697-3.1370.001236
14-0.178271-1.51270.067369
15-0.079298-0.67290.251594
16-0.093431-0.79280.215252
17-0.037305-0.31650.376253
18-0.047235-0.40080.344876
19-0.108901-0.92410.179272
20-0.047169-0.40020.345082
21-0.033885-0.28750.387269
220.0674580.57240.284417
230.3199292.71470.004149
240.2639472.23970.014101
250.2771752.35190.010708
260.1758551.49220.07001
270.0560030.47520.318042
280.0546470.46370.322132
290.088260.74890.228176
300.0164140.13930.444808
310.0803670.68190.248734
320.0358080.30380.381063
330.002310.01960.492207
34-0.120718-1.02430.154556
35-0.221505-1.87950.032109
36-0.307305-2.60760.005539
37-0.254463-2.15920.017084
38-0.135231-1.14750.127492
39-0.136496-1.15820.125304
40-0.028453-0.24140.404953
41-0.104515-0.88680.189059
42-0.081004-0.68730.247038
43-0.071231-0.60440.273734
44-0.108423-0.920.180324
45-0.065483-0.55560.290089
460.0328730.27890.390548
470.1026880.87130.193233
480.1215981.03180.152811
490.1646641.39720.083319
500.0285620.24240.404596
510.0752210.63830.26266
52-0.000914-0.00780.496917
530.0016470.0140.494445
540.0233380.1980.42179
550.0159320.13520.44642
560.0188280.15980.43676
570.0148890.12630.449908
58-0.014334-0.12160.451765
59-0.060955-0.51720.303292
60-0.069257-0.58770.279299


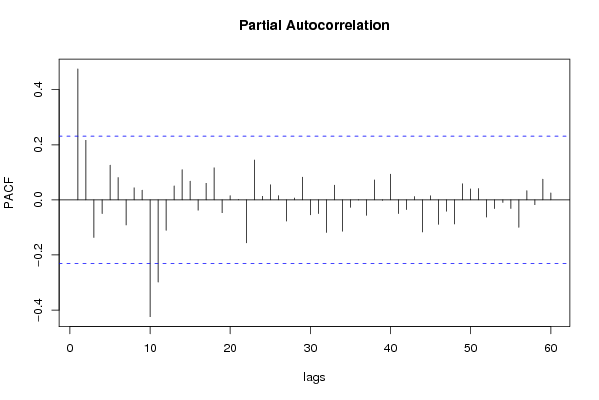
Partial Autocorrelation Function
Time lag kPACF(k)T-STATP-value
10.4752624.03276.8e-05
20.2161141.83380.035409
3-0.136696-1.15990.12496
4-0.049728-0.4220.337157
50.1257351.06690.144792
60.0808770.68630.247376
7-0.091099-0.7730.221025
80.043730.37110.35584
90.0349030.29620.383979
10-0.424121-3.59880.000292
11-0.298418-2.53220.006759
12-0.110835-0.94050.175062
130.0503490.42720.335245
140.1094090.92840.178159
150.0679550.57660.282998
16-0.037629-0.31930.375215
170.0598320.50770.306611
180.1162280.98620.163662
19-0.046738-0.39660.346422
200.0150530.12770.449361
210.0011160.00950.496236
22-0.156127-1.32480.094716
230.1444241.22550.112194
240.0129020.10950.456565
250.0545910.46320.322302
260.0150840.1280.449256
27-0.076908-0.65260.258051
280.0065720.05580.477841
290.0823080.69840.243587
30-0.054536-0.46280.322468
31-0.049878-0.42320.336695
32-0.118183-1.00280.159653
330.0534160.45330.325866
34-0.113624-0.96410.169104
35-0.027274-0.23140.408818
36-0.000385-0.00330.498701
37-0.055978-0.4750.318116
380.072090.61170.271331
39-0.001805-0.01530.493911
400.0930090.78920.21629
41-0.049768-0.42230.337033
42-0.035389-0.30030.382412
430.012020.1020.459522
44-0.116479-0.98840.163144
450.0145480.12340.451049
46-0.088961-0.75490.226399
47-0.041205-0.34960.363816
48-0.087683-0.7440.229643
490.0582520.49430.311306
500.0397320.33710.368498
510.040760.34590.365227
52-0.062502-0.53030.298751
53-0.031536-0.26760.394888
54-0.009375-0.07950.46841
55-0.031126-0.26410.396225
56-0.099908-0.84770.199694
570.0332480.28210.389331
58-0.017513-0.14860.441141
590.0751920.6380.26274
600.0252210.2140.415574

\begin{tabular}{lllllllll}
\hline
Partial Autocorrelation Function \tabularnewline
Time lag k & PACF(k) & T-STAT & P-value \tabularnewline
1 & 0.475262 & 4.0327 & 6.8e-05 \tabularnewline
2 & 0.216114 & 1.8338 & 0.035409 \tabularnewline
3 & -0.136696 & -1.1599 & 0.12496 \tabularnewline
4 & -0.049728 & -0.422 & 0.337157 \tabularnewline
5 & 0.125735 & 1.0669 & 0.144792 \tabularnewline
6 & 0.080877 & 0.6863 & 0.247376 \tabularnewline
7 & -0.091099 & -0.773 & 0.221025 \tabularnewline
8 & 0.04373 & 0.3711 & 0.35584 \tabularnewline
9 & 0.034903 & 0.2962 & 0.383979 \tabularnewline
10 & -0.424121 & -3.5988 & 0.000292 \tabularnewline
11 & -0.298418 & -2.5322 & 0.006759 \tabularnewline
12 & -0.110835 & -0.9405 & 0.175062 \tabularnewline
13 & 0.050349 & 0.4272 & 0.335245 \tabularnewline
14 & 0.109409 & 0.9284 & 0.178159 \tabularnewline
15 & 0.067955 & 0.5766 & 0.282998 \tabularnewline
16 & -0.037629 & -0.3193 & 0.375215 \tabularnewline
17 & 0.059832 & 0.5077 & 0.306611 \tabularnewline
18 & 0.116228 & 0.9862 & 0.163662 \tabularnewline
19 & -0.046738 & -0.3966 & 0.346422 \tabularnewline
20 & 0.015053 & 0.1277 & 0.449361 \tabularnewline
21 & 0.001116 & 0.0095 & 0.496236 \tabularnewline
22 & -0.156127 & -1.3248 & 0.094716 \tabularnewline
23 & 0.144424 & 1.2255 & 0.112194 \tabularnewline
24 & 0.012902 & 0.1095 & 0.456565 \tabularnewline
25 & 0.054591 & 0.4632 & 0.322302 \tabularnewline
26 & 0.015084 & 0.128 & 0.449256 \tabularnewline
27 & -0.076908 & -0.6526 & 0.258051 \tabularnewline
28 & 0.006572 & 0.0558 & 0.477841 \tabularnewline
29 & 0.082308 & 0.6984 & 0.243587 \tabularnewline
30 & -0.054536 & -0.4628 & 0.322468 \tabularnewline
31 & -0.049878 & -0.4232 & 0.336695 \tabularnewline
32 & -0.118183 & -1.0028 & 0.159653 \tabularnewline
33 & 0.053416 & 0.4533 & 0.325866 \tabularnewline
34 & -0.113624 & -0.9641 & 0.169104 \tabularnewline
35 & -0.027274 & -0.2314 & 0.408818 \tabularnewline
36 & -0.000385 & -0.0033 & 0.498701 \tabularnewline
37 & -0.055978 & -0.475 & 0.318116 \tabularnewline
38 & 0.07209 & 0.6117 & 0.271331 \tabularnewline
39 & -0.001805 & -0.0153 & 0.493911 \tabularnewline
40 & 0.093009 & 0.7892 & 0.21629 \tabularnewline
41 & -0.049768 & -0.4223 & 0.337033 \tabularnewline
42 & -0.035389 & -0.3003 & 0.382412 \tabularnewline
43 & 0.01202 & 0.102 & 0.459522 \tabularnewline
44 & -0.116479 & -0.9884 & 0.163144 \tabularnewline
45 & 0.014548 & 0.1234 & 0.451049 \tabularnewline
46 & -0.088961 & -0.7549 & 0.226399 \tabularnewline
47 & -0.041205 & -0.3496 & 0.363816 \tabularnewline
48 & -0.087683 & -0.744 & 0.229643 \tabularnewline
49 & 0.058252 & 0.4943 & 0.311306 \tabularnewline
50 & 0.039732 & 0.3371 & 0.368498 \tabularnewline
51 & 0.04076 & 0.3459 & 0.365227 \tabularnewline
52 & -0.062502 & -0.5303 & 0.298751 \tabularnewline
53 & -0.031536 & -0.2676 & 0.394888 \tabularnewline
54 & -0.009375 & -0.0795 & 0.46841 \tabularnewline
55 & -0.031126 & -0.2641 & 0.396225 \tabularnewline
56 & -0.099908 & -0.8477 & 0.199694 \tabularnewline
57 & 0.033248 & 0.2821 & 0.389331 \tabularnewline
58 & -0.017513 & -0.1486 & 0.441141 \tabularnewline
59 & 0.075192 & 0.638 & 0.26274 \tabularnewline
60 & 0.025221 & 0.214 & 0.415574 \tabularnewline
\hline
\end{tabular}
%Source: https://freestatistics.org/blog/index.php?pk=35582&T=2

[TABLE]
[ROW][C]Partial Autocorrelation Function[/C][/ROW]
[ROW][C]Time lag k[/C][C]PACF(k)[/C][C]T-STAT[/C][C]P-value[/C][/ROW]
[ROW][C]1[/C][C]0.475262[/C][C]4.0327[/C][C]6.8e-05[/C][/ROW]
[ROW][C]2[/C][C]0.216114[/C][C]1.8338[/C][C]0.035409[/C][/ROW]
[ROW][C]3[/C][C]-0.136696[/C][C]-1.1599[/C][C]0.12496[/C][/ROW]
[ROW][C]4[/C][C]-0.049728[/C][C]-0.422[/C][C]0.337157[/C][/ROW]
[ROW][C]5[/C][C]0.125735[/C][C]1.0669[/C][C]0.144792[/C][/ROW]
[ROW][C]6[/C][C]0.080877[/C][C]0.6863[/C][C]0.247376[/C][/ROW]
[ROW][C]7[/C][C]-0.091099[/C][C]-0.773[/C][C]0.221025[/C][/ROW]
[ROW][C]8[/C][C]0.04373[/C][C]0.3711[/C][C]0.35584[/C][/ROW]
[ROW][C]9[/C][C]0.034903[/C][C]0.2962[/C][C]0.383979[/C][/ROW]
[ROW][C]10[/C][C]-0.424121[/C][C]-3.5988[/C][C]0.000292[/C][/ROW]
[ROW][C]11[/C][C]-0.298418[/C][C]-2.5322[/C][C]0.006759[/C][/ROW]
[ROW][C]12[/C][C]-0.110835[/C][C]-0.9405[/C][C]0.175062[/C][/ROW]
[ROW][C]13[/C][C]0.050349[/C][C]0.4272[/C][C]0.335245[/C][/ROW]
[ROW][C]14[/C][C]0.109409[/C][C]0.9284[/C][C]0.178159[/C][/ROW]
[ROW][C]15[/C][C]0.067955[/C][C]0.5766[/C][C]0.282998[/C][/ROW]
[ROW][C]16[/C][C]-0.037629[/C][C]-0.3193[/C][C]0.375215[/C][/ROW]
[ROW][C]17[/C][C]0.059832[/C][C]0.5077[/C][C]0.306611[/C][/ROW]
[ROW][C]18[/C][C]0.116228[/C][C]0.9862[/C][C]0.163662[/C][/ROW]
[ROW][C]19[/C][C]-0.046738[/C][C]-0.3966[/C][C]0.346422[/C][/ROW]
[ROW][C]20[/C][C]0.015053[/C][C]0.1277[/C][C]0.449361[/C][/ROW]
[ROW][C]21[/C][C]0.001116[/C][C]0.0095[/C][C]0.496236[/C][/ROW]
[ROW][C]22[/C][C]-0.156127[/C][C]-1.3248[/C][C]0.094716[/C][/ROW]
[ROW][C]23[/C][C]0.144424[/C][C]1.2255[/C][C]0.112194[/C][/ROW]
[ROW][C]24[/C][C]0.012902[/C][C]0.1095[/C][C]0.456565[/C][/ROW]
[ROW][C]25[/C][C]0.054591[/C][C]0.4632[/C][C]0.322302[/C][/ROW]
[ROW][C]26[/C][C]0.015084[/C][C]0.128[/C][C]0.449256[/C][/ROW]
[ROW][C]27[/C][C]-0.076908[/C][C]-0.6526[/C][C]0.258051[/C][/ROW]
[ROW][C]28[/C][C]0.006572[/C][C]0.0558[/C][C]0.477841[/C][/ROW]
[ROW][C]29[/C][C]0.082308[/C][C]0.6984[/C][C]0.243587[/C][/ROW]
[ROW][C]30[/C][C]-0.054536[/C][C]-0.4628[/C][C]0.322468[/C][/ROW]
[ROW][C]31[/C][C]-0.049878[/C][C]-0.4232[/C][C]0.336695[/C][/ROW]
[ROW][C]32[/C][C]-0.118183[/C][C]-1.0028[/C][C]0.159653[/C][/ROW]
[ROW][C]33[/C][C]0.053416[/C][C]0.4533[/C][C]0.325866[/C][/ROW]
[ROW][C]34[/C][C]-0.113624[/C][C]-0.9641[/C][C]0.169104[/C][/ROW]
[ROW][C]35[/C][C]-0.027274[/C][C]-0.2314[/C][C]0.408818[/C][/ROW]
[ROW][C]36[/C][C]-0.000385[/C][C]-0.0033[/C][C]0.498701[/C][/ROW]
[ROW][C]37[/C][C]-0.055978[/C][C]-0.475[/C][C]0.318116[/C][/ROW]
[ROW][C]38[/C][C]0.07209[/C][C]0.6117[/C][C]0.271331[/C][/ROW]
[ROW][C]39[/C][C]-0.001805[/C][C]-0.0153[/C][C]0.493911[/C][/ROW]
[ROW][C]40[/C][C]0.093009[/C][C]0.7892[/C][C]0.21629[/C][/ROW]
[ROW][C]41[/C][C]-0.049768[/C][C]-0.4223[/C][C]0.337033[/C][/ROW]
[ROW][C]42[/C][C]-0.035389[/C][C]-0.3003[/C][C]0.382412[/C][/ROW]
[ROW][C]43[/C][C]0.01202[/C][C]0.102[/C][C]0.459522[/C][/ROW]
[ROW][C]44[/C][C]-0.116479[/C][C]-0.9884[/C][C]0.163144[/C][/ROW]
[ROW][C]45[/C][C]0.014548[/C][C]0.1234[/C][C]0.451049[/C][/ROW]
[ROW][C]46[/C][C]-0.088961[/C][C]-0.7549[/C][C]0.226399[/C][/ROW]
[ROW][C]47[/C][C]-0.041205[/C][C]-0.3496[/C][C]0.363816[/C][/ROW]
[ROW][C]48[/C][C]-0.087683[/C][C]-0.744[/C][C]0.229643[/C][/ROW]
[ROW][C]49[/C][C]0.058252[/C][C]0.4943[/C][C]0.311306[/C][/ROW]
[ROW][C]50[/C][C]0.039732[/C][C]0.3371[/C][C]0.368498[/C][/ROW]
[ROW][C]51[/C][C]0.04076[/C][C]0.3459[/C][C]0.365227[/C][/ROW]
[ROW][C]52[/C][C]-0.062502[/C][C]-0.5303[/C][C]0.298751[/C][/ROW]
[ROW][C]53[/C][C]-0.031536[/C][C]-0.2676[/C][C]0.394888[/C][/ROW]
[ROW][C]54[/C][C]-0.009375[/C][C]-0.0795[/C][C]0.46841[/C][/ROW]
[ROW][C]55[/C][C]-0.031126[/C][C]-0.2641[/C][C]0.396225[/C][/ROW]
[ROW][C]56[/C][C]-0.099908[/C][C]-0.8477[/C][C]0.199694[/C][/ROW]
[ROW][C]57[/C][C]0.033248[/C][C]0.2821[/C][C]0.389331[/C][/ROW]
[ROW][C]58[/C][C]-0.017513[/C][C]-0.1486[/C][C]0.441141[/C][/ROW]
[ROW][C]59[/C][C]0.075192[/C][C]0.638[/C][C]0.26274[/C][/ROW]
[ROW][C]60[/C][C]0.025221[/C][C]0.214[/C][C]0.415574[/C][/ROW]
[/TABLE]
Source: https://freestatistics.org/blog/index.php?pk=35582&T=2

Globally Unique Identifier (entire table): ba.freestatistics.org/blog/index.php?pk=35582&T=2

As an alternative you can also use a QR Code:  

The GUIDs for individual cells are displayed in the table below:

Partial Autocorrelation Function
Time lag kPACF(k)T-STATP-value
10.4752624.03276.8e-05
20.2161141.83380.035409
3-0.136696-1.15990.12496
4-0.049728-0.4220.337157
50.1257351.06690.144792
60.0808770.68630.247376
7-0.091099-0.7730.221025
80.043730.37110.35584
90.0349030.29620.383979
10-0.424121-3.59880.000292
11-0.298418-2.53220.006759
12-0.110835-0.94050.175062
130.0503490.42720.335245
140.1094090.92840.178159
150.0679550.57660.282998
16-0.037629-0.31930.375215
170.0598320.50770.306611
180.1162280.98620.163662
19-0.046738-0.39660.346422
200.0150530.12770.449361
210.0011160.00950.496236
22-0.156127-1.32480.094716
230.1444241.22550.112194
240.0129020.10950.456565
250.0545910.46320.322302
260.0150840.1280.449256
27-0.076908-0.65260.258051
280.0065720.05580.477841
290.0823080.69840.243587
30-0.054536-0.46280.322468
31-0.049878-0.42320.336695
32-0.118183-1.00280.159653
330.0534160.45330.325866
34-0.113624-0.96410.169104
35-0.027274-0.23140.408818
36-0.000385-0.00330.498701
37-0.055978-0.4750.318116
380.072090.61170.271331
39-0.001805-0.01530.493911
400.0930090.78920.21629
41-0.049768-0.42230.337033
42-0.035389-0.30030.382412
430.012020.1020.459522
44-0.116479-0.98840.163144
450.0145480.12340.451049
46-0.088961-0.75490.226399
47-0.041205-0.34960.363816
48-0.087683-0.7440.229643
490.0582520.49430.311306
500.0397320.33710.368498
510.040760.34590.365227
52-0.062502-0.53030.298751
53-0.031536-0.26760.394888
54-0.009375-0.07950.46841
55-0.031126-0.26410.396225
56-0.099908-0.84770.199694
570.0332480.28210.389331
58-0.017513-0.14860.441141
590.0751920.6380.26274
600.0252210.2140.415574


Parameters (Session):
par1 = 60 ; par2 = 1 ; par3 = 0 ; par4 = 1 ; par5 = 12 ;
Parameters (R input):
par1 = 60 ; par2 = 1 ; par3 = 0 ; par4 = 1 ; par5 = 12 ;
R code (references can be found in the software module):
if (par1 == 'Default') {
par1 = 10*log10(length(x))
} else {
par1 <- as.numeric(par1)
}
par2 <- as.numeric(par2)
par3 <- as.numeric(par3)
par4 <- as.numeric(par4)
par5 <- as.numeric(par5)
if (par2 == 0) {
x <- log(x)
} else {
x <- (x ^ par2 - 1) / par2
}
if (par3 > 0) x <- diff(x,lag=1,difference=par3)
if (par4 > 0) x <- diff(x,lag=par5,difference=par4)
bitmap(file='pic1.png')
racf <- acf(x,par1,main='Autocorrelation',xlab='lags',ylab='ACF')
dev.off()
bitmap(file='pic2.png')
rpacf <- pacf(x,par1,main='Partial Autocorrelation',xlab='lags',ylab='PACF')
dev.off()
(myacf <- c(racf$acf))
(mypacf <- c(rpacf$acf))
lengthx <- length(x)
sqrtn <- sqrt(lengthx)
load(file='createtable')
a<-table.start()
a<-table.row.start(a)
a<-table.element(a,'Autocorrelation Function',4,TRUE)
a<-table.row.end(a)
a<-table.row.start(a)
a<-table.element(a,'Time lag k',header=TRUE)
a<-table.element(a,hyperlink('basics.htm','ACF(k)','click here for more information about the Autocorrelation Function'),header=TRUE)
a<-table.element(a,'T-STAT',header=TRUE)
a<-table.element(a,'P-value',header=TRUE)
a<-table.row.end(a)
for (i in 2:(par1+1)) {
a<-table.row.start(a)
a<-table.element(a,i-1,header=TRUE)
a<-table.element(a,round(myacf[i],6))
mytstat <- myacf[i]*sqrtn
a<-table.element(a,round(mytstat,4))
a<-table.element(a,round(1-pt(abs(mytstat),lengthx),6))
a<-table.row.end(a)
}
a<-table.end(a)
table.save(a,file='mytable.tab')
a<-table.start()
a<-table.row.start(a)
a<-table.element(a,'Partial Autocorrelation Function',4,TRUE)
a<-table.row.end(a)
a<-table.row.start(a)
a<-table.element(a,'Time lag k',header=TRUE)
a<-table.element(a,hyperlink('basics.htm','PACF(k)','click here for more information about the Partial Autocorrelation Function'),header=TRUE)
a<-table.element(a,'T-STAT',header=TRUE)
a<-table.element(a,'P-value',header=TRUE)
a<-table.row.end(a)
for (i in 1:par1) {
a<-table.row.start(a)
a<-table.element(a,i,header=TRUE)
a<-table.element(a,round(mypacf[i],6))
mytstat <- mypacf[i]*sqrtn
a<-table.element(a,round(mytstat,4))
a<-table.element(a,round(1-pt(abs(mytstat),lengthx),6))
a<-table.row.end(a)
}
a<-table.end(a)
table.save(a,file='mytable1.tab')