Free Statistics

of Irreproducible Research!

Author's title

Author*The author of this computation has been verified*
R Software Modulerwasp_autocorrelation.wasp
Title produced by software(Partial) Autocorrelation Function
Date of computationSun, 21 Dec 2008 04:27:19 -0700
Cite this page as followsStatistical Computations at FreeStatistics.org, Office for Research Development and Education, URL https://freestatistics.org/blog/index.php?v=date/2008/Dec/21/t1229858957t7x6ot6s3sixrtu.htm/, Retrieved Sun, 19 May 2024 08:54:38 +0000
Statistical Computations at FreeStatistics.org, Office for Research Development and Education, URL https://freestatistics.org/blog/index.php?pk=35507, Retrieved Sun, 19 May 2024 08:54:38 +0000
QR Codes:

Original text written by user:
IsPrivate?No (this computation is public)
User-defined keywords
Estimated Impact180
Family? (F = Feedback message, R = changed R code, M = changed R Module, P = changed Parameters, D = changed Data)
-     [Standard Deviation-Mean Plot] [SMP inschrijvinge...] [2008-12-21 10:55:25] [8d78428855b119373cac369316c08983]
- RM    [Variance Reduction Matrix] [VRM inschrijvinge...] [2008-12-21 11:14:53] [8d78428855b119373cac369316c08983]
- RMP       [(Partial) Autocorrelation Function] [(P)ACF inschrijvi...] [2008-12-21 11:27:19] [d6e9f26c3644bfc30f06303d9993b878] [Current]
Feedback Forum

Post a new message
Dataseries X:
11.514
31.514
27.071
29.462
26.105
22.397
23.843
21.705
18.089
20.764
25.316
17704
15548
28029
29383
36438
32034
22679
24319
18004
17537
20366
22782
19169
13807
29743
25591
29096
26482
22405
27044
17970
18730
19684
19785
18479
10698
31956
29506
34506
27165
26736
23691
18157
17328
18205
20995
17382
9367
31124
26551
30651
25859
25100
25778
20418
18688
20424
24776
19814
12738


Summary of computational transaction
Raw Inputview raw input (R code)
Raw Outputview raw output of R engine
Computing time1 seconds
R Server'George Udny Yule' @ 72.249.76.132

\begin{tabular}{lllllllll}
\hline
Summary of computational transaction \tabularnewline
Raw Input & view raw input (R code)  \tabularnewline
Raw Output & view raw output of R engine  \tabularnewline
Computing time & 1 seconds \tabularnewline
R Server & 'George Udny Yule' @ 72.249.76.132 \tabularnewline
\hline
\end{tabular}
%Source: https://freestatistics.org/blog/index.php?pk=35507&T=0

[TABLE]
[ROW][C]Summary of computational transaction[/C][/ROW]
[ROW][C]Raw Input[/C][C]view raw input (R code) [/C][/ROW]
[ROW][C]Raw Output[/C][C]view raw output of R engine [/C][/ROW]
[ROW][C]Computing time[/C][C]1 seconds[/C][/ROW]
[ROW][C]R Server[/C][C]'George Udny Yule' @ 72.249.76.132[/C][/ROW]
[/TABLE]
Source: https://freestatistics.org/blog/index.php?pk=35507&T=0

Globally Unique Identifier (entire table): ba.freestatistics.org/blog/index.php?pk=35507&T=0

As an alternative you can also use a QR Code:  

The GUIDs for individual cells are displayed in the table below:

Summary of computational transaction
Raw Inputview raw input (R code)
Raw Outputview raw output of R engine
Computing time1 seconds
R Server'George Udny Yule' @ 72.249.76.132


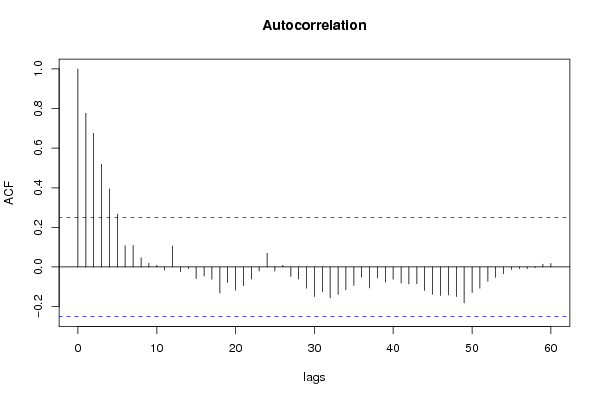
Autocorrelation Function
Time lag kACF(k)T-STATP-value
10.7757966.05920
20.6753215.27441e-06
30.5186274.05067.3e-05
40.3940493.07760.001562
50.2673872.08840.020473
60.107260.83770.202726
70.1088370.850.199312
80.0463320.36190.359352
90.0188780.14740.441634
100.0089070.06960.472384
11-0.015405-0.12030.452313
120.1064340.83130.204529
13-0.023561-0.1840.427304
14-0.00871-0.0680.472993
15-0.058695-0.45840.324139
16-0.046072-0.35980.360107
17-0.06204-0.48450.314866
18-0.131285-1.02540.154619
19-0.078495-0.61310.271055
20-0.117245-0.91570.181711
21-0.094356-0.73690.23199
22-0.061155-0.47760.317309
23-0.019885-0.15530.438546
240.0689650.53860.29605
25-0.020563-0.16060.436468
260.0080290.06270.4751
27-0.048018-0.3750.354469
28-0.060662-0.47380.318673
29-0.107402-0.83880.202419
30-0.149441-1.16720.123842
31-0.125367-0.97910.165687
32-0.155518-1.21460.114594
33-0.138627-1.08270.141599
34-0.115387-0.90120.185513
35-0.093045-0.72670.235094
36-0.051462-0.40190.344569
37-0.105813-0.82640.205893
38-0.055745-0.43540.33241
39-0.07616-0.59480.277079
40-0.061613-0.48120.316043
41-0.081468-0.63630.263485
42-0.085828-0.67030.252587
43-0.084479-0.65980.255931
44-0.119465-0.93310.177236
45-0.137898-1.0770.142857
46-0.144137-1.12570.132342
47-0.141103-1.10210.137384
48-0.149552-1.1680.123668
49-0.181412-1.41690.080803
50-0.129517-1.01160.157873
51-0.106976-0.83550.203345
52-0.072647-0.56740.286266
53-0.052092-0.40690.34277
54-0.033718-0.26330.396585
55-0.013378-0.10450.458563
56-0.008444-0.06590.473817
57-0.008482-0.06620.473699
58-0.003543-0.02770.489008
590.0139110.10860.456918
600.0171320.13380.446999

\begin{tabular}{lllllllll}
\hline
Autocorrelation Function \tabularnewline
Time lag k & ACF(k) & T-STAT & P-value \tabularnewline
1 & 0.775796 & 6.0592 & 0 \tabularnewline
2 & 0.675321 & 5.2744 & 1e-06 \tabularnewline
3 & 0.518627 & 4.0506 & 7.3e-05 \tabularnewline
4 & 0.394049 & 3.0776 & 0.001562 \tabularnewline
5 & 0.267387 & 2.0884 & 0.020473 \tabularnewline
6 & 0.10726 & 0.8377 & 0.202726 \tabularnewline
7 & 0.108837 & 0.85 & 0.199312 \tabularnewline
8 & 0.046332 & 0.3619 & 0.359352 \tabularnewline
9 & 0.018878 & 0.1474 & 0.441634 \tabularnewline
10 & 0.008907 & 0.0696 & 0.472384 \tabularnewline
11 & -0.015405 & -0.1203 & 0.452313 \tabularnewline
12 & 0.106434 & 0.8313 & 0.204529 \tabularnewline
13 & -0.023561 & -0.184 & 0.427304 \tabularnewline
14 & -0.00871 & -0.068 & 0.472993 \tabularnewline
15 & -0.058695 & -0.4584 & 0.324139 \tabularnewline
16 & -0.046072 & -0.3598 & 0.360107 \tabularnewline
17 & -0.06204 & -0.4845 & 0.314866 \tabularnewline
18 & -0.131285 & -1.0254 & 0.154619 \tabularnewline
19 & -0.078495 & -0.6131 & 0.271055 \tabularnewline
20 & -0.117245 & -0.9157 & 0.181711 \tabularnewline
21 & -0.094356 & -0.7369 & 0.23199 \tabularnewline
22 & -0.061155 & -0.4776 & 0.317309 \tabularnewline
23 & -0.019885 & -0.1553 & 0.438546 \tabularnewline
24 & 0.068965 & 0.5386 & 0.29605 \tabularnewline
25 & -0.020563 & -0.1606 & 0.436468 \tabularnewline
26 & 0.008029 & 0.0627 & 0.4751 \tabularnewline
27 & -0.048018 & -0.375 & 0.354469 \tabularnewline
28 & -0.060662 & -0.4738 & 0.318673 \tabularnewline
29 & -0.107402 & -0.8388 & 0.202419 \tabularnewline
30 & -0.149441 & -1.1672 & 0.123842 \tabularnewline
31 & -0.125367 & -0.9791 & 0.165687 \tabularnewline
32 & -0.155518 & -1.2146 & 0.114594 \tabularnewline
33 & -0.138627 & -1.0827 & 0.141599 \tabularnewline
34 & -0.115387 & -0.9012 & 0.185513 \tabularnewline
35 & -0.093045 & -0.7267 & 0.235094 \tabularnewline
36 & -0.051462 & -0.4019 & 0.344569 \tabularnewline
37 & -0.105813 & -0.8264 & 0.205893 \tabularnewline
38 & -0.055745 & -0.4354 & 0.33241 \tabularnewline
39 & -0.07616 & -0.5948 & 0.277079 \tabularnewline
40 & -0.061613 & -0.4812 & 0.316043 \tabularnewline
41 & -0.081468 & -0.6363 & 0.263485 \tabularnewline
42 & -0.085828 & -0.6703 & 0.252587 \tabularnewline
43 & -0.084479 & -0.6598 & 0.255931 \tabularnewline
44 & -0.119465 & -0.9331 & 0.177236 \tabularnewline
45 & -0.137898 & -1.077 & 0.142857 \tabularnewline
46 & -0.144137 & -1.1257 & 0.132342 \tabularnewline
47 & -0.141103 & -1.1021 & 0.137384 \tabularnewline
48 & -0.149552 & -1.168 & 0.123668 \tabularnewline
49 & -0.181412 & -1.4169 & 0.080803 \tabularnewline
50 & -0.129517 & -1.0116 & 0.157873 \tabularnewline
51 & -0.106976 & -0.8355 & 0.203345 \tabularnewline
52 & -0.072647 & -0.5674 & 0.286266 \tabularnewline
53 & -0.052092 & -0.4069 & 0.34277 \tabularnewline
54 & -0.033718 & -0.2633 & 0.396585 \tabularnewline
55 & -0.013378 & -0.1045 & 0.458563 \tabularnewline
56 & -0.008444 & -0.0659 & 0.473817 \tabularnewline
57 & -0.008482 & -0.0662 & 0.473699 \tabularnewline
58 & -0.003543 & -0.0277 & 0.489008 \tabularnewline
59 & 0.013911 & 0.1086 & 0.456918 \tabularnewline
60 & 0.017132 & 0.1338 & 0.446999 \tabularnewline
\hline
\end{tabular}
%Source: https://freestatistics.org/blog/index.php?pk=35507&T=1

[TABLE]
[ROW][C]Autocorrelation Function[/C][/ROW]
[ROW][C]Time lag k[/C][C]ACF(k)[/C][C]T-STAT[/C][C]P-value[/C][/ROW]
[ROW][C]1[/C][C]0.775796[/C][C]6.0592[/C][C]0[/C][/ROW]
[ROW][C]2[/C][C]0.675321[/C][C]5.2744[/C][C]1e-06[/C][/ROW]
[ROW][C]3[/C][C]0.518627[/C][C]4.0506[/C][C]7.3e-05[/C][/ROW]
[ROW][C]4[/C][C]0.394049[/C][C]3.0776[/C][C]0.001562[/C][/ROW]
[ROW][C]5[/C][C]0.267387[/C][C]2.0884[/C][C]0.020473[/C][/ROW]
[ROW][C]6[/C][C]0.10726[/C][C]0.8377[/C][C]0.202726[/C][/ROW]
[ROW][C]7[/C][C]0.108837[/C][C]0.85[/C][C]0.199312[/C][/ROW]
[ROW][C]8[/C][C]0.046332[/C][C]0.3619[/C][C]0.359352[/C][/ROW]
[ROW][C]9[/C][C]0.018878[/C][C]0.1474[/C][C]0.441634[/C][/ROW]
[ROW][C]10[/C][C]0.008907[/C][C]0.0696[/C][C]0.472384[/C][/ROW]
[ROW][C]11[/C][C]-0.015405[/C][C]-0.1203[/C][C]0.452313[/C][/ROW]
[ROW][C]12[/C][C]0.106434[/C][C]0.8313[/C][C]0.204529[/C][/ROW]
[ROW][C]13[/C][C]-0.023561[/C][C]-0.184[/C][C]0.427304[/C][/ROW]
[ROW][C]14[/C][C]-0.00871[/C][C]-0.068[/C][C]0.472993[/C][/ROW]
[ROW][C]15[/C][C]-0.058695[/C][C]-0.4584[/C][C]0.324139[/C][/ROW]
[ROW][C]16[/C][C]-0.046072[/C][C]-0.3598[/C][C]0.360107[/C][/ROW]
[ROW][C]17[/C][C]-0.06204[/C][C]-0.4845[/C][C]0.314866[/C][/ROW]
[ROW][C]18[/C][C]-0.131285[/C][C]-1.0254[/C][C]0.154619[/C][/ROW]
[ROW][C]19[/C][C]-0.078495[/C][C]-0.6131[/C][C]0.271055[/C][/ROW]
[ROW][C]20[/C][C]-0.117245[/C][C]-0.9157[/C][C]0.181711[/C][/ROW]
[ROW][C]21[/C][C]-0.094356[/C][C]-0.7369[/C][C]0.23199[/C][/ROW]
[ROW][C]22[/C][C]-0.061155[/C][C]-0.4776[/C][C]0.317309[/C][/ROW]
[ROW][C]23[/C][C]-0.019885[/C][C]-0.1553[/C][C]0.438546[/C][/ROW]
[ROW][C]24[/C][C]0.068965[/C][C]0.5386[/C][C]0.29605[/C][/ROW]
[ROW][C]25[/C][C]-0.020563[/C][C]-0.1606[/C][C]0.436468[/C][/ROW]
[ROW][C]26[/C][C]0.008029[/C][C]0.0627[/C][C]0.4751[/C][/ROW]
[ROW][C]27[/C][C]-0.048018[/C][C]-0.375[/C][C]0.354469[/C][/ROW]
[ROW][C]28[/C][C]-0.060662[/C][C]-0.4738[/C][C]0.318673[/C][/ROW]
[ROW][C]29[/C][C]-0.107402[/C][C]-0.8388[/C][C]0.202419[/C][/ROW]
[ROW][C]30[/C][C]-0.149441[/C][C]-1.1672[/C][C]0.123842[/C][/ROW]
[ROW][C]31[/C][C]-0.125367[/C][C]-0.9791[/C][C]0.165687[/C][/ROW]
[ROW][C]32[/C][C]-0.155518[/C][C]-1.2146[/C][C]0.114594[/C][/ROW]
[ROW][C]33[/C][C]-0.138627[/C][C]-1.0827[/C][C]0.141599[/C][/ROW]
[ROW][C]34[/C][C]-0.115387[/C][C]-0.9012[/C][C]0.185513[/C][/ROW]
[ROW][C]35[/C][C]-0.093045[/C][C]-0.7267[/C][C]0.235094[/C][/ROW]
[ROW][C]36[/C][C]-0.051462[/C][C]-0.4019[/C][C]0.344569[/C][/ROW]
[ROW][C]37[/C][C]-0.105813[/C][C]-0.8264[/C][C]0.205893[/C][/ROW]
[ROW][C]38[/C][C]-0.055745[/C][C]-0.4354[/C][C]0.33241[/C][/ROW]
[ROW][C]39[/C][C]-0.07616[/C][C]-0.5948[/C][C]0.277079[/C][/ROW]
[ROW][C]40[/C][C]-0.061613[/C][C]-0.4812[/C][C]0.316043[/C][/ROW]
[ROW][C]41[/C][C]-0.081468[/C][C]-0.6363[/C][C]0.263485[/C][/ROW]
[ROW][C]42[/C][C]-0.085828[/C][C]-0.6703[/C][C]0.252587[/C][/ROW]
[ROW][C]43[/C][C]-0.084479[/C][C]-0.6598[/C][C]0.255931[/C][/ROW]
[ROW][C]44[/C][C]-0.119465[/C][C]-0.9331[/C][C]0.177236[/C][/ROW]
[ROW][C]45[/C][C]-0.137898[/C][C]-1.077[/C][C]0.142857[/C][/ROW]
[ROW][C]46[/C][C]-0.144137[/C][C]-1.1257[/C][C]0.132342[/C][/ROW]
[ROW][C]47[/C][C]-0.141103[/C][C]-1.1021[/C][C]0.137384[/C][/ROW]
[ROW][C]48[/C][C]-0.149552[/C][C]-1.168[/C][C]0.123668[/C][/ROW]
[ROW][C]49[/C][C]-0.181412[/C][C]-1.4169[/C][C]0.080803[/C][/ROW]
[ROW][C]50[/C][C]-0.129517[/C][C]-1.0116[/C][C]0.157873[/C][/ROW]
[ROW][C]51[/C][C]-0.106976[/C][C]-0.8355[/C][C]0.203345[/C][/ROW]
[ROW][C]52[/C][C]-0.072647[/C][C]-0.5674[/C][C]0.286266[/C][/ROW]
[ROW][C]53[/C][C]-0.052092[/C][C]-0.4069[/C][C]0.34277[/C][/ROW]
[ROW][C]54[/C][C]-0.033718[/C][C]-0.2633[/C][C]0.396585[/C][/ROW]
[ROW][C]55[/C][C]-0.013378[/C][C]-0.1045[/C][C]0.458563[/C][/ROW]
[ROW][C]56[/C][C]-0.008444[/C][C]-0.0659[/C][C]0.473817[/C][/ROW]
[ROW][C]57[/C][C]-0.008482[/C][C]-0.0662[/C][C]0.473699[/C][/ROW]
[ROW][C]58[/C][C]-0.003543[/C][C]-0.0277[/C][C]0.489008[/C][/ROW]
[ROW][C]59[/C][C]0.013911[/C][C]0.1086[/C][C]0.456918[/C][/ROW]
[ROW][C]60[/C][C]0.017132[/C][C]0.1338[/C][C]0.446999[/C][/ROW]
[/TABLE]
Source: https://freestatistics.org/blog/index.php?pk=35507&T=1

Globally Unique Identifier (entire table): ba.freestatistics.org/blog/index.php?pk=35507&T=1

As an alternative you can also use a QR Code:  

The GUIDs for individual cells are displayed in the table below:

Autocorrelation Function
Time lag kACF(k)T-STATP-value
10.7757966.05920
20.6753215.27441e-06
30.5186274.05067.3e-05
40.3940493.07760.001562
50.2673872.08840.020473
60.107260.83770.202726
70.1088370.850.199312
80.0463320.36190.359352
90.0188780.14740.441634
100.0089070.06960.472384
11-0.015405-0.12030.452313
120.1064340.83130.204529
13-0.023561-0.1840.427304
14-0.00871-0.0680.472993
15-0.058695-0.45840.324139
16-0.046072-0.35980.360107
17-0.06204-0.48450.314866
18-0.131285-1.02540.154619
19-0.078495-0.61310.271055
20-0.117245-0.91570.181711
21-0.094356-0.73690.23199
22-0.061155-0.47760.317309
23-0.019885-0.15530.438546
240.0689650.53860.29605
25-0.020563-0.16060.436468
260.0080290.06270.4751
27-0.048018-0.3750.354469
28-0.060662-0.47380.318673
29-0.107402-0.83880.202419
30-0.149441-1.16720.123842
31-0.125367-0.97910.165687
32-0.155518-1.21460.114594
33-0.138627-1.08270.141599
34-0.115387-0.90120.185513
35-0.093045-0.72670.235094
36-0.051462-0.40190.344569
37-0.105813-0.82640.205893
38-0.055745-0.43540.33241
39-0.07616-0.59480.277079
40-0.061613-0.48120.316043
41-0.081468-0.63630.263485
42-0.085828-0.67030.252587
43-0.084479-0.65980.255931
44-0.119465-0.93310.177236
45-0.137898-1.0770.142857
46-0.144137-1.12570.132342
47-0.141103-1.10210.137384
48-0.149552-1.1680.123668
49-0.181412-1.41690.080803
50-0.129517-1.01160.157873
51-0.106976-0.83550.203345
52-0.072647-0.56740.286266
53-0.052092-0.40690.34277
54-0.033718-0.26330.396585
55-0.013378-0.10450.458563
56-0.008444-0.06590.473817
57-0.008482-0.06620.473699
58-0.003543-0.02770.489008
590.0139110.10860.456918
600.0171320.13380.446999


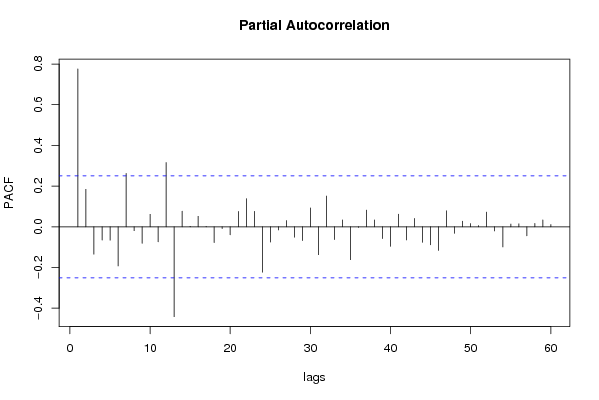
Partial Autocorrelation Function
Time lag kPACF(k)T-STATP-value
10.7757966.05920
20.184511.44110.077339
3-0.134587-1.05120.148667
4-0.065236-0.50950.306118
5-0.065626-0.51260.305055
6-0.191972-1.49930.069471
70.2626392.05130.022271
8-0.018928-0.14780.441481
9-0.080726-0.63050.265364
100.0615280.48050.316279
11-0.07358-0.57470.283812
120.3158242.46670.008231
13-0.441362-3.44710.000516
140.0769890.60130.274934
150.0025320.01980.492144
160.0519040.40540.343307
170.0022250.01740.493095
18-0.077549-0.60570.273488
19-0.00854-0.06670.473519
20-0.039481-0.30840.37943
210.0757860.59190.27805
220.1380731.07840.142554
230.0759930.59350.277512
24-0.223005-1.74170.043299
25-0.074873-0.58480.280428
26-0.014984-0.1170.453612
270.030570.23880.406046
28-0.05094-0.39790.346064
29-0.067274-0.52540.300596
300.0926160.72340.236112
31-0.137098-1.07080.144245
320.1512921.18160.120969
33-0.062617-0.48910.31328
340.0339430.26510.395911
35-0.161199-1.2590.106413
36-0.003279-0.02560.489827
370.0821350.64150.261803
380.033620.26260.396879
39-0.057531-0.44930.327393
40-0.095797-0.74820.228609
410.062170.48560.314508
42-0.064344-0.50250.308548
430.0411530.32140.374496
44-0.076013-0.59370.27746
45-0.088259-0.68930.246617
46-0.116066-0.90650.184118
470.0785140.61320.271006
48-0.032054-0.25030.40158
490.0275590.21520.415149
500.0161060.12580.450156
510.0065510.05120.479681
520.0722910.56460.287204
53-0.020265-0.15830.437383
54-0.099058-0.77370.221059
550.0138830.10840.457005
560.0146780.11460.454555
57-0.043968-0.34340.366239
580.0169540.13240.447545
590.0338960.26470.396054
600.0110020.08590.465902

\begin{tabular}{lllllllll}
\hline
Partial Autocorrelation Function \tabularnewline
Time lag k & PACF(k) & T-STAT & P-value \tabularnewline
1 & 0.775796 & 6.0592 & 0 \tabularnewline
2 & 0.18451 & 1.4411 & 0.077339 \tabularnewline
3 & -0.134587 & -1.0512 & 0.148667 \tabularnewline
4 & -0.065236 & -0.5095 & 0.306118 \tabularnewline
5 & -0.065626 & -0.5126 & 0.305055 \tabularnewline
6 & -0.191972 & -1.4993 & 0.069471 \tabularnewline
7 & 0.262639 & 2.0513 & 0.022271 \tabularnewline
8 & -0.018928 & -0.1478 & 0.441481 \tabularnewline
9 & -0.080726 & -0.6305 & 0.265364 \tabularnewline
10 & 0.061528 & 0.4805 & 0.316279 \tabularnewline
11 & -0.07358 & -0.5747 & 0.283812 \tabularnewline
12 & 0.315824 & 2.4667 & 0.008231 \tabularnewline
13 & -0.441362 & -3.4471 & 0.000516 \tabularnewline
14 & 0.076989 & 0.6013 & 0.274934 \tabularnewline
15 & 0.002532 & 0.0198 & 0.492144 \tabularnewline
16 & 0.051904 & 0.4054 & 0.343307 \tabularnewline
17 & 0.002225 & 0.0174 & 0.493095 \tabularnewline
18 & -0.077549 & -0.6057 & 0.273488 \tabularnewline
19 & -0.00854 & -0.0667 & 0.473519 \tabularnewline
20 & -0.039481 & -0.3084 & 0.37943 \tabularnewline
21 & 0.075786 & 0.5919 & 0.27805 \tabularnewline
22 & 0.138073 & 1.0784 & 0.142554 \tabularnewline
23 & 0.075993 & 0.5935 & 0.277512 \tabularnewline
24 & -0.223005 & -1.7417 & 0.043299 \tabularnewline
25 & -0.074873 & -0.5848 & 0.280428 \tabularnewline
26 & -0.014984 & -0.117 & 0.453612 \tabularnewline
27 & 0.03057 & 0.2388 & 0.406046 \tabularnewline
28 & -0.05094 & -0.3979 & 0.346064 \tabularnewline
29 & -0.067274 & -0.5254 & 0.300596 \tabularnewline
30 & 0.092616 & 0.7234 & 0.236112 \tabularnewline
31 & -0.137098 & -1.0708 & 0.144245 \tabularnewline
32 & 0.151292 & 1.1816 & 0.120969 \tabularnewline
33 & -0.062617 & -0.4891 & 0.31328 \tabularnewline
34 & 0.033943 & 0.2651 & 0.395911 \tabularnewline
35 & -0.161199 & -1.259 & 0.106413 \tabularnewline
36 & -0.003279 & -0.0256 & 0.489827 \tabularnewline
37 & 0.082135 & 0.6415 & 0.261803 \tabularnewline
38 & 0.03362 & 0.2626 & 0.396879 \tabularnewline
39 & -0.057531 & -0.4493 & 0.327393 \tabularnewline
40 & -0.095797 & -0.7482 & 0.228609 \tabularnewline
41 & 0.06217 & 0.4856 & 0.314508 \tabularnewline
42 & -0.064344 & -0.5025 & 0.308548 \tabularnewline
43 & 0.041153 & 0.3214 & 0.374496 \tabularnewline
44 & -0.076013 & -0.5937 & 0.27746 \tabularnewline
45 & -0.088259 & -0.6893 & 0.246617 \tabularnewline
46 & -0.116066 & -0.9065 & 0.184118 \tabularnewline
47 & 0.078514 & 0.6132 & 0.271006 \tabularnewline
48 & -0.032054 & -0.2503 & 0.40158 \tabularnewline
49 & 0.027559 & 0.2152 & 0.415149 \tabularnewline
50 & 0.016106 & 0.1258 & 0.450156 \tabularnewline
51 & 0.006551 & 0.0512 & 0.479681 \tabularnewline
52 & 0.072291 & 0.5646 & 0.287204 \tabularnewline
53 & -0.020265 & -0.1583 & 0.437383 \tabularnewline
54 & -0.099058 & -0.7737 & 0.221059 \tabularnewline
55 & 0.013883 & 0.1084 & 0.457005 \tabularnewline
56 & 0.014678 & 0.1146 & 0.454555 \tabularnewline
57 & -0.043968 & -0.3434 & 0.366239 \tabularnewline
58 & 0.016954 & 0.1324 & 0.447545 \tabularnewline
59 & 0.033896 & 0.2647 & 0.396054 \tabularnewline
60 & 0.011002 & 0.0859 & 0.465902 \tabularnewline
\hline
\end{tabular}
%Source: https://freestatistics.org/blog/index.php?pk=35507&T=2

[TABLE]
[ROW][C]Partial Autocorrelation Function[/C][/ROW]
[ROW][C]Time lag k[/C][C]PACF(k)[/C][C]T-STAT[/C][C]P-value[/C][/ROW]
[ROW][C]1[/C][C]0.775796[/C][C]6.0592[/C][C]0[/C][/ROW]
[ROW][C]2[/C][C]0.18451[/C][C]1.4411[/C][C]0.077339[/C][/ROW]
[ROW][C]3[/C][C]-0.134587[/C][C]-1.0512[/C][C]0.148667[/C][/ROW]
[ROW][C]4[/C][C]-0.065236[/C][C]-0.5095[/C][C]0.306118[/C][/ROW]
[ROW][C]5[/C][C]-0.065626[/C][C]-0.5126[/C][C]0.305055[/C][/ROW]
[ROW][C]6[/C][C]-0.191972[/C][C]-1.4993[/C][C]0.069471[/C][/ROW]
[ROW][C]7[/C][C]0.262639[/C][C]2.0513[/C][C]0.022271[/C][/ROW]
[ROW][C]8[/C][C]-0.018928[/C][C]-0.1478[/C][C]0.441481[/C][/ROW]
[ROW][C]9[/C][C]-0.080726[/C][C]-0.6305[/C][C]0.265364[/C][/ROW]
[ROW][C]10[/C][C]0.061528[/C][C]0.4805[/C][C]0.316279[/C][/ROW]
[ROW][C]11[/C][C]-0.07358[/C][C]-0.5747[/C][C]0.283812[/C][/ROW]
[ROW][C]12[/C][C]0.315824[/C][C]2.4667[/C][C]0.008231[/C][/ROW]
[ROW][C]13[/C][C]-0.441362[/C][C]-3.4471[/C][C]0.000516[/C][/ROW]
[ROW][C]14[/C][C]0.076989[/C][C]0.6013[/C][C]0.274934[/C][/ROW]
[ROW][C]15[/C][C]0.002532[/C][C]0.0198[/C][C]0.492144[/C][/ROW]
[ROW][C]16[/C][C]0.051904[/C][C]0.4054[/C][C]0.343307[/C][/ROW]
[ROW][C]17[/C][C]0.002225[/C][C]0.0174[/C][C]0.493095[/C][/ROW]
[ROW][C]18[/C][C]-0.077549[/C][C]-0.6057[/C][C]0.273488[/C][/ROW]
[ROW][C]19[/C][C]-0.00854[/C][C]-0.0667[/C][C]0.473519[/C][/ROW]
[ROW][C]20[/C][C]-0.039481[/C][C]-0.3084[/C][C]0.37943[/C][/ROW]
[ROW][C]21[/C][C]0.075786[/C][C]0.5919[/C][C]0.27805[/C][/ROW]
[ROW][C]22[/C][C]0.138073[/C][C]1.0784[/C][C]0.142554[/C][/ROW]
[ROW][C]23[/C][C]0.075993[/C][C]0.5935[/C][C]0.277512[/C][/ROW]
[ROW][C]24[/C][C]-0.223005[/C][C]-1.7417[/C][C]0.043299[/C][/ROW]
[ROW][C]25[/C][C]-0.074873[/C][C]-0.5848[/C][C]0.280428[/C][/ROW]
[ROW][C]26[/C][C]-0.014984[/C][C]-0.117[/C][C]0.453612[/C][/ROW]
[ROW][C]27[/C][C]0.03057[/C][C]0.2388[/C][C]0.406046[/C][/ROW]
[ROW][C]28[/C][C]-0.05094[/C][C]-0.3979[/C][C]0.346064[/C][/ROW]
[ROW][C]29[/C][C]-0.067274[/C][C]-0.5254[/C][C]0.300596[/C][/ROW]
[ROW][C]30[/C][C]0.092616[/C][C]0.7234[/C][C]0.236112[/C][/ROW]
[ROW][C]31[/C][C]-0.137098[/C][C]-1.0708[/C][C]0.144245[/C][/ROW]
[ROW][C]32[/C][C]0.151292[/C][C]1.1816[/C][C]0.120969[/C][/ROW]
[ROW][C]33[/C][C]-0.062617[/C][C]-0.4891[/C][C]0.31328[/C][/ROW]
[ROW][C]34[/C][C]0.033943[/C][C]0.2651[/C][C]0.395911[/C][/ROW]
[ROW][C]35[/C][C]-0.161199[/C][C]-1.259[/C][C]0.106413[/C][/ROW]
[ROW][C]36[/C][C]-0.003279[/C][C]-0.0256[/C][C]0.489827[/C][/ROW]
[ROW][C]37[/C][C]0.082135[/C][C]0.6415[/C][C]0.261803[/C][/ROW]
[ROW][C]38[/C][C]0.03362[/C][C]0.2626[/C][C]0.396879[/C][/ROW]
[ROW][C]39[/C][C]-0.057531[/C][C]-0.4493[/C][C]0.327393[/C][/ROW]
[ROW][C]40[/C][C]-0.095797[/C][C]-0.7482[/C][C]0.228609[/C][/ROW]
[ROW][C]41[/C][C]0.06217[/C][C]0.4856[/C][C]0.314508[/C][/ROW]
[ROW][C]42[/C][C]-0.064344[/C][C]-0.5025[/C][C]0.308548[/C][/ROW]
[ROW][C]43[/C][C]0.041153[/C][C]0.3214[/C][C]0.374496[/C][/ROW]
[ROW][C]44[/C][C]-0.076013[/C][C]-0.5937[/C][C]0.27746[/C][/ROW]
[ROW][C]45[/C][C]-0.088259[/C][C]-0.6893[/C][C]0.246617[/C][/ROW]
[ROW][C]46[/C][C]-0.116066[/C][C]-0.9065[/C][C]0.184118[/C][/ROW]
[ROW][C]47[/C][C]0.078514[/C][C]0.6132[/C][C]0.271006[/C][/ROW]
[ROW][C]48[/C][C]-0.032054[/C][C]-0.2503[/C][C]0.40158[/C][/ROW]
[ROW][C]49[/C][C]0.027559[/C][C]0.2152[/C][C]0.415149[/C][/ROW]
[ROW][C]50[/C][C]0.016106[/C][C]0.1258[/C][C]0.450156[/C][/ROW]
[ROW][C]51[/C][C]0.006551[/C][C]0.0512[/C][C]0.479681[/C][/ROW]
[ROW][C]52[/C][C]0.072291[/C][C]0.5646[/C][C]0.287204[/C][/ROW]
[ROW][C]53[/C][C]-0.020265[/C][C]-0.1583[/C][C]0.437383[/C][/ROW]
[ROW][C]54[/C][C]-0.099058[/C][C]-0.7737[/C][C]0.221059[/C][/ROW]
[ROW][C]55[/C][C]0.013883[/C][C]0.1084[/C][C]0.457005[/C][/ROW]
[ROW][C]56[/C][C]0.014678[/C][C]0.1146[/C][C]0.454555[/C][/ROW]
[ROW][C]57[/C][C]-0.043968[/C][C]-0.3434[/C][C]0.366239[/C][/ROW]
[ROW][C]58[/C][C]0.016954[/C][C]0.1324[/C][C]0.447545[/C][/ROW]
[ROW][C]59[/C][C]0.033896[/C][C]0.2647[/C][C]0.396054[/C][/ROW]
[ROW][C]60[/C][C]0.011002[/C][C]0.0859[/C][C]0.465902[/C][/ROW]
[/TABLE]
Source: https://freestatistics.org/blog/index.php?pk=35507&T=2

Globally Unique Identifier (entire table): ba.freestatistics.org/blog/index.php?pk=35507&T=2

As an alternative you can also use a QR Code:  

The GUIDs for individual cells are displayed in the table below:

Partial Autocorrelation Function
Time lag kPACF(k)T-STATP-value
10.7757966.05920
20.184511.44110.077339
3-0.134587-1.05120.148667
4-0.065236-0.50950.306118
5-0.065626-0.51260.305055
6-0.191972-1.49930.069471
70.2626392.05130.022271
8-0.018928-0.14780.441481
9-0.080726-0.63050.265364
100.0615280.48050.316279
11-0.07358-0.57470.283812
120.3158242.46670.008231
13-0.441362-3.44710.000516
140.0769890.60130.274934
150.0025320.01980.492144
160.0519040.40540.343307
170.0022250.01740.493095
18-0.077549-0.60570.273488
19-0.00854-0.06670.473519
20-0.039481-0.30840.37943
210.0757860.59190.27805
220.1380731.07840.142554
230.0759930.59350.277512
24-0.223005-1.74170.043299
25-0.074873-0.58480.280428
26-0.014984-0.1170.453612
270.030570.23880.406046
28-0.05094-0.39790.346064
29-0.067274-0.52540.300596
300.0926160.72340.236112
31-0.137098-1.07080.144245
320.1512921.18160.120969
33-0.062617-0.48910.31328
340.0339430.26510.395911
35-0.161199-1.2590.106413
36-0.003279-0.02560.489827
370.0821350.64150.261803
380.033620.26260.396879
39-0.057531-0.44930.327393
40-0.095797-0.74820.228609
410.062170.48560.314508
42-0.064344-0.50250.308548
430.0411530.32140.374496
44-0.076013-0.59370.27746
45-0.088259-0.68930.246617
46-0.116066-0.90650.184118
470.0785140.61320.271006
48-0.032054-0.25030.40158
490.0275590.21520.415149
500.0161060.12580.450156
510.0065510.05120.479681
520.0722910.56460.287204
53-0.020265-0.15830.437383
54-0.099058-0.77370.221059
550.0138830.10840.457005
560.0146780.11460.454555
57-0.043968-0.34340.366239
580.0169540.13240.447545
590.0338960.26470.396054
600.0110020.08590.465902


Parameters (Session):
par1 = 60 ; par2 = 1 ; par3 = 0 ; par4 = 0 ; par5 = 12 ;
Parameters (R input):
par1 = 60 ; par2 = 1 ; par3 = 0 ; par4 = 0 ; par5 = 12 ;
R code (references can be found in the software module):
if (par1 == 'Default') {
par1 = 10*log10(length(x))
} else {
par1 <- as.numeric(par1)
}
par2 <- as.numeric(par2)
par3 <- as.numeric(par3)
par4 <- as.numeric(par4)
par5 <- as.numeric(par5)
if (par2 == 0) {
x <- log(x)
} else {
x <- (x ^ par2 - 1) / par2
}
if (par3 > 0) x <- diff(x,lag=1,difference=par3)
if (par4 > 0) x <- diff(x,lag=par5,difference=par4)
bitmap(file='pic1.png')
racf <- acf(x,par1,main='Autocorrelation',xlab='lags',ylab='ACF')
dev.off()
bitmap(file='pic2.png')
rpacf <- pacf(x,par1,main='Partial Autocorrelation',xlab='lags',ylab='PACF')
dev.off()
(myacf <- c(racf$acf))
(mypacf <- c(rpacf$acf))
lengthx <- length(x)
sqrtn <- sqrt(lengthx)
load(file='createtable')
a<-table.start()
a<-table.row.start(a)
a<-table.element(a,'Autocorrelation Function',4,TRUE)
a<-table.row.end(a)
a<-table.row.start(a)
a<-table.element(a,'Time lag k',header=TRUE)
a<-table.element(a,hyperlink('basics.htm','ACF(k)','click here for more information about the Autocorrelation Function'),header=TRUE)
a<-table.element(a,'T-STAT',header=TRUE)
a<-table.element(a,'P-value',header=TRUE)
a<-table.row.end(a)
for (i in 2:(par1+1)) {
a<-table.row.start(a)
a<-table.element(a,i-1,header=TRUE)
a<-table.element(a,round(myacf[i],6))
mytstat <- myacf[i]*sqrtn
a<-table.element(a,round(mytstat,4))
a<-table.element(a,round(1-pt(abs(mytstat),lengthx),6))
a<-table.row.end(a)
}
a<-table.end(a)
table.save(a,file='mytable.tab')
a<-table.start()
a<-table.row.start(a)
a<-table.element(a,'Partial Autocorrelation Function',4,TRUE)
a<-table.row.end(a)
a<-table.row.start(a)
a<-table.element(a,'Time lag k',header=TRUE)
a<-table.element(a,hyperlink('basics.htm','PACF(k)','click here for more information about the Partial Autocorrelation Function'),header=TRUE)
a<-table.element(a,'T-STAT',header=TRUE)
a<-table.element(a,'P-value',header=TRUE)
a<-table.row.end(a)
for (i in 1:par1) {
a<-table.row.start(a)
a<-table.element(a,i,header=TRUE)
a<-table.element(a,round(mypacf[i],6))
mytstat <- mypacf[i]*sqrtn
a<-table.element(a,round(mytstat,4))
a<-table.element(a,round(1-pt(abs(mytstat),lengthx),6))
a<-table.row.end(a)
}
a<-table.end(a)
table.save(a,file='mytable1.tab')