Free Statistics
of Irreproducible Research!
Description of Statistical Computation | |||||||||||||||||||||
|---|---|---|---|---|---|---|---|---|---|---|---|---|---|---|---|---|---|---|---|---|---|
| Author's title | |||||||||||||||||||||
| Author | *Unverified author* | ||||||||||||||||||||
| R Software Module | rwasp_backtobackhist.wasp | ||||||||||||||||||||
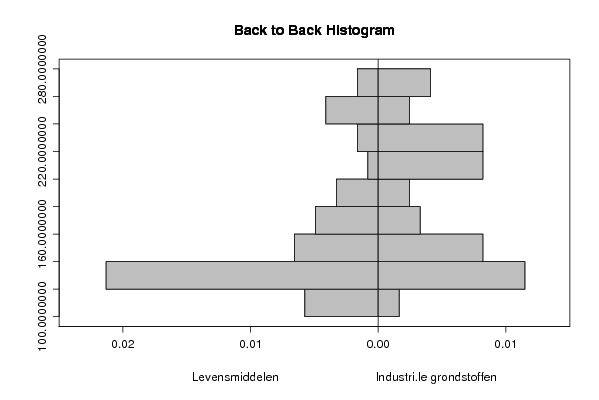
| Title produced by software | Back to Back Histogram | ||||||||||||||||||||
| Date of computation | Sun, 21 Dec 2008 04:24:28 -0700 | ||||||||||||||||||||
| Cite this page as follows | Statistical Computations at FreeStatistics.org, Office for Research Development and Education, URL https://freestatistics.org/blog/index.php?v=date/2008/Dec/21/t12298586974pkbi08qiieai5o.htm/, Retrieved Sun, 19 May 2024 09:20:47 +0000 | ||||||||||||||||||||
| Statistical Computations at FreeStatistics.org, Office for Research Development and Education, URL https://freestatistics.org/blog/index.php?pk=35504, Retrieved Sun, 19 May 2024 09:20:47 +0000 | |||||||||||||||||||||
| QR Codes: | |||||||||||||||||||||
|
| |||||||||||||||||||||
| Original text written by user: | |||||||||||||||||||||
| IsPrivate? | No (this computation is public) | ||||||||||||||||||||
| User-defined keywords | |||||||||||||||||||||
| Estimated Impact | 149 | ||||||||||||||||||||
Tree of Dependent Computations | |||||||||||||||||||||
| Family? (F = Feedback message, R = changed R code, M = changed R Module, P = changed Parameters, D = changed Data) | |||||||||||||||||||||
| - [Back to Back Histogram] [Back-to-Back hist...] [2008-12-21 11:24:28] [d41d8cd98f00b204e9800998ecf8427e] [Current] | |||||||||||||||||||||
| Feedback Forum | |||||||||||||||||||||
Post a new message | |||||||||||||||||||||
Dataset | |||||||||||||||||||||
| Dataseries X: | |||||||||||||||||||||
178.2 187.2 229.9 243 267.2 270.3 251.2 251.9 256.7 251.3 227.1 211.9 195.8 190.8 185.9 169.9 169.9 168.7 159.5 156 160.7 161.6 156.6 155.4 151.8 141.2 133.6 133.9 138.4 134.7 138.4 136 135 137.3 135.2 127.4 122.1 122 120.8 124.9 131 132.5 129.3 128.1 132.9 120.1 115.5 116.6 112.3 108.5 111.5 113.6 125 134.7 139.4 142.9 141.7 131.7 128.8 121.4 118.4 | |||||||||||||||||||||
| Dataseries Y: | |||||||||||||||||||||
171,4 192 231,2 250,8 268,4 266,9 268,5 268,2 265,3 253,8 243,4 213,6 221 227,3 221,6 222,1 232,2 229,6 238,9 238,2 223,9 215 211,1 210,6 206,6 207 201,7 204,5 204,5 195,1 205,5 187,5 173,5 172,3 167,5 157,5 151,1 148,5 147,9 145,6 139,8 138,9 141,4 148,7 150,9 147,3 144,5 134 135,1 131,4 128,4 127,6 127,4 124 123,5 128 129,9 127,6 121,8 114,1 111,4 | |||||||||||||||||||||
Tables (Output of Computation) | |||||||||||||||||||||
| |||||||||||||||||||||
Figures (Output of Computation) | |||||||||||||||||||||
Input Parameters & R Code | |||||||||||||||||||||
| Parameters (Session): | |||||||||||||||||||||
| par1 = grey ; par2 = grey ; par3 = TRUE ; par4 = Levensmiddelen ; par5 = Industri�le grondstoffen ; | |||||||||||||||||||||
| Parameters (R input): | |||||||||||||||||||||
| par1 = grey ; par2 = grey ; par3 = TRUE ; par4 = Levensmiddelen ; par5 = Industri�le grondstoffen ; | |||||||||||||||||||||
| R code (references can be found in the software module): | |||||||||||||||||||||
if (par3 == 'TRUE') par3 <- TRUE | |||||||||||||||||||||