Free Statistics

of Irreproducible Research!

Author's title

Author*Unverified author*
R Software Modulerwasp_autocorrelation.wasp
Title produced by software(Partial) Autocorrelation Function
Date of computationSun, 21 Dec 2008 04:01:16 -0700
Cite this page as followsStatistical Computations at FreeStatistics.org, Office for Research Development and Education, URL https://freestatistics.org/blog/index.php?v=date/2008/Dec/21/t1229857498py8rb1p5v2mh6rx.htm/, Retrieved Sun, 19 May 2024 11:31:09 +0000
Statistical Computations at FreeStatistics.org, Office for Research Development and Education, URL https://freestatistics.org/blog/index.php?pk=35491, Retrieved Sun, 19 May 2024 11:31:09 +0000
QR Codes:

Original text written by user:
IsPrivate?No (this computation is public)
User-defined keywords
Estimated Impact204
Family? (F = Feedback message, R = changed R code, M = changed R Module, P = changed Parameters, D = changed Data)
-     [Standard Deviation-Mean Plot] [] [2008-12-21 10:26:45] [339926f84f7378398edd9a77d1fc8e74]
- RMPD    [(Partial) Autocorrelation Function] [] [2008-12-21 11:01:16] [76e580e81b2082744334eb1f6d9ccc3e] [Current]
Feedback Forum

Post a new message
Dataseries X:
93.9
97.5
98.1
89.6
98.4
102
99.2
101.8
108.3
106.7
108.2
94.2
95.1
98.1
93.2
94
97.2
95
90.5
91.6
90.5
79.9
74.9
74.3
75.9
77.7
86.9
90.7
91
89.5
92.5
94.1
98.5
96.8
91.2
97.1
104.9
110.9
104.8
94.1
95.8
99.3
101.1
104
99
105.4
107.1
110.7
117.1
118.7
126.5
127.5
134.6
131.8
135.9
142.7
141.7
153.4
145
137.7
148.3
152.2
169.4
168.6
161.1
174.1
179
190.6
190
181.6
174.8
180.5
196.8
193.8
197
216.3
221.4
217.9
229.7
227.4
204.2
196.6
198.8
207.5
190.7


Summary of computational transaction
Raw Inputview raw input (R code)
Raw Outputview raw output of R engine
Computing time2 seconds
R Server'Herman Ole Andreas Wold' @ 193.190.124.10:1001

\begin{tabular}{lllllllll}
\hline
Summary of computational transaction \tabularnewline
Raw Input & view raw input (R code)  \tabularnewline
Raw Output & view raw output of R engine  \tabularnewline
Computing time & 2 seconds \tabularnewline
R Server & 'Herman Ole Andreas Wold' @ 193.190.124.10:1001 \tabularnewline
\hline
\end{tabular}
%Source: https://freestatistics.org/blog/index.php?pk=35491&T=0

[TABLE]
[ROW][C]Summary of computational transaction[/C][/ROW]
[ROW][C]Raw Input[/C][C]view raw input (R code) [/C][/ROW]
[ROW][C]Raw Output[/C][C]view raw output of R engine [/C][/ROW]
[ROW][C]Computing time[/C][C]2 seconds[/C][/ROW]
[ROW][C]R Server[/C][C]'Herman Ole Andreas Wold' @ 193.190.124.10:1001[/C][/ROW]
[/TABLE]
Source: https://freestatistics.org/blog/index.php?pk=35491&T=0

Globally Unique Identifier (entire table): ba.freestatistics.org/blog/index.php?pk=35491&T=0

As an alternative you can also use a QR Code:  

The GUIDs for individual cells are displayed in the table below:

Summary of computational transaction
Raw Inputview raw input (R code)
Raw Outputview raw output of R engine
Computing time2 seconds
R Server'Herman Ole Andreas Wold' @ 193.190.124.10:1001


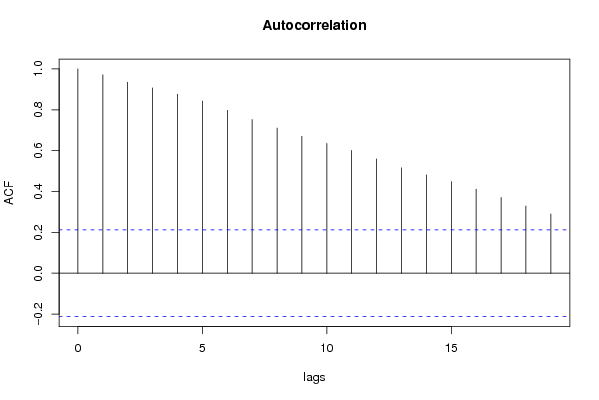
Autocorrelation Function
Time lag kACF(k)T-STATP-value
10.9713888.95580
20.9352548.62260
30.907228.36420
40.8764178.08020
50.8426467.76880
60.797557.3530
70.7521936.93490
80.710396.54950
90.6704986.18170
100.6354825.85890
110.6011395.54220
120.5595245.15861e-06
130.5161164.75844e-06
140.4813684.4381.4e-05
150.4488734.13844.1e-05
160.411573.79450.000138
170.3709113.41960.000483
180.3287443.03090.001616
190.2900172.67380.004496

\begin{tabular}{lllllllll}
\hline
Autocorrelation Function \tabularnewline
Time lag k & ACF(k) & T-STAT & P-value \tabularnewline
1 & 0.971388 & 8.9558 & 0 \tabularnewline
2 & 0.935254 & 8.6226 & 0 \tabularnewline
3 & 0.90722 & 8.3642 & 0 \tabularnewline
4 & 0.876417 & 8.0802 & 0 \tabularnewline
5 & 0.842646 & 7.7688 & 0 \tabularnewline
6 & 0.79755 & 7.353 & 0 \tabularnewline
7 & 0.752193 & 6.9349 & 0 \tabularnewline
8 & 0.71039 & 6.5495 & 0 \tabularnewline
9 & 0.670498 & 6.1817 & 0 \tabularnewline
10 & 0.635482 & 5.8589 & 0 \tabularnewline
11 & 0.601139 & 5.5422 & 0 \tabularnewline
12 & 0.559524 & 5.1586 & 1e-06 \tabularnewline
13 & 0.516116 & 4.7584 & 4e-06 \tabularnewline
14 & 0.481368 & 4.438 & 1.4e-05 \tabularnewline
15 & 0.448873 & 4.1384 & 4.1e-05 \tabularnewline
16 & 0.41157 & 3.7945 & 0.000138 \tabularnewline
17 & 0.370911 & 3.4196 & 0.000483 \tabularnewline
18 & 0.328744 & 3.0309 & 0.001616 \tabularnewline
19 & 0.290017 & 2.6738 & 0.004496 \tabularnewline
\hline
\end{tabular}
%Source: https://freestatistics.org/blog/index.php?pk=35491&T=1

[TABLE]
[ROW][C]Autocorrelation Function[/C][/ROW]
[ROW][C]Time lag k[/C][C]ACF(k)[/C][C]T-STAT[/C][C]P-value[/C][/ROW]
[ROW][C]1[/C][C]0.971388[/C][C]8.9558[/C][C]0[/C][/ROW]
[ROW][C]2[/C][C]0.935254[/C][C]8.6226[/C][C]0[/C][/ROW]
[ROW][C]3[/C][C]0.90722[/C][C]8.3642[/C][C]0[/C][/ROW]
[ROW][C]4[/C][C]0.876417[/C][C]8.0802[/C][C]0[/C][/ROW]
[ROW][C]5[/C][C]0.842646[/C][C]7.7688[/C][C]0[/C][/ROW]
[ROW][C]6[/C][C]0.79755[/C][C]7.353[/C][C]0[/C][/ROW]
[ROW][C]7[/C][C]0.752193[/C][C]6.9349[/C][C]0[/C][/ROW]
[ROW][C]8[/C][C]0.71039[/C][C]6.5495[/C][C]0[/C][/ROW]
[ROW][C]9[/C][C]0.670498[/C][C]6.1817[/C][C]0[/C][/ROW]
[ROW][C]10[/C][C]0.635482[/C][C]5.8589[/C][C]0[/C][/ROW]
[ROW][C]11[/C][C]0.601139[/C][C]5.5422[/C][C]0[/C][/ROW]
[ROW][C]12[/C][C]0.559524[/C][C]5.1586[/C][C]1e-06[/C][/ROW]
[ROW][C]13[/C][C]0.516116[/C][C]4.7584[/C][C]4e-06[/C][/ROW]
[ROW][C]14[/C][C]0.481368[/C][C]4.438[/C][C]1.4e-05[/C][/ROW]
[ROW][C]15[/C][C]0.448873[/C][C]4.1384[/C][C]4.1e-05[/C][/ROW]
[ROW][C]16[/C][C]0.41157[/C][C]3.7945[/C][C]0.000138[/C][/ROW]
[ROW][C]17[/C][C]0.370911[/C][C]3.4196[/C][C]0.000483[/C][/ROW]
[ROW][C]18[/C][C]0.328744[/C][C]3.0309[/C][C]0.001616[/C][/ROW]
[ROW][C]19[/C][C]0.290017[/C][C]2.6738[/C][C]0.004496[/C][/ROW]
[/TABLE]
Source: https://freestatistics.org/blog/index.php?pk=35491&T=1

Globally Unique Identifier (entire table): ba.freestatistics.org/blog/index.php?pk=35491&T=1

As an alternative you can also use a QR Code:  

The GUIDs for individual cells are displayed in the table below:

Autocorrelation Function
Time lag kACF(k)T-STATP-value
10.9713888.95580
20.9352548.62260
30.907228.36420
40.8764178.08020
50.8426467.76880
60.797557.3530
70.7521936.93490
80.710396.54950
90.6704986.18170
100.6354825.85890
110.6011395.54220
120.5595245.15861e-06
130.5161164.75844e-06
140.4813684.4381.4e-05
150.4488734.13844.1e-05
160.411573.79450.000138
170.3709113.41960.000483
180.3287443.03090.001616
190.2900172.67380.004496


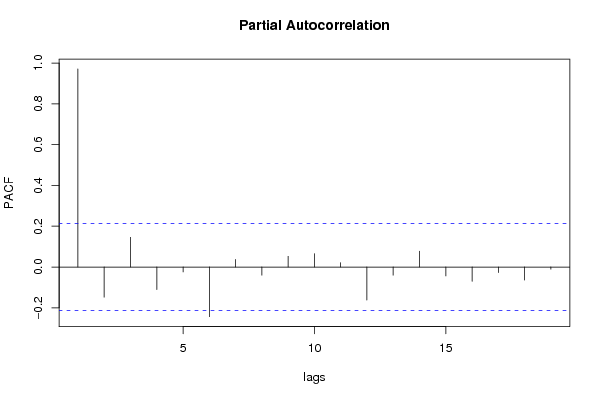
Partial Autocorrelation Function
Time lag kPACF(k)T-STATP-value
10.9713888.95580
2-0.147865-1.36330.088202
30.1454431.34090.09176
4-0.110771-1.02130.155016
5-0.02409-0.22210.412383
6-0.243516-2.24510.013679
70.0372590.34350.366032
8-0.040151-0.37020.356086
90.0521420.48070.315975
100.0649810.59910.27535
110.0208520.19220.424005
12-0.162452-1.49770.068953
13-0.040294-0.37150.355597
140.077710.71640.237839
15-0.043719-0.40310.343954
16-0.070197-0.64720.259628
17-0.027029-0.24920.401906
18-0.063836-0.58850.278865
19-0.010557-0.09730.461345

\begin{tabular}{lllllllll}
\hline
Partial Autocorrelation Function \tabularnewline
Time lag k & PACF(k) & T-STAT & P-value \tabularnewline
1 & 0.971388 & 8.9558 & 0 \tabularnewline
2 & -0.147865 & -1.3633 & 0.088202 \tabularnewline
3 & 0.145443 & 1.3409 & 0.09176 \tabularnewline
4 & -0.110771 & -1.0213 & 0.155016 \tabularnewline
5 & -0.02409 & -0.2221 & 0.412383 \tabularnewline
6 & -0.243516 & -2.2451 & 0.013679 \tabularnewline
7 & 0.037259 & 0.3435 & 0.366032 \tabularnewline
8 & -0.040151 & -0.3702 & 0.356086 \tabularnewline
9 & 0.052142 & 0.4807 & 0.315975 \tabularnewline
10 & 0.064981 & 0.5991 & 0.27535 \tabularnewline
11 & 0.020852 & 0.1922 & 0.424005 \tabularnewline
12 & -0.162452 & -1.4977 & 0.068953 \tabularnewline
13 & -0.040294 & -0.3715 & 0.355597 \tabularnewline
14 & 0.07771 & 0.7164 & 0.237839 \tabularnewline
15 & -0.043719 & -0.4031 & 0.343954 \tabularnewline
16 & -0.070197 & -0.6472 & 0.259628 \tabularnewline
17 & -0.027029 & -0.2492 & 0.401906 \tabularnewline
18 & -0.063836 & -0.5885 & 0.278865 \tabularnewline
19 & -0.010557 & -0.0973 & 0.461345 \tabularnewline
\hline
\end{tabular}
%Source: https://freestatistics.org/blog/index.php?pk=35491&T=2

[TABLE]
[ROW][C]Partial Autocorrelation Function[/C][/ROW]
[ROW][C]Time lag k[/C][C]PACF(k)[/C][C]T-STAT[/C][C]P-value[/C][/ROW]
[ROW][C]1[/C][C]0.971388[/C][C]8.9558[/C][C]0[/C][/ROW]
[ROW][C]2[/C][C]-0.147865[/C][C]-1.3633[/C][C]0.088202[/C][/ROW]
[ROW][C]3[/C][C]0.145443[/C][C]1.3409[/C][C]0.09176[/C][/ROW]
[ROW][C]4[/C][C]-0.110771[/C][C]-1.0213[/C][C]0.155016[/C][/ROW]
[ROW][C]5[/C][C]-0.02409[/C][C]-0.2221[/C][C]0.412383[/C][/ROW]
[ROW][C]6[/C][C]-0.243516[/C][C]-2.2451[/C][C]0.013679[/C][/ROW]
[ROW][C]7[/C][C]0.037259[/C][C]0.3435[/C][C]0.366032[/C][/ROW]
[ROW][C]8[/C][C]-0.040151[/C][C]-0.3702[/C][C]0.356086[/C][/ROW]
[ROW][C]9[/C][C]0.052142[/C][C]0.4807[/C][C]0.315975[/C][/ROW]
[ROW][C]10[/C][C]0.064981[/C][C]0.5991[/C][C]0.27535[/C][/ROW]
[ROW][C]11[/C][C]0.020852[/C][C]0.1922[/C][C]0.424005[/C][/ROW]
[ROW][C]12[/C][C]-0.162452[/C][C]-1.4977[/C][C]0.068953[/C][/ROW]
[ROW][C]13[/C][C]-0.040294[/C][C]-0.3715[/C][C]0.355597[/C][/ROW]
[ROW][C]14[/C][C]0.07771[/C][C]0.7164[/C][C]0.237839[/C][/ROW]
[ROW][C]15[/C][C]-0.043719[/C][C]-0.4031[/C][C]0.343954[/C][/ROW]
[ROW][C]16[/C][C]-0.070197[/C][C]-0.6472[/C][C]0.259628[/C][/ROW]
[ROW][C]17[/C][C]-0.027029[/C][C]-0.2492[/C][C]0.401906[/C][/ROW]
[ROW][C]18[/C][C]-0.063836[/C][C]-0.5885[/C][C]0.278865[/C][/ROW]
[ROW][C]19[/C][C]-0.010557[/C][C]-0.0973[/C][C]0.461345[/C][/ROW]
[/TABLE]
Source: https://freestatistics.org/blog/index.php?pk=35491&T=2

Globally Unique Identifier (entire table): ba.freestatistics.org/blog/index.php?pk=35491&T=2

As an alternative you can also use a QR Code:  

The GUIDs for individual cells are displayed in the table below:

Partial Autocorrelation Function
Time lag kPACF(k)T-STATP-value
10.9713888.95580
2-0.147865-1.36330.088202
30.1454431.34090.09176
4-0.110771-1.02130.155016
5-0.02409-0.22210.412383
6-0.243516-2.24510.013679
70.0372590.34350.366032
8-0.040151-0.37020.356086
90.0521420.48070.315975
100.0649810.59910.27535
110.0208520.19220.424005
12-0.162452-1.49770.068953
13-0.040294-0.37150.355597
140.077710.71640.237839
15-0.043719-0.40310.343954
16-0.070197-0.64720.259628
17-0.027029-0.24920.401906
18-0.063836-0.58850.278865
19-0.010557-0.09730.461345


Parameters (Session):
par1 = Default ; par2 = 1 ; par3 = 0 ; par4 = 0 ; par5 = 12 ;
Parameters (R input):
par1 = Default ; par2 = 1 ; par3 = 0 ; par4 = 0 ; par5 = 12 ;
R code (references can be found in the software module):
if (par1 == 'Default') {
par1 = 10*log10(length(x))
} else {
par1 <- as.numeric(par1)
}
par2 <- as.numeric(par2)
par3 <- as.numeric(par3)
par4 <- as.numeric(par4)
par5 <- as.numeric(par5)
if (par2 == 0) {
x <- log(x)
} else {
x <- (x ^ par2 - 1) / par2
}
if (par3 > 0) x <- diff(x,lag=1,difference=par3)
if (par4 > 0) x <- diff(x,lag=par5,difference=par4)
bitmap(file='pic1.png')
racf <- acf(x,par1,main='Autocorrelation',xlab='lags',ylab='ACF')
dev.off()
bitmap(file='pic2.png')
rpacf <- pacf(x,par1,main='Partial Autocorrelation',xlab='lags',ylab='PACF')
dev.off()
(myacf <- c(racf$acf))
(mypacf <- c(rpacf$acf))
lengthx <- length(x)
sqrtn <- sqrt(lengthx)
load(file='createtable')
a<-table.start()
a<-table.row.start(a)
a<-table.element(a,'Autocorrelation Function',4,TRUE)
a<-table.row.end(a)
a<-table.row.start(a)
a<-table.element(a,'Time lag k',header=TRUE)
a<-table.element(a,hyperlink('basics.htm','ACF(k)','click here for more information about the Autocorrelation Function'),header=TRUE)
a<-table.element(a,'T-STAT',header=TRUE)
a<-table.element(a,'P-value',header=TRUE)
a<-table.row.end(a)
for (i in 2:(par1+1)) {
a<-table.row.start(a)
a<-table.element(a,i-1,header=TRUE)
a<-table.element(a,round(myacf[i],6))
mytstat <- myacf[i]*sqrtn
a<-table.element(a,round(mytstat,4))
a<-table.element(a,round(1-pt(abs(mytstat),lengthx),6))
a<-table.row.end(a)
}
a<-table.end(a)
table.save(a,file='mytable.tab')
a<-table.start()
a<-table.row.start(a)
a<-table.element(a,'Partial Autocorrelation Function',4,TRUE)
a<-table.row.end(a)
a<-table.row.start(a)
a<-table.element(a,'Time lag k',header=TRUE)
a<-table.element(a,hyperlink('basics.htm','PACF(k)','click here for more information about the Partial Autocorrelation Function'),header=TRUE)
a<-table.element(a,'T-STAT',header=TRUE)
a<-table.element(a,'P-value',header=TRUE)
a<-table.row.end(a)
for (i in 1:par1) {
a<-table.row.start(a)
a<-table.element(a,i,header=TRUE)
a<-table.element(a,round(mypacf[i],6))
mytstat <- mypacf[i]*sqrtn
a<-table.element(a,round(mytstat,4))
a<-table.element(a,round(1-pt(abs(mytstat),lengthx),6))
a<-table.row.end(a)
}
a<-table.end(a)
table.save(a,file='mytable1.tab')