Free Statistics
of Irreproducible Research!
Description of Statistical Computation | |||||||||||||||||||||||||||||||||||||||||||||||||||||||||||||||||||||||||||||||||||||||||||||||||||
|---|---|---|---|---|---|---|---|---|---|---|---|---|---|---|---|---|---|---|---|---|---|---|---|---|---|---|---|---|---|---|---|---|---|---|---|---|---|---|---|---|---|---|---|---|---|---|---|---|---|---|---|---|---|---|---|---|---|---|---|---|---|---|---|---|---|---|---|---|---|---|---|---|---|---|---|---|---|---|---|---|---|---|---|---|---|---|---|---|---|---|---|---|---|---|---|---|---|---|---|
| Author's title | |||||||||||||||||||||||||||||||||||||||||||||||||||||||||||||||||||||||||||||||||||||||||||||||||||
| Author | *The author of this computation has been verified* | ||||||||||||||||||||||||||||||||||||||||||||||||||||||||||||||||||||||||||||||||||||||||||||||||||
| R Software Module | rwasp_correlation.wasp | ||||||||||||||||||||||||||||||||||||||||||||||||||||||||||||||||||||||||||||||||||||||||||||||||||
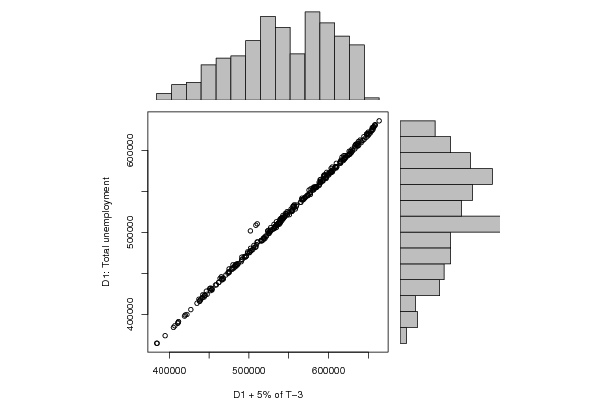
| Title produced by software | Pearson Correlation | ||||||||||||||||||||||||||||||||||||||||||||||||||||||||||||||||||||||||||||||||||||||||||||||||||
| Date of computation | Sat, 20 Dec 2008 15:52:36 -0700 | ||||||||||||||||||||||||||||||||||||||||||||||||||||||||||||||||||||||||||||||||||||||||||||||||||
| Cite this page as follows | Statistical Computations at FreeStatistics.org, Office for Research Development and Education, URL https://freestatistics.org/blog/index.php?v=date/2008/Dec/20/t1229813714qflnnavkk458pry.htm/, Retrieved Sun, 19 May 2024 12:01:27 +0000 | ||||||||||||||||||||||||||||||||||||||||||||||||||||||||||||||||||||||||||||||||||||||||||||||||||
| Statistical Computations at FreeStatistics.org, Office for Research Development and Education, URL https://freestatistics.org/blog/index.php?pk=35460, Retrieved Sun, 19 May 2024 12:01:27 +0000 | |||||||||||||||||||||||||||||||||||||||||||||||||||||||||||||||||||||||||||||||||||||||||||||||||||
| QR Codes: | |||||||||||||||||||||||||||||||||||||||||||||||||||||||||||||||||||||||||||||||||||||||||||||||||||
|
| |||||||||||||||||||||||||||||||||||||||||||||||||||||||||||||||||||||||||||||||||||||||||||||||||||
| Original text written by user: | |||||||||||||||||||||||||||||||||||||||||||||||||||||||||||||||||||||||||||||||||||||||||||||||||||
| IsPrivate? | No (this computation is public) | ||||||||||||||||||||||||||||||||||||||||||||||||||||||||||||||||||||||||||||||||||||||||||||||||||
| User-defined keywords | s0800650 Jan Werkhoven | ||||||||||||||||||||||||||||||||||||||||||||||||||||||||||||||||||||||||||||||||||||||||||||||||||
| Estimated Impact | 163 | ||||||||||||||||||||||||||||||||||||||||||||||||||||||||||||||||||||||||||||||||||||||||||||||||||
Tree of Dependent Computations | |||||||||||||||||||||||||||||||||||||||||||||||||||||||||||||||||||||||||||||||||||||||||||||||||||
| Family? (F = Feedback message, R = changed R code, M = changed R Module, P = changed Parameters, D = changed Data) | |||||||||||||||||||||||||||||||||||||||||||||||||||||||||||||||||||||||||||||||||||||||||||||||||||
| - [Pearson Correlation] [Pearson Correlati...] [2008-12-20 22:52:36] [721fbc57bdc4e4e6ec78137fe5a723c9] [Current] | |||||||||||||||||||||||||||||||||||||||||||||||||||||||||||||||||||||||||||||||||||||||||||||||||||
| Feedback Forum | |||||||||||||||||||||||||||||||||||||||||||||||||||||||||||||||||||||||||||||||||||||||||||||||||||
Post a new message | |||||||||||||||||||||||||||||||||||||||||||||||||||||||||||||||||||||||||||||||||||||||||||||||||||
Dataset | |||||||||||||||||||||||||||||||||||||||||||||||||||||||||||||||||||||||||||||||||||||||||||||||||||
| Dataseries X: | |||||||||||||||||||||||||||||||||||||||||||||||||||||||||||||||||||||||||||||||||||||||||||||||||||
510401 508642 501805 520996 515768 515132 577929 594516 597672 599345 603953 608836 608433 603119 592334 584596 574261 573275 632961 655133 658676 655930 644970 638034 632960 619800 603882 588571 581604 574398 634493 663674 657990 653603 649574 636936 650557 626908 600247 577183 558293 534443 582221 594256 589318 580546 569494 570579 568020 548274 531771 517645 507747 503163 547136 555516 556252 566084 551559 559925 557539 534641 521873 508750 495915 490866 539148 541277 538870 536479 525613 524147 519292 501127 483376 467870 453404 447399 498416 502035 490986 483633 475056 473553 467376 451397 443523 421997 410447 405069 451922 465294 450665 444860 438173 437781 434654 419947 406749 394592 384593 383993 437054 446444 441965 441595 438839 444432 444147 439744 426895 418968 410862 411403 463705 479869 474978 478479 475252 482027 483960 474003 466064 461867 453027 457876 510221 527337 524124 525324 526725 540593 545908 544589 537579 534650 531303 537025 595588 616931 619144 614854 615646 621183 623350 614900 602025 592619 583955 582620 629456 649989 644435 636546 626192 629425 630241 621327 605418 597219 584917 584026 636610 658626 656395 654847 641213 647262 652392 634696 615140 604776 585445 574114 627552 647843 634944 619903 609669 610551 608955 600493 589468 580370 565341 568585 615754 633887 625996 607053 592992 595815 590156 582276 568193 554335 539548 532277 580397 609817 594122 567220 550823 554005 553495 541794 529732 515627 504806 500275 548147 575479 555381 537221 519993 518769 518417 505582 486544 481251 466025 462245 511010 542663 523449 509434 490224 485245 491288 483280 470997 466219 459091 453727 506158 531477 534493 527032 496468 496713 501191 498154 493992 485053 478454 479148 539910 547928 545756 544427 535499 538387 545093 542471 535545 535085 526707 532468 594779 604757 603341 593930 576330 583688 590598 588221 583071 571715 564705 570489 620710 637596 639749 641001 624705 626085 621431 619087 614201 602643 596925 598249 649390 657257 656683 643154 626848 628553 624014 619842 609656 603875 602279 601932 648277 654448 648563 618603 597032 588270 589957 577141 559537 553948 538481 525246 581658 590143 566590 554838 538076 541341 543276 533053 518335 516089 494735 502211 552891 557058 541824 532593 | |||||||||||||||||||||||||||||||||||||||||||||||||||||||||||||||||||||||||||||||||||||||||||||||||||
| Dataseries Y: | |||||||||||||||||||||||||||||||||||||||||||||||||||||||||||||||||||||||||||||||||||||||||||||||||||
510401 508642 501805 495476 490336 490042 553155 569999 573170 571687 575453 580177 579849 574346 563325 555604 545544 545109 605181 627856 631421 625671 613577 606463 601676 589121 573559 558487 552148 545720 606569 636067 630704 623275 617771 605401 619393 596019 569977 546213 528492 505944 554910 567831 564021 552800 541102 542378 540380 521219 504652 490626 481686 477930 522605 531432 532355 539954 524987 533307 530541 508392 495208 482223 470495 466106 515037 517752 515565 510727 499725 498369 493756 476141 458458 443182 429597 424476 476257 480555 469762 459820 451028 450065 444385 428846 421020 399778 389005 384018 431933 445844 431464 423263 415881 416208 413491 399153 385939 373917 364635 364696 418358 428212 423730 420677 417428 423245 423113 418873 405733 397812 389918 391116 443814 460373 455422 456288 452233 459256 461146 451391 443101 438810 430457 435721 488280 505814 502338 500910 501434 515476 520862 519517 511805 508607 505327 511435 570158 591665 593572 586346 586063 591504 594033 585597 572450 562917 554675 553997 601310 622255 616735 606480 595079 598588 599917 591573 575489 567223 555338 555252 608249 630859 628632 624435 609670 615830 621170 604212 584348 573717 555234 544897 598866 620081 607699 589960 578665 580166 579457 571560 560460 551397 536763 540562 588184 607049 598968 577644 562640 565867 561274 554144 539900 526271 511841 505282 554083 584225 568858 539516 521612 525562 526519 515713 503454 489301 479020 475102 523682 551528 531626 511037 492417 492188 492865 480961 461935 456608 441977 439148 488180 520564 501492 485025 464196 460170 467037 460070 447988 442867 436087 431328 484015 509673 512927 502831 470984 471067 476049 474605 470439 461251 454724 455626 516847 525192 522975 518585 509239 512238 519164 517009 509933 509127 500857 506971 569323 579714 577992 565464 547344 554788 562325 560854 555332 543599 536662 542722 593530 610763 612613 611324 594167 595454 590865 589379 584428 573100 567456 569028 620735 628884 628232 612117 595404 597141 593408 590072 579799 574205 572775 572942 619567 625809 619916 587625 565742 557274 560576 548854 531673 525919 511038 498662 555362 564591 541657 527070 509846 514258 516922 507561 492622 490243 469357 477580 528379 533590 517945 506174 | |||||||||||||||||||||||||||||||||||||||||||||||||||||||||||||||||||||||||||||||||||||||||||||||||||
Tables (Output of Computation) | |||||||||||||||||||||||||||||||||||||||||||||||||||||||||||||||||||||||||||||||||||||||||||||||||||
| |||||||||||||||||||||||||||||||||||||||||||||||||||||||||||||||||||||||||||||||||||||||||||||||||||
Figures (Output of Computation) | |||||||||||||||||||||||||||||||||||||||||||||||||||||||||||||||||||||||||||||||||||||||||||||||||||
Input Parameters & R Code | |||||||||||||||||||||||||||||||||||||||||||||||||||||||||||||||||||||||||||||||||||||||||||||||||||
| Parameters (Session): | |||||||||||||||||||||||||||||||||||||||||||||||||||||||||||||||||||||||||||||||||||||||||||||||||||
| Parameters (R input): | |||||||||||||||||||||||||||||||||||||||||||||||||||||||||||||||||||||||||||||||||||||||||||||||||||
| R code (references can be found in the software module): | |||||||||||||||||||||||||||||||||||||||||||||||||||||||||||||||||||||||||||||||||||||||||||||||||||
bitmap(file='test1.png') | |||||||||||||||||||||||||||||||||||||||||||||||||||||||||||||||||||||||||||||||||||||||||||||||||||