Free Statistics

of Irreproducible Research!

Author's title

Author*The author of this computation has been verified*
R Software Modulerwasp_arimabackwardselection.wasp
Title produced by softwareARIMA Backward Selection
Date of computationSat, 20 Dec 2008 14:03:45 -0700
Cite this page as followsStatistical Computations at FreeStatistics.org, Office for Research Development and Education, URL https://freestatistics.org/blog/index.php?v=date/2008/Dec/20/t1229807066djl145kji4a5agd.htm/, Retrieved Sun, 19 May 2024 12:18:36 +0000
Statistical Computations at FreeStatistics.org, Office for Research Development and Education, URL https://freestatistics.org/blog/index.php?pk=35447, Retrieved Sun, 19 May 2024 12:18:36 +0000
QR Codes:

Original text written by user:
IsPrivate?No (this computation is public)
User-defined keywords
Estimated Impact238
Family? (F = Feedback message, R = changed R code, M = changed R Module, P = changed Parameters, D = changed Data)
-     [Univariate Data Series] [data set] [2008-12-01 19:54:57] [b98453cac15ba1066b407e146608df68]
- RMPD  [Standard Deviation-Mean Plot] [Identification an...] [2008-12-07 14:45:52] [b943bd7078334192ff8343563ee31113]
- RM      [Variance Reduction Matrix] [Identification an...] [2008-12-07 14:47:22] [b943bd7078334192ff8343563ee31113]
- RMP       [(Partial) Autocorrelation Function] [Identification an...] [2008-12-07 14:51:36] [b943bd7078334192ff8343563ee31113]
F   P         [(Partial) Autocorrelation Function] [Identification an...] [2008-12-07 14:54:30] [b943bd7078334192ff8343563ee31113]
-   P           [(Partial) Autocorrelation Function] [Identification an...] [2008-12-07 14:58:01] [b943bd7078334192ff8343563ee31113]
F RMP             [Spectral Analysis] [Identification an...] [2008-12-07 15:02:51] [b943bd7078334192ff8343563ee31113]
F RMP               [(Partial) Autocorrelation Function] [Identification an...] [2008-12-07 15:05:29] [b943bd7078334192ff8343563ee31113]
F RMP                 [ARIMA Backward Selection] [Identification an...] [2008-12-07 15:45:38] [b943bd7078334192ff8343563ee31113]
-   P                   [ARIMA Backward Selection] [ARIMA Backward Mo...] [2008-12-12 14:46:56] [b943bd7078334192ff8343563ee31113]
-   P                       [ARIMA Backward Selection] [ARIMA ciska] [2008-12-20 21:03:45] [a8228479d4547a92e2d3f176a5299609] [Current]
Feedback Forum

Post a new message
Dataseries X:
1593
1477.9
1733.7
1569.7
1843.7
1950.3
1657.5
1772.1
1568.3
1809.8
1646.7
1808.5
1763.9
1625.5
1538.8
1342.4
1645.1
1619.9
1338.1
1505.5
1529.1
1511.9
1656.7
1694.4
1662.3
1588.7
1483.3
1585.6
1658.9
1584.4
1470.6
1618.7
1407.6
1473.9
1515.3
1485.4
1496.1
1493.5
1298.4
1375.3
1507.9
1455.3
1363.3
1392.8
1348.8
1880.3
1669.2
1543.6
1701.2
1516.5
1466.8
1484.1
1577.2
1684.5
1414.7
1674.5
1598.7
1739.1
1674.6
1671.8
1802
1526.8
1580.9
1634.8
1610.3
1712
1678.8
1708.1
1680.6
2056
1624
2021.4
1861.1
1750.8
1767.5
1710.3
2151.5
2047.9
1915.4
1984.7
1896.5
2170.8
2139.9
2330.5
2121.8
2226.8
1857.9
2155.9
2341.7
2290.2
2006.5
2111.9
1731.3
1762.2
1863.2
1943.5
1975.2


Summary of computational transaction
Raw Inputview raw input (R code)
Raw Outputview raw output of R engine
Computing time5 seconds
R Server'Gwilym Jenkins' @ 72.249.127.135

\begin{tabular}{lllllllll}
\hline
Summary of computational transaction \tabularnewline
Raw Input & view raw input (R code)  \tabularnewline
Raw Output & view raw output of R engine  \tabularnewline
Computing time & 5 seconds \tabularnewline
R Server & 'Gwilym Jenkins' @ 72.249.127.135 \tabularnewline
\hline
\end{tabular}
%Source: https://freestatistics.org/blog/index.php?pk=35447&T=0

[TABLE]
[ROW][C]Summary of computational transaction[/C][/ROW]
[ROW][C]Raw Input[/C][C]view raw input (R code) [/C][/ROW]
[ROW][C]Raw Output[/C][C]view raw output of R engine [/C][/ROW]
[ROW][C]Computing time[/C][C]5 seconds[/C][/ROW]
[ROW][C]R Server[/C][C]'Gwilym Jenkins' @ 72.249.127.135[/C][/ROW]
[/TABLE]
Source: https://freestatistics.org/blog/index.php?pk=35447&T=0

Globally Unique Identifier (entire table): ba.freestatistics.org/blog/index.php?pk=35447&T=0

As an alternative you can also use a QR Code:  

The GUIDs for individual cells are displayed in the table below:

Summary of computational transaction
Raw Inputview raw input (R code)
Raw Outputview raw output of R engine
Computing time5 seconds
R Server'Gwilym Jenkins' @ 72.249.127.135


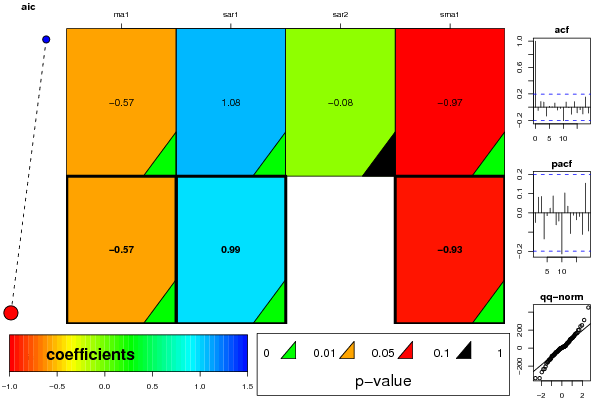
ARIMA Parameter Estimation and Backward Selection
Iterationma1sar1sar2sma1
Estimates ( 1 )-0.56611.0778-0.0787-0.9709
(p-val)(0 )(0 )(0.5799 )(0 )
Estimates ( 2 )-0.56870.99490-0.9292
(p-val)(0 )(0 )(NA )(0 )
Estimates ( 3 )NANANANA
(p-val)(NA )(NA )(NA )(NA )
Estimates ( 4 )NANANANA
(p-val)(NA )(NA )(NA )(NA )
Estimates ( 5 )NANANANA
(p-val)(NA )(NA )(NA )(NA )
Estimates ( 6 )NANANANA
(p-val)(NA )(NA )(NA )(NA )
Estimates ( 7 )NANANANA
(p-val)(NA )(NA )(NA )(NA )

\begin{tabular}{lllllllll}
\hline
ARIMA Parameter Estimation and Backward Selection \tabularnewline
Iteration & ma1 & sar1 & sar2 & sma1 \tabularnewline
Estimates ( 1 ) & -0.5661 & 1.0778 & -0.0787 & -0.9709 \tabularnewline
(p-val) & (0 ) & (0 ) & (0.5799 ) & (0 ) \tabularnewline
Estimates ( 2 ) & -0.5687 & 0.9949 & 0 & -0.9292 \tabularnewline
(p-val) & (0 ) & (0 ) & (NA ) & (0 ) \tabularnewline
Estimates ( 3 ) & NA & NA & NA & NA \tabularnewline
(p-val) & (NA ) & (NA ) & (NA ) & (NA ) \tabularnewline
Estimates ( 4 ) & NA & NA & NA & NA \tabularnewline
(p-val) & (NA ) & (NA ) & (NA ) & (NA ) \tabularnewline
Estimates ( 5 ) & NA & NA & NA & NA \tabularnewline
(p-val) & (NA ) & (NA ) & (NA ) & (NA ) \tabularnewline
Estimates ( 6 ) & NA & NA & NA & NA \tabularnewline
(p-val) & (NA ) & (NA ) & (NA ) & (NA ) \tabularnewline
Estimates ( 7 ) & NA & NA & NA & NA \tabularnewline
(p-val) & (NA ) & (NA ) & (NA ) & (NA ) \tabularnewline
\hline
\end{tabular}
%Source: https://freestatistics.org/blog/index.php?pk=35447&T=1

[TABLE]
[ROW][C]ARIMA Parameter Estimation and Backward Selection[/C][/ROW]
[ROW][C]Iteration[/C][C]ma1[/C][C]sar1[/C][C]sar2[/C][C]sma1[/C][/ROW]
[ROW][C]Estimates ( 1 )[/C][C]-0.5661[/C][C]1.0778[/C][C]-0.0787[/C][C]-0.9709[/C][/ROW]
[ROW][C](p-val)[/C][C](0 )[/C][C](0 )[/C][C](0.5799 )[/C][C](0 )[/C][/ROW]
[ROW][C]Estimates ( 2 )[/C][C]-0.5687[/C][C]0.9949[/C][C]0[/C][C]-0.9292[/C][/ROW]
[ROW][C](p-val)[/C][C](0 )[/C][C](0 )[/C][C](NA )[/C][C](0 )[/C][/ROW]
[ROW][C]Estimates ( 3 )[/C][C]NA[/C][C]NA[/C][C]NA[/C][C]NA[/C][/ROW]
[ROW][C](p-val)[/C][C](NA )[/C][C](NA )[/C][C](NA )[/C][C](NA )[/C][/ROW]
[ROW][C]Estimates ( 4 )[/C][C]NA[/C][C]NA[/C][C]NA[/C][C]NA[/C][/ROW]
[ROW][C](p-val)[/C][C](NA )[/C][C](NA )[/C][C](NA )[/C][C](NA )[/C][/ROW]
[ROW][C]Estimates ( 5 )[/C][C]NA[/C][C]NA[/C][C]NA[/C][C]NA[/C][/ROW]
[ROW][C](p-val)[/C][C](NA )[/C][C](NA )[/C][C](NA )[/C][C](NA )[/C][/ROW]
[ROW][C]Estimates ( 6 )[/C][C]NA[/C][C]NA[/C][C]NA[/C][C]NA[/C][/ROW]
[ROW][C](p-val)[/C][C](NA )[/C][C](NA )[/C][C](NA )[/C][C](NA )[/C][/ROW]
[ROW][C]Estimates ( 7 )[/C][C]NA[/C][C]NA[/C][C]NA[/C][C]NA[/C][/ROW]
[ROW][C](p-val)[/C][C](NA )[/C][C](NA )[/C][C](NA )[/C][C](NA )[/C][/ROW]
[/TABLE]
Source: https://freestatistics.org/blog/index.php?pk=35447&T=1

Globally Unique Identifier (entire table): ba.freestatistics.org/blog/index.php?pk=35447&T=1

As an alternative you can also use a QR Code:  

The GUIDs for individual cells are displayed in the table below:

ARIMA Parameter Estimation and Backward Selection
Iterationma1sar1sar2sma1
Estimates ( 1 )-0.56611.0778-0.0787-0.9709
(p-val)(0 )(0 )(0.5799 )(0 )
Estimates ( 2 )-0.56870.99490-0.9292
(p-val)(0 )(0 )(NA )(0 )
Estimates ( 3 )NANANANA
(p-val)(NA )(NA )(NA )(NA )
Estimates ( 4 )NANANANA
(p-val)(NA )(NA )(NA )(NA )
Estimates ( 5 )NANANANA
(p-val)(NA )(NA )(NA )(NA )
Estimates ( 6 )NANANANA
(p-val)(NA )(NA )(NA )(NA )
Estimates ( 7 )NANANANA
(p-val)(NA )(NA )(NA )(NA )


Estimated ARIMA Residuals
Value
1.59299846831418
-83.000015894572
164.791537425665
-45.5155660735906
200.851122008478
201.395878146019
-128.702101574785
22.1288951486519
-156.347850841740
111.612374642240
-71.9694491102372
93.3342699648117
20.4336128151461
-72.5905240392064
-204.459281831556
-234.794210325955
44.9966801174085
-33.5281289019843
-171.538349950072
13.7931399459725
98.5638812144533
-42.0983768176069
161.652285449389
70.0423159715269
37.6855817947879
14.2568864480491
-116.203007117892
114.854998557609
-5.47020234758828
-86.0171706759889
-17.3771306359579
57.4028737424219
-126.948729117256
-54.7316484788633
0.166336566228758
-70.1494959576939
-2.27834792201559
54.4533838488906
-155.151138609282
17.0318095543311
23.261846058439
-31.8667436887973
15.9344559060689
-44.1688583814856
15.3096815025950
451.136906594362
53.2402407480457
-112.737167713489
101.940205883941
-71.9567013673263
-56.0349827603554
3.66003861586262
-27.8550884546482
95.0171085639625
-86.7515963767206
131.702963753237
66.5727951519754
12.9874549770724
-8.66222658211487
-4.23412769528288
104.19963504733
-126.881149804849
2.74866166665538
71.7801609897575
-94.4969568396552
26.0597252469911
130.465390014195
-4.81108799344152
38.6298941477138
253.621340388723
-231.566266723687
241.536219763375
-43.9368244106188
-24.7813858553071
8.37136738036822
-42.2143268268175
311.714626983457
50.6428949816887
18.1914733896794
-3.69802187868617
-27.2959692769983
75.7799657255304
122.138960844707
171.521676846343
-88.1879167289398
145.01808233856
-266.755623482546
157.736693755408
109.432422024924
14.7052375037540
-139.459693495413
-59.6788524764186
-333.828946553748
-333.832654147369
-21.1250869226767
-10.5175844788124
62.7399708979151

\begin{tabular}{lllllllll}
\hline
Estimated ARIMA Residuals \tabularnewline
Value \tabularnewline
1.59299846831418 \tabularnewline
-83.000015894572 \tabularnewline
164.791537425665 \tabularnewline
-45.5155660735906 \tabularnewline
200.851122008478 \tabularnewline
201.395878146019 \tabularnewline
-128.702101574785 \tabularnewline
22.1288951486519 \tabularnewline
-156.347850841740 \tabularnewline
111.612374642240 \tabularnewline
-71.9694491102372 \tabularnewline
93.3342699648117 \tabularnewline
20.4336128151461 \tabularnewline
-72.5905240392064 \tabularnewline
-204.459281831556 \tabularnewline
-234.794210325955 \tabularnewline
44.9966801174085 \tabularnewline
-33.5281289019843 \tabularnewline
-171.538349950072 \tabularnewline
13.7931399459725 \tabularnewline
98.5638812144533 \tabularnewline
-42.0983768176069 \tabularnewline
161.652285449389 \tabularnewline
70.0423159715269 \tabularnewline
37.6855817947879 \tabularnewline
14.2568864480491 \tabularnewline
-116.203007117892 \tabularnewline
114.854998557609 \tabularnewline
-5.47020234758828 \tabularnewline
-86.0171706759889 \tabularnewline
-17.3771306359579 \tabularnewline
57.4028737424219 \tabularnewline
-126.948729117256 \tabularnewline
-54.7316484788633 \tabularnewline
0.166336566228758 \tabularnewline
-70.1494959576939 \tabularnewline
-2.27834792201559 \tabularnewline
54.4533838488906 \tabularnewline
-155.151138609282 \tabularnewline
17.0318095543311 \tabularnewline
23.261846058439 \tabularnewline
-31.8667436887973 \tabularnewline
15.9344559060689 \tabularnewline
-44.1688583814856 \tabularnewline
15.3096815025950 \tabularnewline
451.136906594362 \tabularnewline
53.2402407480457 \tabularnewline
-112.737167713489 \tabularnewline
101.940205883941 \tabularnewline
-71.9567013673263 \tabularnewline
-56.0349827603554 \tabularnewline
3.66003861586262 \tabularnewline
-27.8550884546482 \tabularnewline
95.0171085639625 \tabularnewline
-86.7515963767206 \tabularnewline
131.702963753237 \tabularnewline
66.5727951519754 \tabularnewline
12.9874549770724 \tabularnewline
-8.66222658211487 \tabularnewline
-4.23412769528288 \tabularnewline
104.19963504733 \tabularnewline
-126.881149804849 \tabularnewline
2.74866166665538 \tabularnewline
71.7801609897575 \tabularnewline
-94.4969568396552 \tabularnewline
26.0597252469911 \tabularnewline
130.465390014195 \tabularnewline
-4.81108799344152 \tabularnewline
38.6298941477138 \tabularnewline
253.621340388723 \tabularnewline
-231.566266723687 \tabularnewline
241.536219763375 \tabularnewline
-43.9368244106188 \tabularnewline
-24.7813858553071 \tabularnewline
8.37136738036822 \tabularnewline
-42.2143268268175 \tabularnewline
311.714626983457 \tabularnewline
50.6428949816887 \tabularnewline
18.1914733896794 \tabularnewline
-3.69802187868617 \tabularnewline
-27.2959692769983 \tabularnewline
75.7799657255304 \tabularnewline
122.138960844707 \tabularnewline
171.521676846343 \tabularnewline
-88.1879167289398 \tabularnewline
145.01808233856 \tabularnewline
-266.755623482546 \tabularnewline
157.736693755408 \tabularnewline
109.432422024924 \tabularnewline
14.7052375037540 \tabularnewline
-139.459693495413 \tabularnewline
-59.6788524764186 \tabularnewline
-333.828946553748 \tabularnewline
-333.832654147369 \tabularnewline
-21.1250869226767 \tabularnewline
-10.5175844788124 \tabularnewline
62.7399708979151 \tabularnewline
\hline
\end{tabular}
%Source: https://freestatistics.org/blog/index.php?pk=35447&T=2

[TABLE]
[ROW][C]Estimated ARIMA Residuals[/C][/ROW]
[ROW][C]Value[/C][/ROW]
[ROW][C]1.59299846831418[/C][/ROW]
[ROW][C]-83.000015894572[/C][/ROW]
[ROW][C]164.791537425665[/C][/ROW]
[ROW][C]-45.5155660735906[/C][/ROW]
[ROW][C]200.851122008478[/C][/ROW]
[ROW][C]201.395878146019[/C][/ROW]
[ROW][C]-128.702101574785[/C][/ROW]
[ROW][C]22.1288951486519[/C][/ROW]
[ROW][C]-156.347850841740[/C][/ROW]
[ROW][C]111.612374642240[/C][/ROW]
[ROW][C]-71.9694491102372[/C][/ROW]
[ROW][C]93.3342699648117[/C][/ROW]
[ROW][C]20.4336128151461[/C][/ROW]
[ROW][C]-72.5905240392064[/C][/ROW]
[ROW][C]-204.459281831556[/C][/ROW]
[ROW][C]-234.794210325955[/C][/ROW]
[ROW][C]44.9966801174085[/C][/ROW]
[ROW][C]-33.5281289019843[/C][/ROW]
[ROW][C]-171.538349950072[/C][/ROW]
[ROW][C]13.7931399459725[/C][/ROW]
[ROW][C]98.5638812144533[/C][/ROW]
[ROW][C]-42.0983768176069[/C][/ROW]
[ROW][C]161.652285449389[/C][/ROW]
[ROW][C]70.0423159715269[/C][/ROW]
[ROW][C]37.6855817947879[/C][/ROW]
[ROW][C]14.2568864480491[/C][/ROW]
[ROW][C]-116.203007117892[/C][/ROW]
[ROW][C]114.854998557609[/C][/ROW]
[ROW][C]-5.47020234758828[/C][/ROW]
[ROW][C]-86.0171706759889[/C][/ROW]
[ROW][C]-17.3771306359579[/C][/ROW]
[ROW][C]57.4028737424219[/C][/ROW]
[ROW][C]-126.948729117256[/C][/ROW]
[ROW][C]-54.7316484788633[/C][/ROW]
[ROW][C]0.166336566228758[/C][/ROW]
[ROW][C]-70.1494959576939[/C][/ROW]
[ROW][C]-2.27834792201559[/C][/ROW]
[ROW][C]54.4533838488906[/C][/ROW]
[ROW][C]-155.151138609282[/C][/ROW]
[ROW][C]17.0318095543311[/C][/ROW]
[ROW][C]23.261846058439[/C][/ROW]
[ROW][C]-31.8667436887973[/C][/ROW]
[ROW][C]15.9344559060689[/C][/ROW]
[ROW][C]-44.1688583814856[/C][/ROW]
[ROW][C]15.3096815025950[/C][/ROW]
[ROW][C]451.136906594362[/C][/ROW]
[ROW][C]53.2402407480457[/C][/ROW]
[ROW][C]-112.737167713489[/C][/ROW]
[ROW][C]101.940205883941[/C][/ROW]
[ROW][C]-71.9567013673263[/C][/ROW]
[ROW][C]-56.0349827603554[/C][/ROW]
[ROW][C]3.66003861586262[/C][/ROW]
[ROW][C]-27.8550884546482[/C][/ROW]
[ROW][C]95.0171085639625[/C][/ROW]
[ROW][C]-86.7515963767206[/C][/ROW]
[ROW][C]131.702963753237[/C][/ROW]
[ROW][C]66.5727951519754[/C][/ROW]
[ROW][C]12.9874549770724[/C][/ROW]
[ROW][C]-8.66222658211487[/C][/ROW]
[ROW][C]-4.23412769528288[/C][/ROW]
[ROW][C]104.19963504733[/C][/ROW]
[ROW][C]-126.881149804849[/C][/ROW]
[ROW][C]2.74866166665538[/C][/ROW]
[ROW][C]71.7801609897575[/C][/ROW]
[ROW][C]-94.4969568396552[/C][/ROW]
[ROW][C]26.0597252469911[/C][/ROW]
[ROW][C]130.465390014195[/C][/ROW]
[ROW][C]-4.81108799344152[/C][/ROW]
[ROW][C]38.6298941477138[/C][/ROW]
[ROW][C]253.621340388723[/C][/ROW]
[ROW][C]-231.566266723687[/C][/ROW]
[ROW][C]241.536219763375[/C][/ROW]
[ROW][C]-43.9368244106188[/C][/ROW]
[ROW][C]-24.7813858553071[/C][/ROW]
[ROW][C]8.37136738036822[/C][/ROW]
[ROW][C]-42.2143268268175[/C][/ROW]
[ROW][C]311.714626983457[/C][/ROW]
[ROW][C]50.6428949816887[/C][/ROW]
[ROW][C]18.1914733896794[/C][/ROW]
[ROW][C]-3.69802187868617[/C][/ROW]
[ROW][C]-27.2959692769983[/C][/ROW]
[ROW][C]75.7799657255304[/C][/ROW]
[ROW][C]122.138960844707[/C][/ROW]
[ROW][C]171.521676846343[/C][/ROW]
[ROW][C]-88.1879167289398[/C][/ROW]
[ROW][C]145.01808233856[/C][/ROW]
[ROW][C]-266.755623482546[/C][/ROW]
[ROW][C]157.736693755408[/C][/ROW]
[ROW][C]109.432422024924[/C][/ROW]
[ROW][C]14.7052375037540[/C][/ROW]
[ROW][C]-139.459693495413[/C][/ROW]
[ROW][C]-59.6788524764186[/C][/ROW]
[ROW][C]-333.828946553748[/C][/ROW]
[ROW][C]-333.832654147369[/C][/ROW]
[ROW][C]-21.1250869226767[/C][/ROW]
[ROW][C]-10.5175844788124[/C][/ROW]
[ROW][C]62.7399708979151[/C][/ROW]
[/TABLE]
Source: https://freestatistics.org/blog/index.php?pk=35447&T=2

Globally Unique Identifier (entire table): ba.freestatistics.org/blog/index.php?pk=35447&T=2

As an alternative you can also use a QR Code:  

The GUIDs for individual cells are displayed in the table below:

Estimated ARIMA Residuals
Value
1.59299846831418
-83.000015894572
164.791537425665
-45.5155660735906
200.851122008478
201.395878146019
-128.702101574785
22.1288951486519
-156.347850841740
111.612374642240
-71.9694491102372
93.3342699648117
20.4336128151461
-72.5905240392064
-204.459281831556
-234.794210325955
44.9966801174085
-33.5281289019843
-171.538349950072
13.7931399459725
98.5638812144533
-42.0983768176069
161.652285449389
70.0423159715269
37.6855817947879
14.2568864480491
-116.203007117892
114.854998557609
-5.47020234758828
-86.0171706759889
-17.3771306359579
57.4028737424219
-126.948729117256
-54.7316484788633
0.166336566228758
-70.1494959576939
-2.27834792201559
54.4533838488906
-155.151138609282
17.0318095543311
23.261846058439
-31.8667436887973
15.9344559060689
-44.1688583814856
15.3096815025950
451.136906594362
53.2402407480457
-112.737167713489
101.940205883941
-71.9567013673263
-56.0349827603554
3.66003861586262
-27.8550884546482
95.0171085639625
-86.7515963767206
131.702963753237
66.5727951519754
12.9874549770724
-8.66222658211487
-4.23412769528288
104.19963504733
-126.881149804849
2.74866166665538
71.7801609897575
-94.4969568396552
26.0597252469911
130.465390014195
-4.81108799344152
38.6298941477138
253.621340388723
-231.566266723687
241.536219763375
-43.9368244106188
-24.7813858553071
8.37136738036822
-42.2143268268175
311.714626983457
50.6428949816887
18.1914733896794
-3.69802187868617
-27.2959692769983
75.7799657255304
122.138960844707
171.521676846343
-88.1879167289398
145.01808233856
-266.755623482546
157.736693755408
109.432422024924
14.7052375037540
-139.459693495413
-59.6788524764186
-333.828946553748
-333.832654147369
-21.1250869226767
-10.5175844788124
62.7399708979151


Parameters (Session):
par1 = FALSE ; par2 = 1 ; par3 = 1 ; par4 = 0 ; par5 = 12 ; par6 = 0 ; par7 = 1 ; par8 = 2 ; par9 = 1 ;
Parameters (R input):
par1 = FALSE ; par2 = 1 ; par3 = 1 ; par4 = 0 ; par5 = 12 ; par6 = 0 ; par7 = 1 ; par8 = 2 ; par9 = 1 ;
R code (references can be found in the software module):
library(lattice)
if (par1 == 'TRUE') par1 <- TRUE
if (par1 == 'FALSE') par1 <- FALSE
par2 <- as.numeric(par2) #Box-Cox lambda transformation parameter
par3 <- as.numeric(par3) #degree of non-seasonal differencing
par4 <- as.numeric(par4) #degree of seasonal differencing
par5 <- as.numeric(par5) #seasonal period
par6 <- as.numeric(par6) #degree (p) of the non-seasonal AR(p) polynomial
par7 <- as.numeric(par7) #degree (q) of the non-seasonal MA(q) polynomial
par8 <- as.numeric(par8) #degree (P) of the seasonal AR(P) polynomial
par9 <- as.numeric(par9) #degree (Q) of the seasonal MA(Q) polynomial
armaGR <- function(arima.out, names, n){
try1 <- arima.out$coef
try2 <- sqrt(diag(arima.out$var.coef))
try.data.frame <- data.frame(matrix(NA,ncol=4,nrow=length(names)))
dimnames(try.data.frame) <- list(names,c('coef','std','tstat','pv'))
try.data.frame[,1] <- try1
for(i in 1:length(try2)) try.data.frame[which(rownames(try.data.frame)==names(try2)[i]),2] <- try2[i]
try.data.frame[,3] <- try.data.frame[,1] / try.data.frame[,2]
try.data.frame[,4] <- round((1-pt(abs(try.data.frame[,3]),df=n-(length(try2)+1)))*2,5)
vector <- rep(NA,length(names))
vector[is.na(try.data.frame[,4])] <- 0
maxi <- which.max(try.data.frame[,4])
continue <- max(try.data.frame[,4],na.rm=TRUE) > .05
vector[maxi] <- 0
list(summary=try.data.frame,next.vector=vector,continue=continue)
}
arimaSelect <- function(series, order=c(13,0,0), seasonal=list(order=c(2,0,0),period=12), include.mean=F){
nrc <- order[1]+order[3]+seasonal$order[1]+seasonal$order[3]
coeff <- matrix(NA, nrow=nrc*2, ncol=nrc)
pval <- matrix(NA, nrow=nrc*2, ncol=nrc)
mylist <- rep(list(NULL), nrc)
names <- NULL
if(order[1] > 0) names <- paste('ar',1:order[1],sep='')
if(order[3] > 0) names <- c( names , paste('ma',1:order[3],sep='') )
if(seasonal$order[1] > 0) names <- c(names, paste('sar',1:seasonal$order[1],sep=''))
if(seasonal$order[3] > 0) names <- c(names, paste('sma',1:seasonal$order[3],sep=''))
arima.out <- arima(series, order=order, seasonal=seasonal, include.mean=include.mean, method='ML')
mylist[[1]] <- arima.out
last.arma <- armaGR(arima.out, names, length(series))
mystop <- FALSE
i <- 1
coeff[i,] <- last.arma[[1]][,1]
pval [i,] <- last.arma[[1]][,4]
i <- 2
aic <- arima.out$aic
while(!mystop){
mylist[[i]] <- arima.out
arima.out <- arima(series, order=order, seasonal=seasonal, include.mean=include.mean, method='ML', fixed=last.arma$next.vector)
aic <- c(aic, arima.out$aic)
last.arma <- armaGR(arima.out, names, length(series))
mystop <- !last.arma$continue
coeff[i,] <- last.arma[[1]][,1]
pval [i,] <- last.arma[[1]][,4]
i <- i+1
}
list(coeff, pval, mylist, aic=aic)
}
arimaSelectplot <- function(arimaSelect.out,noms,choix){
noms <- names(arimaSelect.out[[3]][[1]]$coef)
coeff <- arimaSelect.out[[1]]
k <- min(which(is.na(coeff[,1])))-1
coeff <- coeff[1:k,]
pval <- arimaSelect.out[[2]][1:k,]
aic <- arimaSelect.out$aic[1:k]
coeff[coeff==0] <- NA
n <- ncol(coeff)
if(missing(choix)) choix <- k
layout(matrix(c(1,1,1,2,
3,3,3,2,
3,3,3,4,
5,6,7,7),nr=4),
widths=c(10,35,45,15),
heights=c(30,30,15,15))
couleurs <- rainbow(75)[1:50]#(50)
ticks <- pretty(coeff)
par(mar=c(1,1,3,1))
plot(aic,k:1-.5,type='o',pch=21,bg='blue',cex=2,axes=F,lty=2,xpd=NA)
points(aic[choix],k-choix+.5,pch=21,cex=4,bg=2,xpd=NA)
title('aic',line=2)
par(mar=c(3,0,0,0))
plot(0,axes=F,xlab='',ylab='',xlim=range(ticks),ylim=c(.1,1))
rect(xleft = min(ticks) + (0:49)/50*(max(ticks)-min(ticks)),
xright = min(ticks) + (1:50)/50*(max(ticks)-min(ticks)),
ytop = rep(1,50),
ybottom= rep(0,50),col=couleurs,border=NA)
axis(1,ticks)
rect(xleft=min(ticks),xright=max(ticks),ytop=1,ybottom=0)
text(mean(coeff,na.rm=T),.5,'coefficients',cex=2,font=2)
par(mar=c(1,1,3,1))
image(1:n,1:k,t(coeff[k:1,]),axes=F,col=couleurs,zlim=range(ticks))
for(i in 1:n) for(j in 1:k) if(!is.na(coeff[j,i])) {
if(pval[j,i]<.01) symb = 'green'
else if( (pval[j,i]<.05) & (pval[j,i]>=.01)) symb = 'orange'
else if( (pval[j,i]<.1) & (pval[j,i]>=.05)) symb = 'red'
else symb = 'black'
polygon(c(i+.5 ,i+.2 ,i+.5 ,i+.5),
c(k-j+0.5,k-j+0.5,k-j+0.8,k-j+0.5),
col=symb)
if(j==choix) {
rect(xleft=i-.5,
xright=i+.5,
ybottom=k-j+1.5,
ytop=k-j+.5,
lwd=4)
text(i,
k-j+1,
round(coeff[j,i],2),
cex=1.2,
font=2)
}
else{
rect(xleft=i-.5,xright=i+.5,ybottom=k-j+1.5,ytop=k-j+.5)
text(i,k-j+1,round(coeff[j,i],2),cex=1.2,font=1)
}
}
axis(3,1:n,noms)
par(mar=c(0.5,0,0,0.5))
plot(0,axes=F,xlab='',ylab='',type='n',xlim=c(0,8),ylim=c(-.2,.8))
cols <- c('green','orange','red','black')
niv <- c('0','0.01','0.05','0.1')
for(i in 0:3){
polygon(c(1+2*i ,1+2*i ,1+2*i-.5 ,1+2*i),
c(.4 ,.7 , .4 , .4),
col=cols[i+1])
text(2*i,0.5,niv[i+1],cex=1.5)
}
text(8,.5,1,cex=1.5)
text(4,0,'p-value',cex=2)
box()
residus <- arimaSelect.out[[3]][[choix]]$res
par(mar=c(1,2,4,1))
acf(residus,main='')
title('acf',line=.5)
par(mar=c(1,2,4,1))
pacf(residus,main='')
title('pacf',line=.5)
par(mar=c(2,2,4,1))
qqnorm(residus,main='')
title('qq-norm',line=.5)
qqline(residus)
residus
}
if (par2 == 0) x <- log(x)
if (par2 != 0) x <- x^par2
(selection <- arimaSelect(x, order=c(par6,par3,par7), seasonal=list(order=c(par8,par4,par9), period=par5)))
bitmap(file='test1.png')
resid <- arimaSelectplot(selection)
dev.off()
resid
bitmap(file='test2.png')
acf(resid,length(resid)/2, main='Residual Autocorrelation Function')
dev.off()
bitmap(file='test3.png')
pacf(resid,length(resid)/2, main='Residual Partial Autocorrelation Function')
dev.off()
bitmap(file='test4.png')
cpgram(resid, main='Residual Cumulative Periodogram')
dev.off()
bitmap(file='test5.png')
hist(resid, main='Residual Histogram', xlab='values of Residuals')
dev.off()
bitmap(file='test6.png')
densityplot(~resid,col='black',main='Residual Density Plot', xlab='values of Residuals')
dev.off()
bitmap(file='test7.png')
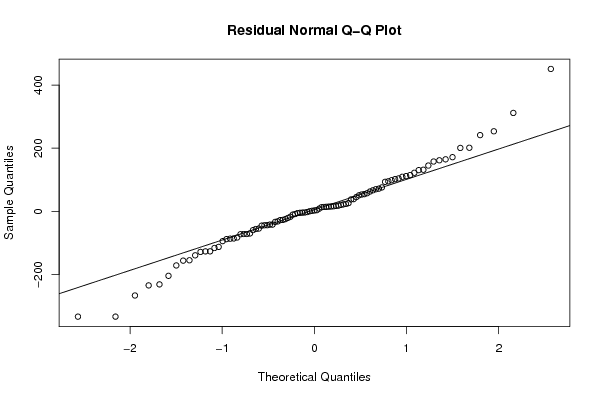
qqnorm(resid, main='Residual Normal Q-Q Plot')
qqline(resid)
dev.off()
ncols <- length(selection[[1]][1,])
nrows <- length(selection[[2]][,1])-1
load(file='createtable')
a<-table.start()
a<-table.row.start(a)
a<-table.element(a,'ARIMA Parameter Estimation and Backward Selection', ncols+1,TRUE)
a<-table.row.end(a)
a<-table.row.start(a)
a<-table.element(a,'Iteration', header=TRUE)
for (i in 1:ncols) {
a<-table.element(a,names(selection[[3]][[1]]$coef)[i],header=TRUE)
}
a<-table.row.end(a)
for (j in 1:nrows) {
a<-table.row.start(a)
mydum <- 'Estimates ('
mydum <- paste(mydum,j)
mydum <- paste(mydum,')')
a<-table.element(a,mydum, header=TRUE)
for (i in 1:ncols) {
a<-table.element(a,round(selection[[1]][j,i],4))
}
a<-table.row.end(a)
a<-table.row.start(a)
a<-table.element(a,'(p-val)', header=TRUE)
for (i in 1:ncols) {
mydum <- '('
mydum <- paste(mydum,round(selection[[2]][j,i],4),sep='')
mydum <- paste(mydum,')')
a<-table.element(a,mydum)
}
a<-table.row.end(a)
}
a<-table.end(a)
table.save(a,file='mytable.tab')
a<-table.start()
a<-table.row.start(a)
a<-table.element(a,'Estimated ARIMA Residuals', 1,TRUE)
a<-table.row.end(a)
a<-table.row.start(a)
a<-table.element(a,'Value', 1,TRUE)
a<-table.row.end(a)
for (i in (par4*par5+par3):length(resid)) {
a<-table.row.start(a)
a<-table.element(a,resid[i])
a<-table.row.end(a)
}
a<-table.end(a)
table.save(a,file='mytable1.tab')