Free Statistics

of Irreproducible Research!

Author's title

Author*The author of this computation has been verified*
R Software Modulerwasp_cross.wasp
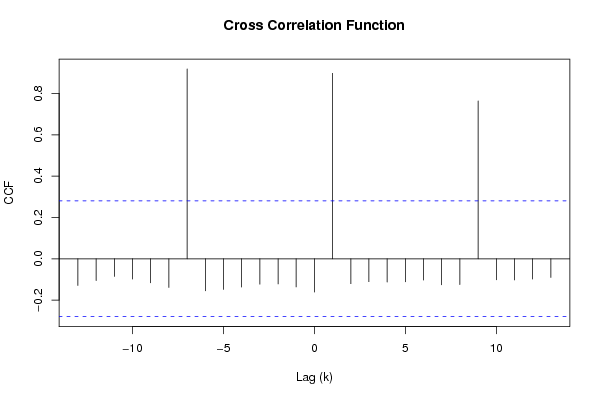
Title produced by softwareCross Correlation Function
Date of computationSat, 20 Dec 2008 11:22:31 -0700
Cite this page as followsStatistical Computations at FreeStatistics.org, Office for Research Development and Education, URL https://freestatistics.org/blog/index.php?v=date/2008/Dec/20/t1229798512b92gbsl512akjcr.htm/, Retrieved Sun, 19 May 2024 08:49:59 +0000
Statistical Computations at FreeStatistics.org, Office for Research Development and Education, URL https://freestatistics.org/blog/index.php?pk=35431, Retrieved Sun, 19 May 2024 08:49:59 +0000
QR Codes:

Original text written by user:
IsPrivate?No (this computation is public)
User-defined keywords
Estimated Impact209
Family? (F = Feedback message, R = changed R code, M = changed R Module, P = changed Parameters, D = changed Data)
-     [Cross Correlation Function] [Cross Correlation...] [2008-12-19 23:18:24] [d32f94eec6fe2d8c421bd223368a5ced]
-    D    [Cross Correlation Function] [Cross Correlatie ...] [2008-12-20 18:22:31] [382e90e66f02be5ed86892bdc1574692] [Current]
Feedback Forum

Post a new message
Dataseries X:
945
74
45
78
98
27
64
20
752
19
85
54
74
63
45
75
782
19
47
59
72
96
66
82
985
54
56
84
89
78
23
45
854
84
54
63
32
54
84
75
843
45
85
63
41
47
86
81
848
Dataseries Y:
89
63
87
22
22
65
88
945
74
45
78
98
27
64
20
752
19
85
54
74
63
45
75
782
19
47
59
72
96
66
82
985
54
56
84
89
78
23
45
854
84
54
63
32
54
84
75
843
45


Summary of computational transaction
Raw Inputview raw input (R code)
Raw Outputview raw output of R engine
Computing time0 seconds
R Server'Gwilym Jenkins' @ 72.249.127.135

\begin{tabular}{lllllllll}
\hline
Summary of computational transaction \tabularnewline
Raw Input & view raw input (R code)  \tabularnewline
Raw Output & view raw output of R engine  \tabularnewline
Computing time & 0 seconds \tabularnewline
R Server & 'Gwilym Jenkins' @ 72.249.127.135 \tabularnewline
\hline
\end{tabular}
%Source: https://freestatistics.org/blog/index.php?pk=35431&T=0

[TABLE]
[ROW][C]Summary of computational transaction[/C][/ROW]
[ROW][C]Raw Input[/C][C]view raw input (R code) [/C][/ROW]
[ROW][C]Raw Output[/C][C]view raw output of R engine [/C][/ROW]
[ROW][C]Computing time[/C][C]0 seconds[/C][/ROW]
[ROW][C]R Server[/C][C]'Gwilym Jenkins' @ 72.249.127.135[/C][/ROW]
[/TABLE]
Source: https://freestatistics.org/blog/index.php?pk=35431&T=0

Globally Unique Identifier (entire table): ba.freestatistics.org/blog/index.php?pk=35431&T=0

As an alternative you can also use a QR Code:  

The GUIDs for individual cells are displayed in the table below:

Summary of computational transaction
Raw Inputview raw input (R code)
Raw Outputview raw output of R engine
Computing time0 seconds
R Server'Gwilym Jenkins' @ 72.249.127.135


Cross Correlation Function
ParameterValue
Box-Cox transformation parameter (lambda) of X series1
Degree of non-seasonal differencing (d) of X series0
Degree of seasonal differencing (D) of X series0
Seasonal Period (s)1
Box-Cox transformation parameter (lambda) of Y series1
Degree of non-seasonal differencing (d) of Y series0
Degree of seasonal differencing (D) of Y series0
krho(Y[t],X[t+k])
-13-0.128877290164436
-12-0.105393620339418
-11-0.0856764117815763
-10-0.0980417114001862
-9-0.116423954155997
-8-0.138863676783525
-70.918575248040305
-6-0.155100366250974
-5-0.148331863564643
-4-0.137092389294557
-3-0.122746908717074
-2-0.121807697888546
-1-0.136053852524404
0-0.160807016457839
10.897417376247966
2-0.120274293569654
3-0.110940638984698
4-0.112857270262620
5-0.111341466498251
6-0.103203508922548
7-0.126178146917997
8-0.124546184479184
90.763657262941798
10-0.102000502342148
11-0.102655300348366
12-0.0978972397149014
13-0.0903225497380424

\begin{tabular}{lllllllll}
\hline
Cross Correlation Function \tabularnewline
Parameter & Value \tabularnewline
Box-Cox transformation parameter (lambda) of X series & 1 \tabularnewline
Degree of non-seasonal differencing (d) of X series & 0 \tabularnewline
Degree of seasonal differencing (D) of X series & 0 \tabularnewline
Seasonal Period (s) & 1 \tabularnewline
Box-Cox transformation parameter (lambda) of Y series & 1 \tabularnewline
Degree of non-seasonal differencing (d) of Y series & 0 \tabularnewline
Degree of seasonal differencing (D) of Y series & 0 \tabularnewline
k & rho(Y[t],X[t+k]) \tabularnewline
-13 & -0.128877290164436 \tabularnewline
-12 & -0.105393620339418 \tabularnewline
-11 & -0.0856764117815763 \tabularnewline
-10 & -0.0980417114001862 \tabularnewline
-9 & -0.116423954155997 \tabularnewline
-8 & -0.138863676783525 \tabularnewline
-7 & 0.918575248040305 \tabularnewline
-6 & -0.155100366250974 \tabularnewline
-5 & -0.148331863564643 \tabularnewline
-4 & -0.137092389294557 \tabularnewline
-3 & -0.122746908717074 \tabularnewline
-2 & -0.121807697888546 \tabularnewline
-1 & -0.136053852524404 \tabularnewline
0 & -0.160807016457839 \tabularnewline
1 & 0.897417376247966 \tabularnewline
2 & -0.120274293569654 \tabularnewline
3 & -0.110940638984698 \tabularnewline
4 & -0.112857270262620 \tabularnewline
5 & -0.111341466498251 \tabularnewline
6 & -0.103203508922548 \tabularnewline
7 & -0.126178146917997 \tabularnewline
8 & -0.124546184479184 \tabularnewline
9 & 0.763657262941798 \tabularnewline
10 & -0.102000502342148 \tabularnewline
11 & -0.102655300348366 \tabularnewline
12 & -0.0978972397149014 \tabularnewline
13 & -0.0903225497380424 \tabularnewline
\hline
\end{tabular}
%Source: https://freestatistics.org/blog/index.php?pk=35431&T=1

[TABLE]
[ROW][C]Cross Correlation Function[/C][/ROW]
[ROW][C]Parameter[/C][C]Value[/C][/ROW]
[ROW][C]Box-Cox transformation parameter (lambda) of X series[/C][C]1[/C][/ROW]
[ROW][C]Degree of non-seasonal differencing (d) of X series[/C][C]0[/C][/ROW]
[ROW][C]Degree of seasonal differencing (D) of X series[/C][C]0[/C][/ROW]
[ROW][C]Seasonal Period (s)[/C][C]1[/C][/ROW]
[ROW][C]Box-Cox transformation parameter (lambda) of Y series[/C][C]1[/C][/ROW]
[ROW][C]Degree of non-seasonal differencing (d) of Y series[/C][C]0[/C][/ROW]
[ROW][C]Degree of seasonal differencing (D) of Y series[/C][C]0[/C][/ROW]
[ROW][C]k[/C][C]rho(Y[t],X[t+k])[/C][/ROW]
[ROW][C]-13[/C][C]-0.128877290164436[/C][/ROW]
[ROW][C]-12[/C][C]-0.105393620339418[/C][/ROW]
[ROW][C]-11[/C][C]-0.0856764117815763[/C][/ROW]
[ROW][C]-10[/C][C]-0.0980417114001862[/C][/ROW]
[ROW][C]-9[/C][C]-0.116423954155997[/C][/ROW]
[ROW][C]-8[/C][C]-0.138863676783525[/C][/ROW]
[ROW][C]-7[/C][C]0.918575248040305[/C][/ROW]
[ROW][C]-6[/C][C]-0.155100366250974[/C][/ROW]
[ROW][C]-5[/C][C]-0.148331863564643[/C][/ROW]
[ROW][C]-4[/C][C]-0.137092389294557[/C][/ROW]
[ROW][C]-3[/C][C]-0.122746908717074[/C][/ROW]
[ROW][C]-2[/C][C]-0.121807697888546[/C][/ROW]
[ROW][C]-1[/C][C]-0.136053852524404[/C][/ROW]
[ROW][C]0[/C][C]-0.160807016457839[/C][/ROW]
[ROW][C]1[/C][C]0.897417376247966[/C][/ROW]
[ROW][C]2[/C][C]-0.120274293569654[/C][/ROW]
[ROW][C]3[/C][C]-0.110940638984698[/C][/ROW]
[ROW][C]4[/C][C]-0.112857270262620[/C][/ROW]
[ROW][C]5[/C][C]-0.111341466498251[/C][/ROW]
[ROW][C]6[/C][C]-0.103203508922548[/C][/ROW]
[ROW][C]7[/C][C]-0.126178146917997[/C][/ROW]
[ROW][C]8[/C][C]-0.124546184479184[/C][/ROW]
[ROW][C]9[/C][C]0.763657262941798[/C][/ROW]
[ROW][C]10[/C][C]-0.102000502342148[/C][/ROW]
[ROW][C]11[/C][C]-0.102655300348366[/C][/ROW]
[ROW][C]12[/C][C]-0.0978972397149014[/C][/ROW]
[ROW][C]13[/C][C]-0.0903225497380424[/C][/ROW]
[/TABLE]
Source: https://freestatistics.org/blog/index.php?pk=35431&T=1

Globally Unique Identifier (entire table): ba.freestatistics.org/blog/index.php?pk=35431&T=1

As an alternative you can also use a QR Code:  

The GUIDs for individual cells are displayed in the table below:

Cross Correlation Function
ParameterValue
Box-Cox transformation parameter (lambda) of X series1
Degree of non-seasonal differencing (d) of X series0
Degree of seasonal differencing (D) of X series0
Seasonal Period (s)1
Box-Cox transformation parameter (lambda) of Y series1
Degree of non-seasonal differencing (d) of Y series0
Degree of seasonal differencing (D) of Y series0
krho(Y[t],X[t+k])
-13-0.128877290164436
-12-0.105393620339418
-11-0.0856764117815763
-10-0.0980417114001862
-9-0.116423954155997
-8-0.138863676783525
-70.918575248040305
-6-0.155100366250974
-5-0.148331863564643
-4-0.137092389294557
-3-0.122746908717074
-2-0.121807697888546
-1-0.136053852524404
0-0.160807016457839
10.897417376247966
2-0.120274293569654
3-0.110940638984698
4-0.112857270262620
5-0.111341466498251
6-0.103203508922548
7-0.126178146917997
8-0.124546184479184
90.763657262941798
10-0.102000502342148
11-0.102655300348366
12-0.0978972397149014
13-0.0903225497380424


Parameters (Session):
par1 = 1 ; par2 = 0 ; par3 = 0 ; par4 = 1 ; par5 = 1 ; par6 = 0 ; par7 = 0 ;
Parameters (R input):
par1 = 1 ; par2 = 0 ; par3 = 0 ; par4 = 1 ; par5 = 1 ; par6 = 0 ; par7 = 0 ;
R code (references can be found in the software module):
par1 <- as.numeric(par1)
par2 <- as.numeric(par2)
par3 <- as.numeric(par3)
par4 <- as.numeric(par4)
par5 <- as.numeric(par5)
par6 <- as.numeric(par6)
par7 <- as.numeric(par7)
if (par1 == 0) {
x <- log(x)
} else {
x <- (x ^ par1 - 1) / par1
}
if (par5 == 0) {
y <- log(y)
} else {
y <- (y ^ par5 - 1) / par5
}
if (par2 > 0) x <- diff(x,lag=1,difference=par2)
if (par6 > 0) y <- diff(y,lag=1,difference=par6)
if (par3 > 0) x <- diff(x,lag=par4,difference=par3)
if (par7 > 0) y <- diff(y,lag=par4,difference=par7)
x
y
bitmap(file='test1.png')
(r <- ccf(x,y,main='Cross Correlation Function',ylab='CCF',xlab='Lag (k)'))
dev.off()
load(file='createtable')
a<-table.start()
a<-table.row.start(a)
a<-table.element(a,'Cross Correlation Function',2,TRUE)
a<-table.row.end(a)
a<-table.row.start(a)
a<-table.element(a,'Parameter',header=TRUE)
a<-table.element(a,'Value',header=TRUE)
a<-table.row.end(a)
a<-table.row.start(a)
a<-table.element(a,'Box-Cox transformation parameter (lambda) of X series',header=TRUE)
a<-table.element(a,par1)
a<-table.row.end(a)
a<-table.row.start(a)
a<-table.element(a,'Degree of non-seasonal differencing (d) of X series',header=TRUE)
a<-table.element(a,par2)
a<-table.row.end(a)
a<-table.row.start(a)
a<-table.element(a,'Degree of seasonal differencing (D) of X series',header=TRUE)
a<-table.element(a,par3)
a<-table.row.end(a)
a<-table.row.start(a)
a<-table.element(a,'Seasonal Period (s)',header=TRUE)
a<-table.element(a,par4)
a<-table.row.end(a)
a<-table.row.start(a)
a<-table.element(a,'Box-Cox transformation parameter (lambda) of Y series',header=TRUE)
a<-table.element(a,par5)
a<-table.row.end(a)
a<-table.row.start(a)
a<-table.element(a,'Degree of non-seasonal differencing (d) of Y series',header=TRUE)
a<-table.element(a,par6)
a<-table.row.end(a)
a<-table.row.start(a)
a<-table.element(a,'Degree of seasonal differencing (D) of Y series',header=TRUE)
a<-table.element(a,par7)
a<-table.row.end(a)
a<-table.row.start(a)
a<-table.element(a,'k',header=TRUE)
a<-table.element(a,'rho(Y[t],X[t+k])',header=TRUE)
a<-table.row.end(a)
mylength <- length(r$acf)
myhalf <- floor((mylength-1)/2)
for (i in 1:mylength) {
a<-table.row.start(a)
a<-table.element(a,i-myhalf-1,header=TRUE)
a<-table.element(a,r$acf[i])
a<-table.row.end(a)
}
a<-table.end(a)
table.save(a,file='mytable.tab')