Free Statistics

of Irreproducible Research!

Author's title

Author*The author of this computation has been verified*
R Software Modulerwasp_arimabackwardselection.wasp
Title produced by softwareARIMA Backward Selection
Date of computationSat, 20 Dec 2008 10:45:13 -0700
Cite this page as followsStatistical Computations at FreeStatistics.org, Office for Research Development and Education, URL https://freestatistics.org/blog/index.php?v=date/2008/Dec/20/t1229795174kly4pu7l5izo2we.htm/, Retrieved Sun, 19 May 2024 09:22:21 +0000
Statistical Computations at FreeStatistics.org, Office for Research Development and Education, URL https://freestatistics.org/blog/index.php?pk=35427, Retrieved Sun, 19 May 2024 09:22:21 +0000
QR Codes:

Original text written by user:
IsPrivate?No (this computation is public)
User-defined keywords
Estimated Impact188
Family? (F = Feedback message, R = changed R code, M = changed R Module, P = changed Parameters, D = changed Data)
-       [ARIMA Backward Selection] [arima backward sl...] [2008-12-20 17:45:13] [00a0a665d7a07edd2e460056b0c0c354] [Current]
Feedback Forum

Post a new message
Dataseries X:
2175
2197
2350
2440
2409
2473
2408
2455
2448
2498
2646
2757
2849
2921
2982
3081
3106
3119
3061
3097
3162
3257
3277
3295
3364
3494
3667
3813
3918
3896
3801
3570
3702
3862
3970
4139
4200
4291
4444
4503
4357
4591
4697
4621
4563
4203
4296
4435
4105
4117
3844
3721
3674
3858
3801
3504
3033
3047
2962
2198
2014


Summary of computational transaction
Raw Inputview raw input (R code)
Raw Outputview raw output of R engine
Computing time8 seconds
R Server'George Udny Yule' @ 72.249.76.132

\begin{tabular}{lllllllll}
\hline
Summary of computational transaction \tabularnewline
Raw Input & view raw input (R code)  \tabularnewline
Raw Output & view raw output of R engine  \tabularnewline
Computing time & 8 seconds \tabularnewline
R Server & 'George Udny Yule' @ 72.249.76.132 \tabularnewline
\hline
\end{tabular}
%Source: https://freestatistics.org/blog/index.php?pk=35427&T=0

[TABLE]
[ROW][C]Summary of computational transaction[/C][/ROW]
[ROW][C]Raw Input[/C][C]view raw input (R code) [/C][/ROW]
[ROW][C]Raw Output[/C][C]view raw output of R engine [/C][/ROW]
[ROW][C]Computing time[/C][C]8 seconds[/C][/ROW]
[ROW][C]R Server[/C][C]'George Udny Yule' @ 72.249.76.132[/C][/ROW]
[/TABLE]
Source: https://freestatistics.org/blog/index.php?pk=35427&T=0

Globally Unique Identifier (entire table): ba.freestatistics.org/blog/index.php?pk=35427&T=0

As an alternative you can also use a QR Code:  

The GUIDs for individual cells are displayed in the table below:

Summary of computational transaction
Raw Inputview raw input (R code)
Raw Outputview raw output of R engine
Computing time8 seconds
R Server'George Udny Yule' @ 72.249.76.132


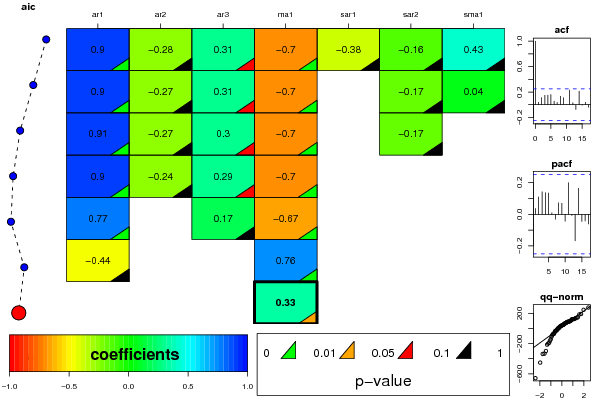
ARIMA Parameter Estimation and Backward Selection
Iterationar1ar2ar3ma1sar1sar2sma1
Estimates ( 1 )0.9048-0.27550.3135-0.7012-0.3773-0.15530.4292
(p-val)(0 )(0.1563 )(0.0602 )(4e-04 )(0.744 )(0.446 )(0.7191 )
Estimates ( 2 )0.9033-0.27470.3148-0.70010-0.17180.0411
(p-val)(0 )(0.157 )(0.0595 )(4e-04 )(NA )(0.318 )(0.8325 )
Estimates ( 3 )0.9081-0.26870.3046-0.69770-0.16960
(p-val)(0 )(0.1621 )(0.0582 )(5e-04 )(NA )(0.3244 )(NA )
Estimates ( 4 )0.8955-0.24190.2916-0.6981000
(p-val)(0 )(0.2034 )(0.0711 )(4e-04 )(NA )(NA )(NA )
Estimates ( 5 )0.774200.1702-0.6732000
(p-val)(2e-04 )(NA )(0.2508 )(0.0045 )(NA )(NA )(NA )
Estimates ( 6 )-0.4436000.7577000
(p-val)(0.1176 )(NA )(NA )(6e-04 )(NA )(NA )(NA )
Estimates ( 7 )0000.3341000
(p-val)(NA )(NA )(NA )(0.0228 )(NA )(NA )(NA )
Estimates ( 8 )NANANANANANANA
(p-val)(NA )(NA )(NA )(NA )(NA )(NA )(NA )
Estimates ( 9 )NANANANANANANA
(p-val)(NA )(NA )(NA )(NA )(NA )(NA )(NA )
Estimates ( 10 )NANANANANANANA
(p-val)(NA )(NA )(NA )(NA )(NA )(NA )(NA )
Estimates ( 11 )NANANANANANANA
(p-val)(NA )(NA )(NA )(NA )(NA )(NA )(NA )
Estimates ( 12 )NANANANANANANA
(p-val)(NA )(NA )(NA )(NA )(NA )(NA )(NA )
Estimates ( 13 )NANANANANANANA
(p-val)(NA )(NA )(NA )(NA )(NA )(NA )(NA )

\begin{tabular}{lllllllll}
\hline
ARIMA Parameter Estimation and Backward Selection \tabularnewline
Iteration & ar1 & ar2 & ar3 & ma1 & sar1 & sar2 & sma1 \tabularnewline
Estimates ( 1 ) & 0.9048 & -0.2755 & 0.3135 & -0.7012 & -0.3773 & -0.1553 & 0.4292 \tabularnewline
(p-val) & (0 ) & (0.1563 ) & (0.0602 ) & (4e-04 ) & (0.744 ) & (0.446 ) & (0.7191 ) \tabularnewline
Estimates ( 2 ) & 0.9033 & -0.2747 & 0.3148 & -0.7001 & 0 & -0.1718 & 0.0411 \tabularnewline
(p-val) & (0 ) & (0.157 ) & (0.0595 ) & (4e-04 ) & (NA ) & (0.318 ) & (0.8325 ) \tabularnewline
Estimates ( 3 ) & 0.9081 & -0.2687 & 0.3046 & -0.6977 & 0 & -0.1696 & 0 \tabularnewline
(p-val) & (0 ) & (0.1621 ) & (0.0582 ) & (5e-04 ) & (NA ) & (0.3244 ) & (NA ) \tabularnewline
Estimates ( 4 ) & 0.8955 & -0.2419 & 0.2916 & -0.6981 & 0 & 0 & 0 \tabularnewline
(p-val) & (0 ) & (0.2034 ) & (0.0711 ) & (4e-04 ) & (NA ) & (NA ) & (NA ) \tabularnewline
Estimates ( 5 ) & 0.7742 & 0 & 0.1702 & -0.6732 & 0 & 0 & 0 \tabularnewline
(p-val) & (2e-04 ) & (NA ) & (0.2508 ) & (0.0045 ) & (NA ) & (NA ) & (NA ) \tabularnewline
Estimates ( 6 ) & -0.4436 & 0 & 0 & 0.7577 & 0 & 0 & 0 \tabularnewline
(p-val) & (0.1176 ) & (NA ) & (NA ) & (6e-04 ) & (NA ) & (NA ) & (NA ) \tabularnewline
Estimates ( 7 ) & 0 & 0 & 0 & 0.3341 & 0 & 0 & 0 \tabularnewline
(p-val) & (NA ) & (NA ) & (NA ) & (0.0228 ) & (NA ) & (NA ) & (NA ) \tabularnewline
Estimates ( 8 ) & NA & NA & NA & NA & NA & NA & NA \tabularnewline
(p-val) & (NA ) & (NA ) & (NA ) & (NA ) & (NA ) & (NA ) & (NA ) \tabularnewline
Estimates ( 9 ) & NA & NA & NA & NA & NA & NA & NA \tabularnewline
(p-val) & (NA ) & (NA ) & (NA ) & (NA ) & (NA ) & (NA ) & (NA ) \tabularnewline
Estimates ( 10 ) & NA & NA & NA & NA & NA & NA & NA \tabularnewline
(p-val) & (NA ) & (NA ) & (NA ) & (NA ) & (NA ) & (NA ) & (NA ) \tabularnewline
Estimates ( 11 ) & NA & NA & NA & NA & NA & NA & NA \tabularnewline
(p-val) & (NA ) & (NA ) & (NA ) & (NA ) & (NA ) & (NA ) & (NA ) \tabularnewline
Estimates ( 12 ) & NA & NA & NA & NA & NA & NA & NA \tabularnewline
(p-val) & (NA ) & (NA ) & (NA ) & (NA ) & (NA ) & (NA ) & (NA ) \tabularnewline
Estimates ( 13 ) & NA & NA & NA & NA & NA & NA & NA \tabularnewline
(p-val) & (NA ) & (NA ) & (NA ) & (NA ) & (NA ) & (NA ) & (NA ) \tabularnewline
\hline
\end{tabular}
%Source: https://freestatistics.org/blog/index.php?pk=35427&T=1

[TABLE]
[ROW][C]ARIMA Parameter Estimation and Backward Selection[/C][/ROW]
[ROW][C]Iteration[/C][C]ar1[/C][C]ar2[/C][C]ar3[/C][C]ma1[/C][C]sar1[/C][C]sar2[/C][C]sma1[/C][/ROW]
[ROW][C]Estimates ( 1 )[/C][C]0.9048[/C][C]-0.2755[/C][C]0.3135[/C][C]-0.7012[/C][C]-0.3773[/C][C]-0.1553[/C][C]0.4292[/C][/ROW]
[ROW][C](p-val)[/C][C](0 )[/C][C](0.1563 )[/C][C](0.0602 )[/C][C](4e-04 )[/C][C](0.744 )[/C][C](0.446 )[/C][C](0.7191 )[/C][/ROW]
[ROW][C]Estimates ( 2 )[/C][C]0.9033[/C][C]-0.2747[/C][C]0.3148[/C][C]-0.7001[/C][C]0[/C][C]-0.1718[/C][C]0.0411[/C][/ROW]
[ROW][C](p-val)[/C][C](0 )[/C][C](0.157 )[/C][C](0.0595 )[/C][C](4e-04 )[/C][C](NA )[/C][C](0.318 )[/C][C](0.8325 )[/C][/ROW]
[ROW][C]Estimates ( 3 )[/C][C]0.9081[/C][C]-0.2687[/C][C]0.3046[/C][C]-0.6977[/C][C]0[/C][C]-0.1696[/C][C]0[/C][/ROW]
[ROW][C](p-val)[/C][C](0 )[/C][C](0.1621 )[/C][C](0.0582 )[/C][C](5e-04 )[/C][C](NA )[/C][C](0.3244 )[/C][C](NA )[/C][/ROW]
[ROW][C]Estimates ( 4 )[/C][C]0.8955[/C][C]-0.2419[/C][C]0.2916[/C][C]-0.6981[/C][C]0[/C][C]0[/C][C]0[/C][/ROW]
[ROW][C](p-val)[/C][C](0 )[/C][C](0.2034 )[/C][C](0.0711 )[/C][C](4e-04 )[/C][C](NA )[/C][C](NA )[/C][C](NA )[/C][/ROW]
[ROW][C]Estimates ( 5 )[/C][C]0.7742[/C][C]0[/C][C]0.1702[/C][C]-0.6732[/C][C]0[/C][C]0[/C][C]0[/C][/ROW]
[ROW][C](p-val)[/C][C](2e-04 )[/C][C](NA )[/C][C](0.2508 )[/C][C](0.0045 )[/C][C](NA )[/C][C](NA )[/C][C](NA )[/C][/ROW]
[ROW][C]Estimates ( 6 )[/C][C]-0.4436[/C][C]0[/C][C]0[/C][C]0.7577[/C][C]0[/C][C]0[/C][C]0[/C][/ROW]
[ROW][C](p-val)[/C][C](0.1176 )[/C][C](NA )[/C][C](NA )[/C][C](6e-04 )[/C][C](NA )[/C][C](NA )[/C][C](NA )[/C][/ROW]
[ROW][C]Estimates ( 7 )[/C][C]0[/C][C]0[/C][C]0[/C][C]0.3341[/C][C]0[/C][C]0[/C][C]0[/C][/ROW]
[ROW][C](p-val)[/C][C](NA )[/C][C](NA )[/C][C](NA )[/C][C](0.0228 )[/C][C](NA )[/C][C](NA )[/C][C](NA )[/C][/ROW]
[ROW][C]Estimates ( 8 )[/C][C]NA[/C][C]NA[/C][C]NA[/C][C]NA[/C][C]NA[/C][C]NA[/C][C]NA[/C][/ROW]
[ROW][C](p-val)[/C][C](NA )[/C][C](NA )[/C][C](NA )[/C][C](NA )[/C][C](NA )[/C][C](NA )[/C][C](NA )[/C][/ROW]
[ROW][C]Estimates ( 9 )[/C][C]NA[/C][C]NA[/C][C]NA[/C][C]NA[/C][C]NA[/C][C]NA[/C][C]NA[/C][/ROW]
[ROW][C](p-val)[/C][C](NA )[/C][C](NA )[/C][C](NA )[/C][C](NA )[/C][C](NA )[/C][C](NA )[/C][C](NA )[/C][/ROW]
[ROW][C]Estimates ( 10 )[/C][C]NA[/C][C]NA[/C][C]NA[/C][C]NA[/C][C]NA[/C][C]NA[/C][C]NA[/C][/ROW]
[ROW][C](p-val)[/C][C](NA )[/C][C](NA )[/C][C](NA )[/C][C](NA )[/C][C](NA )[/C][C](NA )[/C][C](NA )[/C][/ROW]
[ROW][C]Estimates ( 11 )[/C][C]NA[/C][C]NA[/C][C]NA[/C][C]NA[/C][C]NA[/C][C]NA[/C][C]NA[/C][/ROW]
[ROW][C](p-val)[/C][C](NA )[/C][C](NA )[/C][C](NA )[/C][C](NA )[/C][C](NA )[/C][C](NA )[/C][C](NA )[/C][/ROW]
[ROW][C]Estimates ( 12 )[/C][C]NA[/C][C]NA[/C][C]NA[/C][C]NA[/C][C]NA[/C][C]NA[/C][C]NA[/C][/ROW]
[ROW][C](p-val)[/C][C](NA )[/C][C](NA )[/C][C](NA )[/C][C](NA )[/C][C](NA )[/C][C](NA )[/C][C](NA )[/C][/ROW]
[ROW][C]Estimates ( 13 )[/C][C]NA[/C][C]NA[/C][C]NA[/C][C]NA[/C][C]NA[/C][C]NA[/C][C]NA[/C][/ROW]
[ROW][C](p-val)[/C][C](NA )[/C][C](NA )[/C][C](NA )[/C][C](NA )[/C][C](NA )[/C][C](NA )[/C][C](NA )[/C][/ROW]
[/TABLE]
Source: https://freestatistics.org/blog/index.php?pk=35427&T=1

Globally Unique Identifier (entire table): ba.freestatistics.org/blog/index.php?pk=35427&T=1

As an alternative you can also use a QR Code:  

The GUIDs for individual cells are displayed in the table below:

ARIMA Parameter Estimation and Backward Selection
Iterationar1ar2ar3ma1sar1sar2sma1
Estimates ( 1 )0.9048-0.27550.3135-0.7012-0.3773-0.15530.4292
(p-val)(0 )(0.1563 )(0.0602 )(4e-04 )(0.744 )(0.446 )(0.7191 )
Estimates ( 2 )0.9033-0.27470.3148-0.70010-0.17180.0411
(p-val)(0 )(0.157 )(0.0595 )(4e-04 )(NA )(0.318 )(0.8325 )
Estimates ( 3 )0.9081-0.26870.3046-0.69770-0.16960
(p-val)(0 )(0.1621 )(0.0582 )(5e-04 )(NA )(0.3244 )(NA )
Estimates ( 4 )0.8955-0.24190.2916-0.6981000
(p-val)(0 )(0.2034 )(0.0711 )(4e-04 )(NA )(NA )(NA )
Estimates ( 5 )0.774200.1702-0.6732000
(p-val)(2e-04 )(NA )(0.2508 )(0.0045 )(NA )(NA )(NA )
Estimates ( 6 )-0.4436000.7577000
(p-val)(0.1176 )(NA )(NA )(6e-04 )(NA )(NA )(NA )
Estimates ( 7 )0000.3341000
(p-val)(NA )(NA )(NA )(0.0228 )(NA )(NA )(NA )
Estimates ( 8 )NANANANANANANA
(p-val)(NA )(NA )(NA )(NA )(NA )(NA )(NA )
Estimates ( 9 )NANANANANANANA
(p-val)(NA )(NA )(NA )(NA )(NA )(NA )(NA )
Estimates ( 10 )NANANANANANANA
(p-val)(NA )(NA )(NA )(NA )(NA )(NA )(NA )
Estimates ( 11 )NANANANANANANA
(p-val)(NA )(NA )(NA )(NA )(NA )(NA )(NA )
Estimates ( 12 )NANANANANANANA
(p-val)(NA )(NA )(NA )(NA )(NA )(NA )(NA )
Estimates ( 13 )NANANANANANANA
(p-val)(NA )(NA )(NA )(NA )(NA )(NA )(NA )


Estimated ARIMA Residuals
Value
2.17499877892679
20.7613287429416
143.477139054923
51.550919437317
-29.2177302789442
71.8013112712948
-90.4548261358621
86.3490147805617
-51.4135633630283
85.7628792394493
105.201046021195
96.9479632373165
67.7877660110607
61.4490903957084
46.3798992142356
90.9163143038521
0.0299510096508692
24.0662874104509
-70.4675262005372
63.6638787562856
32.73230971288
99.0314828086558
-12.8942452949580
36.640862536067
49.2225529545407
123.311642875257
137.234179476688
118.758832690581
79.7807497353739
-35.8729734711834
-77.5786206298365
-214.359853014296
191.950057785608
73.1161445581198
123.572694011350
123.277945213868
42.558767887087
85.8120628023162
128.347371170270
29.6207741064172
-142.272357977538
277.034708915988
-0.106126068875047
-28.9016394379997
-69.8131226796459
-332.83159983371
185.4924090016
39.7098436044016
-298.43128123995
91.7353386894348
-337.182189749714
11.3789199895604
-110.180016435425
246.632345604535
-162.249492287182
-199.351908411466
-451.696317097448
147.316681343185
-190.407291291330
-657.437467401655
-24.764446063954

\begin{tabular}{lllllllll}
\hline
Estimated ARIMA Residuals \tabularnewline
Value \tabularnewline
2.17499877892679 \tabularnewline
20.7613287429416 \tabularnewline
143.477139054923 \tabularnewline
51.550919437317 \tabularnewline
-29.2177302789442 \tabularnewline
71.8013112712948 \tabularnewline
-90.4548261358621 \tabularnewline
86.3490147805617 \tabularnewline
-51.4135633630283 \tabularnewline
85.7628792394493 \tabularnewline
105.201046021195 \tabularnewline
96.9479632373165 \tabularnewline
67.7877660110607 \tabularnewline
61.4490903957084 \tabularnewline
46.3798992142356 \tabularnewline
90.9163143038521 \tabularnewline
0.0299510096508692 \tabularnewline
24.0662874104509 \tabularnewline
-70.4675262005372 \tabularnewline
63.6638787562856 \tabularnewline
32.73230971288 \tabularnewline
99.0314828086558 \tabularnewline
-12.8942452949580 \tabularnewline
36.640862536067 \tabularnewline
49.2225529545407 \tabularnewline
123.311642875257 \tabularnewline
137.234179476688 \tabularnewline
118.758832690581 \tabularnewline
79.7807497353739 \tabularnewline
-35.8729734711834 \tabularnewline
-77.5786206298365 \tabularnewline
-214.359853014296 \tabularnewline
191.950057785608 \tabularnewline
73.1161445581198 \tabularnewline
123.572694011350 \tabularnewline
123.277945213868 \tabularnewline
42.558767887087 \tabularnewline
85.8120628023162 \tabularnewline
128.347371170270 \tabularnewline
29.6207741064172 \tabularnewline
-142.272357977538 \tabularnewline
277.034708915988 \tabularnewline
-0.106126068875047 \tabularnewline
-28.9016394379997 \tabularnewline
-69.8131226796459 \tabularnewline
-332.83159983371 \tabularnewline
185.4924090016 \tabularnewline
39.7098436044016 \tabularnewline
-298.43128123995 \tabularnewline
91.7353386894348 \tabularnewline
-337.182189749714 \tabularnewline
11.3789199895604 \tabularnewline
-110.180016435425 \tabularnewline
246.632345604535 \tabularnewline
-162.249492287182 \tabularnewline
-199.351908411466 \tabularnewline
-451.696317097448 \tabularnewline
147.316681343185 \tabularnewline
-190.407291291330 \tabularnewline
-657.437467401655 \tabularnewline
-24.764446063954 \tabularnewline
\hline
\end{tabular}
%Source: https://freestatistics.org/blog/index.php?pk=35427&T=2

[TABLE]
[ROW][C]Estimated ARIMA Residuals[/C][/ROW]
[ROW][C]Value[/C][/ROW]
[ROW][C]2.17499877892679[/C][/ROW]
[ROW][C]20.7613287429416[/C][/ROW]
[ROW][C]143.477139054923[/C][/ROW]
[ROW][C]51.550919437317[/C][/ROW]
[ROW][C]-29.2177302789442[/C][/ROW]
[ROW][C]71.8013112712948[/C][/ROW]
[ROW][C]-90.4548261358621[/C][/ROW]
[ROW][C]86.3490147805617[/C][/ROW]
[ROW][C]-51.4135633630283[/C][/ROW]
[ROW][C]85.7628792394493[/C][/ROW]
[ROW][C]105.201046021195[/C][/ROW]
[ROW][C]96.9479632373165[/C][/ROW]
[ROW][C]67.7877660110607[/C][/ROW]
[ROW][C]61.4490903957084[/C][/ROW]
[ROW][C]46.3798992142356[/C][/ROW]
[ROW][C]90.9163143038521[/C][/ROW]
[ROW][C]0.0299510096508692[/C][/ROW]
[ROW][C]24.0662874104509[/C][/ROW]
[ROW][C]-70.4675262005372[/C][/ROW]
[ROW][C]63.6638787562856[/C][/ROW]
[ROW][C]32.73230971288[/C][/ROW]
[ROW][C]99.0314828086558[/C][/ROW]
[ROW][C]-12.8942452949580[/C][/ROW]
[ROW][C]36.640862536067[/C][/ROW]
[ROW][C]49.2225529545407[/C][/ROW]
[ROW][C]123.311642875257[/C][/ROW]
[ROW][C]137.234179476688[/C][/ROW]
[ROW][C]118.758832690581[/C][/ROW]
[ROW][C]79.7807497353739[/C][/ROW]
[ROW][C]-35.8729734711834[/C][/ROW]
[ROW][C]-77.5786206298365[/C][/ROW]
[ROW][C]-214.359853014296[/C][/ROW]
[ROW][C]191.950057785608[/C][/ROW]
[ROW][C]73.1161445581198[/C][/ROW]
[ROW][C]123.572694011350[/C][/ROW]
[ROW][C]123.277945213868[/C][/ROW]
[ROW][C]42.558767887087[/C][/ROW]
[ROW][C]85.8120628023162[/C][/ROW]
[ROW][C]128.347371170270[/C][/ROW]
[ROW][C]29.6207741064172[/C][/ROW]
[ROW][C]-142.272357977538[/C][/ROW]
[ROW][C]277.034708915988[/C][/ROW]
[ROW][C]-0.106126068875047[/C][/ROW]
[ROW][C]-28.9016394379997[/C][/ROW]
[ROW][C]-69.8131226796459[/C][/ROW]
[ROW][C]-332.83159983371[/C][/ROW]
[ROW][C]185.4924090016[/C][/ROW]
[ROW][C]39.7098436044016[/C][/ROW]
[ROW][C]-298.43128123995[/C][/ROW]
[ROW][C]91.7353386894348[/C][/ROW]
[ROW][C]-337.182189749714[/C][/ROW]
[ROW][C]11.3789199895604[/C][/ROW]
[ROW][C]-110.180016435425[/C][/ROW]
[ROW][C]246.632345604535[/C][/ROW]
[ROW][C]-162.249492287182[/C][/ROW]
[ROW][C]-199.351908411466[/C][/ROW]
[ROW][C]-451.696317097448[/C][/ROW]
[ROW][C]147.316681343185[/C][/ROW]
[ROW][C]-190.407291291330[/C][/ROW]
[ROW][C]-657.437467401655[/C][/ROW]
[ROW][C]-24.764446063954[/C][/ROW]
[/TABLE]
Source: https://freestatistics.org/blog/index.php?pk=35427&T=2

Globally Unique Identifier (entire table): ba.freestatistics.org/blog/index.php?pk=35427&T=2

As an alternative you can also use a QR Code:  

The GUIDs for individual cells are displayed in the table below:

Estimated ARIMA Residuals
Value
2.17499877892679
20.7613287429416
143.477139054923
51.550919437317
-29.2177302789442
71.8013112712948
-90.4548261358621
86.3490147805617
-51.4135633630283
85.7628792394493
105.201046021195
96.9479632373165
67.7877660110607
61.4490903957084
46.3798992142356
90.9163143038521
0.0299510096508692
24.0662874104509
-70.4675262005372
63.6638787562856
32.73230971288
99.0314828086558
-12.8942452949580
36.640862536067
49.2225529545407
123.311642875257
137.234179476688
118.758832690581
79.7807497353739
-35.8729734711834
-77.5786206298365
-214.359853014296
191.950057785608
73.1161445581198
123.572694011350
123.277945213868
42.558767887087
85.8120628023162
128.347371170270
29.6207741064172
-142.272357977538
277.034708915988
-0.106126068875047
-28.9016394379997
-69.8131226796459
-332.83159983371
185.4924090016
39.7098436044016
-298.43128123995
91.7353386894348
-337.182189749714
11.3789199895604
-110.180016435425
246.632345604535
-162.249492287182
-199.351908411466
-451.696317097448
147.316681343185
-190.407291291330
-657.437467401655
-24.764446063954


Parameters (Session):
par1 = FALSE ; par2 = 1 ; par3 = 1 ; par4 = 0 ; par5 = 12 ; par6 = 3 ; par7 = 1 ; par8 = 2 ; par9 = 1 ;
Parameters (R input):
par1 = FALSE ; par2 = 1 ; par3 = 1 ; par4 = 0 ; par5 = 12 ; par6 = 3 ; par7 = 1 ; par8 = 2 ; par9 = 1 ;
R code (references can be found in the software module):
library(lattice)
if (par1 == 'TRUE') par1 <- TRUE
if (par1 == 'FALSE') par1 <- FALSE
par2 <- as.numeric(par2) #Box-Cox lambda transformation parameter
par3 <- as.numeric(par3) #degree of non-seasonal differencing
par4 <- as.numeric(par4) #degree of seasonal differencing
par5 <- as.numeric(par5) #seasonal period
par6 <- as.numeric(par6) #degree (p) of the non-seasonal AR(p) polynomial
par7 <- as.numeric(par7) #degree (q) of the non-seasonal MA(q) polynomial
par8 <- as.numeric(par8) #degree (P) of the seasonal AR(P) polynomial
par9 <- as.numeric(par9) #degree (Q) of the seasonal MA(Q) polynomial
armaGR <- function(arima.out, names, n){
try1 <- arima.out$coef
try2 <- sqrt(diag(arima.out$var.coef))
try.data.frame <- data.frame(matrix(NA,ncol=4,nrow=length(names)))
dimnames(try.data.frame) <- list(names,c('coef','std','tstat','pv'))
try.data.frame[,1] <- try1
for(i in 1:length(try2)) try.data.frame[which(rownames(try.data.frame)==names(try2)[i]),2] <- try2[i]
try.data.frame[,3] <- try.data.frame[,1] / try.data.frame[,2]
try.data.frame[,4] <- round((1-pt(abs(try.data.frame[,3]),df=n-(length(try2)+1)))*2,5)
vector <- rep(NA,length(names))
vector[is.na(try.data.frame[,4])] <- 0
maxi <- which.max(try.data.frame[,4])
continue <- max(try.data.frame[,4],na.rm=TRUE) > .05
vector[maxi] <- 0
list(summary=try.data.frame,next.vector=vector,continue=continue)
}
arimaSelect <- function(series, order=c(13,0,0), seasonal=list(order=c(2,0,0),period=12), include.mean=F){
nrc <- order[1]+order[3]+seasonal$order[1]+seasonal$order[3]
coeff <- matrix(NA, nrow=nrc*2, ncol=nrc)
pval <- matrix(NA, nrow=nrc*2, ncol=nrc)
mylist <- rep(list(NULL), nrc)
names <- NULL
if(order[1] > 0) names <- paste('ar',1:order[1],sep='')
if(order[3] > 0) names <- c( names , paste('ma',1:order[3],sep='') )
if(seasonal$order[1] > 0) names <- c(names, paste('sar',1:seasonal$order[1],sep=''))
if(seasonal$order[3] > 0) names <- c(names, paste('sma',1:seasonal$order[3],sep=''))
arima.out <- arima(series, order=order, seasonal=seasonal, include.mean=include.mean, method='ML')
mylist[[1]] <- arima.out
last.arma <- armaGR(arima.out, names, length(series))
mystop <- FALSE
i <- 1
coeff[i,] <- last.arma[[1]][,1]
pval [i,] <- last.arma[[1]][,4]
i <- 2
aic <- arima.out$aic
while(!mystop){
mylist[[i]] <- arima.out
arima.out <- arima(series, order=order, seasonal=seasonal, include.mean=include.mean, method='ML', fixed=last.arma$next.vector)
aic <- c(aic, arima.out$aic)
last.arma <- armaGR(arima.out, names, length(series))
mystop <- !last.arma$continue
coeff[i,] <- last.arma[[1]][,1]
pval [i,] <- last.arma[[1]][,4]
i <- i+1
}
list(coeff, pval, mylist, aic=aic)
}
arimaSelectplot <- function(arimaSelect.out,noms,choix){
noms <- names(arimaSelect.out[[3]][[1]]$coef)
coeff <- arimaSelect.out[[1]]
k <- min(which(is.na(coeff[,1])))-1
coeff <- coeff[1:k,]
pval <- arimaSelect.out[[2]][1:k,]
aic <- arimaSelect.out$aic[1:k]
coeff[coeff==0] <- NA
n <- ncol(coeff)
if(missing(choix)) choix <- k
layout(matrix(c(1,1,1,2,
3,3,3,2,
3,3,3,4,
5,6,7,7),nr=4),
widths=c(10,35,45,15),
heights=c(30,30,15,15))
couleurs <- rainbow(75)[1:50]#(50)
ticks <- pretty(coeff)
par(mar=c(1,1,3,1))
plot(aic,k:1-.5,type='o',pch=21,bg='blue',cex=2,axes=F,lty=2,xpd=NA)
points(aic[choix],k-choix+.5,pch=21,cex=4,bg=2,xpd=NA)
title('aic',line=2)
par(mar=c(3,0,0,0))
plot(0,axes=F,xlab='',ylab='',xlim=range(ticks),ylim=c(.1,1))
rect(xleft = min(ticks) + (0:49)/50*(max(ticks)-min(ticks)),
xright = min(ticks) + (1:50)/50*(max(ticks)-min(ticks)),
ytop = rep(1,50),
ybottom= rep(0,50),col=couleurs,border=NA)
axis(1,ticks)
rect(xleft=min(ticks),xright=max(ticks),ytop=1,ybottom=0)
text(mean(coeff,na.rm=T),.5,'coefficients',cex=2,font=2)
par(mar=c(1,1,3,1))
image(1:n,1:k,t(coeff[k:1,]),axes=F,col=couleurs,zlim=range(ticks))
for(i in 1:n) for(j in 1:k) if(!is.na(coeff[j,i])) {
if(pval[j,i]<.01) symb = 'green'
else if( (pval[j,i]<.05) & (pval[j,i]>=.01)) symb = 'orange'
else if( (pval[j,i]<.1) & (pval[j,i]>=.05)) symb = 'red'
else symb = 'black'
polygon(c(i+.5 ,i+.2 ,i+.5 ,i+.5),
c(k-j+0.5,k-j+0.5,k-j+0.8,k-j+0.5),
col=symb)
if(j==choix) {
rect(xleft=i-.5,
xright=i+.5,
ybottom=k-j+1.5,
ytop=k-j+.5,
lwd=4)
text(i,
k-j+1,
round(coeff[j,i],2),
cex=1.2,
font=2)
}
else{
rect(xleft=i-.5,xright=i+.5,ybottom=k-j+1.5,ytop=k-j+.5)
text(i,k-j+1,round(coeff[j,i],2),cex=1.2,font=1)
}
}
axis(3,1:n,noms)
par(mar=c(0.5,0,0,0.5))
plot(0,axes=F,xlab='',ylab='',type='n',xlim=c(0,8),ylim=c(-.2,.8))
cols <- c('green','orange','red','black')
niv <- c('0','0.01','0.05','0.1')
for(i in 0:3){
polygon(c(1+2*i ,1+2*i ,1+2*i-.5 ,1+2*i),
c(.4 ,.7 , .4 , .4),
col=cols[i+1])
text(2*i,0.5,niv[i+1],cex=1.5)
}
text(8,.5,1,cex=1.5)
text(4,0,'p-value',cex=2)
box()
residus <- arimaSelect.out[[3]][[choix]]$res
par(mar=c(1,2,4,1))
acf(residus,main='')
title('acf',line=.5)
par(mar=c(1,2,4,1))
pacf(residus,main='')
title('pacf',line=.5)
par(mar=c(2,2,4,1))
qqnorm(residus,main='')
title('qq-norm',line=.5)
qqline(residus)
residus
}
if (par2 == 0) x <- log(x)
if (par2 != 0) x <- x^par2
(selection <- arimaSelect(x, order=c(par6,par3,par7), seasonal=list(order=c(par8,par4,par9), period=par5)))
bitmap(file='test1.png')
resid <- arimaSelectplot(selection)
dev.off()
resid
bitmap(file='test2.png')
acf(resid,length(resid)/2, main='Residual Autocorrelation Function')
dev.off()
bitmap(file='test3.png')
pacf(resid,length(resid)/2, main='Residual Partial Autocorrelation Function')
dev.off()
bitmap(file='test4.png')
cpgram(resid, main='Residual Cumulative Periodogram')
dev.off()
bitmap(file='test5.png')
hist(resid, main='Residual Histogram', xlab='values of Residuals')
dev.off()
bitmap(file='test6.png')
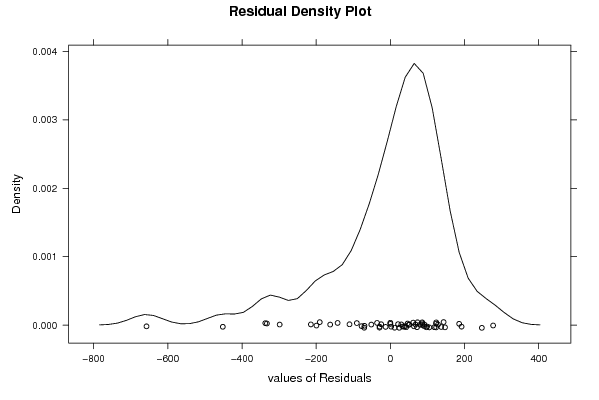
densityplot(~resid,col='black',main='Residual Density Plot', xlab='values of Residuals')
dev.off()
bitmap(file='test7.png')
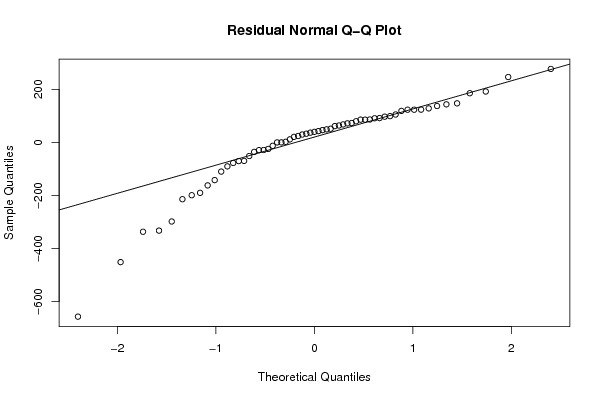
qqnorm(resid, main='Residual Normal Q-Q Plot')
qqline(resid)
dev.off()
ncols <- length(selection[[1]][1,])
nrows <- length(selection[[2]][,1])-1
load(file='createtable')
a<-table.start()
a<-table.row.start(a)
a<-table.element(a,'ARIMA Parameter Estimation and Backward Selection', ncols+1,TRUE)
a<-table.row.end(a)
a<-table.row.start(a)
a<-table.element(a,'Iteration', header=TRUE)
for (i in 1:ncols) {
a<-table.element(a,names(selection[[3]][[1]]$coef)[i],header=TRUE)
}
a<-table.row.end(a)
for (j in 1:nrows) {
a<-table.row.start(a)
mydum <- 'Estimates ('
mydum <- paste(mydum,j)
mydum <- paste(mydum,')')
a<-table.element(a,mydum, header=TRUE)
for (i in 1:ncols) {
a<-table.element(a,round(selection[[1]][j,i],4))
}
a<-table.row.end(a)
a<-table.row.start(a)
a<-table.element(a,'(p-val)', header=TRUE)
for (i in 1:ncols) {
mydum <- '('
mydum <- paste(mydum,round(selection[[2]][j,i],4),sep='')
mydum <- paste(mydum,')')
a<-table.element(a,mydum)
}
a<-table.row.end(a)
}
a<-table.end(a)
table.save(a,file='mytable.tab')
a<-table.start()
a<-table.row.start(a)
a<-table.element(a,'Estimated ARIMA Residuals', 1,TRUE)
a<-table.row.end(a)
a<-table.row.start(a)
a<-table.element(a,'Value', 1,TRUE)
a<-table.row.end(a)
for (i in (par4*par5+par3):length(resid)) {
a<-table.row.start(a)
a<-table.element(a,resid[i])
a<-table.row.end(a)
}
a<-table.end(a)
table.save(a,file='mytable1.tab')