Free Statistics

of Irreproducible Research!

Author's title

Author*The author of this computation has been verified*
R Software Modulerwasp_autocorrelation.wasp
Title produced by software(Partial) Autocorrelation Function
Date of computationSat, 20 Dec 2008 10:35:22 -0700
Cite this page as followsStatistical Computations at FreeStatistics.org, Office for Research Development and Education, URL https://freestatistics.org/blog/index.php?v=date/2008/Dec/20/t1229794641vrcw3gbmg642j5e.htm/, Retrieved Sun, 19 May 2024 10:20:12 +0000
Statistical Computations at FreeStatistics.org, Office for Research Development and Education, URL https://freestatistics.org/blog/index.php?pk=35426, Retrieved Sun, 19 May 2024 10:20:12 +0000
QR Codes:

Original text written by user:
IsPrivate?No (this computation is public)
User-defined keywords
Estimated Impact188
Family? (F = Feedback message, R = changed R code, M = changed R Module, P = changed Parameters, D = changed Data)
-       [(Partial) Autocorrelation Function] [ACF paper] [2008-12-20 17:35:22] [00a0a665d7a07edd2e460056b0c0c354] [Current]
Feedback Forum

Post a new message
Dataseries X:
2175
2197
2350
2440
2409
2473
2408
2455
2448
2498
2646
2757
2849
2921
2982
3081
3106
3119
3061
3097
3162
3257
3277
3295
3364
3494
3667
3813
3918
3896
3801
3570
3702
3862
3970
4139
4200
4291
4444
4503
4357
4591
4697
4621
4563
4203
4296
4435
4105
4117
3844
3721
3674
3858
3801
3504
3033
3047
2962
2198
2014


Summary of computational transaction
Raw Inputview raw input (R code)
Raw Outputview raw output of R engine
Computing time1 seconds
R Server'Gwilym Jenkins' @ 72.249.127.135

\begin{tabular}{lllllllll}
\hline
Summary of computational transaction \tabularnewline
Raw Input & view raw input (R code)  \tabularnewline
Raw Output & view raw output of R engine  \tabularnewline
Computing time & 1 seconds \tabularnewline
R Server & 'Gwilym Jenkins' @ 72.249.127.135 \tabularnewline
\hline
\end{tabular}
%Source: https://freestatistics.org/blog/index.php?pk=35426&T=0

[TABLE]
[ROW][C]Summary of computational transaction[/C][/ROW]
[ROW][C]Raw Input[/C][C]view raw input (R code) [/C][/ROW]
[ROW][C]Raw Output[/C][C]view raw output of R engine [/C][/ROW]
[ROW][C]Computing time[/C][C]1 seconds[/C][/ROW]
[ROW][C]R Server[/C][C]'Gwilym Jenkins' @ 72.249.127.135[/C][/ROW]
[/TABLE]
Source: https://freestatistics.org/blog/index.php?pk=35426&T=0

Globally Unique Identifier (entire table): ba.freestatistics.org/blog/index.php?pk=35426&T=0

As an alternative you can also use a QR Code:  

The GUIDs for individual cells are displayed in the table below:

Summary of computational transaction
Raw Inputview raw input (R code)
Raw Outputview raw output of R engine
Computing time1 seconds
R Server'Gwilym Jenkins' @ 72.249.127.135


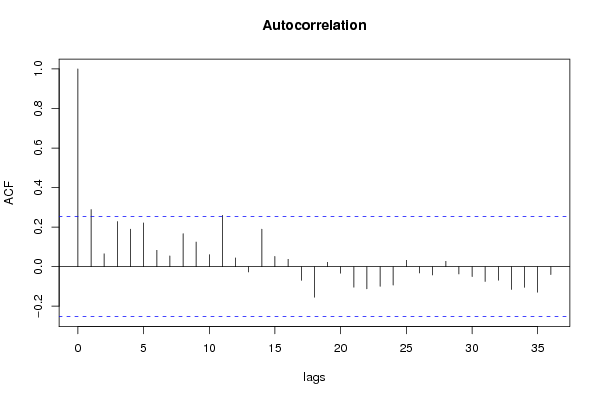
Autocorrelation Function
Time lag kACF(k)T-STATP-value
10.2889822.23840.014457
20.0649920.50340.308254
30.2278021.76450.041365
40.189391.4670.073798
50.2207621.710.046215
60.0824490.63860.262742
70.0539430.41780.338777
80.1665721.29030.100955
90.1244570.9640.169447
100.0601420.46590.321503
110.2593282.00870.024535
120.0443380.34340.366233
13-0.026738-0.20710.418313
140.1896791.46930.073494
150.0517810.40110.344887
160.036870.28560.388087
17-0.068945-0.5340.297641
18-0.1549-1.19990.117457
190.0216850.1680.433584
20-0.033057-0.25610.39939
21-0.104319-0.80810.211126
22-0.11235-0.87030.193814
23-0.099339-0.76950.222314
24-0.09304-0.72070.236951
250.0322710.250.401732
26-0.031827-0.24650.403055
27-0.042081-0.3260.372794
280.0272240.21090.416851
29-0.036826-0.28530.388216
30-0.050234-0.38910.349285
31-0.074937-0.58050.281889
32-0.068305-0.52910.299348
33-0.115128-0.89180.188038
34-0.104772-0.81160.210126
35-0.129107-1.00010.16065
36-0.040095-0.31060.3786

\begin{tabular}{lllllllll}
\hline
Autocorrelation Function \tabularnewline
Time lag k & ACF(k) & T-STAT & P-value \tabularnewline
1 & 0.288982 & 2.2384 & 0.014457 \tabularnewline
2 & 0.064992 & 0.5034 & 0.308254 \tabularnewline
3 & 0.227802 & 1.7645 & 0.041365 \tabularnewline
4 & 0.18939 & 1.467 & 0.073798 \tabularnewline
5 & 0.220762 & 1.71 & 0.046215 \tabularnewline
6 & 0.082449 & 0.6386 & 0.262742 \tabularnewline
7 & 0.053943 & 0.4178 & 0.338777 \tabularnewline
8 & 0.166572 & 1.2903 & 0.100955 \tabularnewline
9 & 0.124457 & 0.964 & 0.169447 \tabularnewline
10 & 0.060142 & 0.4659 & 0.321503 \tabularnewline
11 & 0.259328 & 2.0087 & 0.024535 \tabularnewline
12 & 0.044338 & 0.3434 & 0.366233 \tabularnewline
13 & -0.026738 & -0.2071 & 0.418313 \tabularnewline
14 & 0.189679 & 1.4693 & 0.073494 \tabularnewline
15 & 0.051781 & 0.4011 & 0.344887 \tabularnewline
16 & 0.03687 & 0.2856 & 0.388087 \tabularnewline
17 & -0.068945 & -0.534 & 0.297641 \tabularnewline
18 & -0.1549 & -1.1999 & 0.117457 \tabularnewline
19 & 0.021685 & 0.168 & 0.433584 \tabularnewline
20 & -0.033057 & -0.2561 & 0.39939 \tabularnewline
21 & -0.104319 & -0.8081 & 0.211126 \tabularnewline
22 & -0.11235 & -0.8703 & 0.193814 \tabularnewline
23 & -0.099339 & -0.7695 & 0.222314 \tabularnewline
24 & -0.09304 & -0.7207 & 0.236951 \tabularnewline
25 & 0.032271 & 0.25 & 0.401732 \tabularnewline
26 & -0.031827 & -0.2465 & 0.403055 \tabularnewline
27 & -0.042081 & -0.326 & 0.372794 \tabularnewline
28 & 0.027224 & 0.2109 & 0.416851 \tabularnewline
29 & -0.036826 & -0.2853 & 0.388216 \tabularnewline
30 & -0.050234 & -0.3891 & 0.349285 \tabularnewline
31 & -0.074937 & -0.5805 & 0.281889 \tabularnewline
32 & -0.068305 & -0.5291 & 0.299348 \tabularnewline
33 & -0.115128 & -0.8918 & 0.188038 \tabularnewline
34 & -0.104772 & -0.8116 & 0.210126 \tabularnewline
35 & -0.129107 & -1.0001 & 0.16065 \tabularnewline
36 & -0.040095 & -0.3106 & 0.3786 \tabularnewline
\hline
\end{tabular}
%Source: https://freestatistics.org/blog/index.php?pk=35426&T=1

[TABLE]
[ROW][C]Autocorrelation Function[/C][/ROW]
[ROW][C]Time lag k[/C][C]ACF(k)[/C][C]T-STAT[/C][C]P-value[/C][/ROW]
[ROW][C]1[/C][C]0.288982[/C][C]2.2384[/C][C]0.014457[/C][/ROW]
[ROW][C]2[/C][C]0.064992[/C][C]0.5034[/C][C]0.308254[/C][/ROW]
[ROW][C]3[/C][C]0.227802[/C][C]1.7645[/C][C]0.041365[/C][/ROW]
[ROW][C]4[/C][C]0.18939[/C][C]1.467[/C][C]0.073798[/C][/ROW]
[ROW][C]5[/C][C]0.220762[/C][C]1.71[/C][C]0.046215[/C][/ROW]
[ROW][C]6[/C][C]0.082449[/C][C]0.6386[/C][C]0.262742[/C][/ROW]
[ROW][C]7[/C][C]0.053943[/C][C]0.4178[/C][C]0.338777[/C][/ROW]
[ROW][C]8[/C][C]0.166572[/C][C]1.2903[/C][C]0.100955[/C][/ROW]
[ROW][C]9[/C][C]0.124457[/C][C]0.964[/C][C]0.169447[/C][/ROW]
[ROW][C]10[/C][C]0.060142[/C][C]0.4659[/C][C]0.321503[/C][/ROW]
[ROW][C]11[/C][C]0.259328[/C][C]2.0087[/C][C]0.024535[/C][/ROW]
[ROW][C]12[/C][C]0.044338[/C][C]0.3434[/C][C]0.366233[/C][/ROW]
[ROW][C]13[/C][C]-0.026738[/C][C]-0.2071[/C][C]0.418313[/C][/ROW]
[ROW][C]14[/C][C]0.189679[/C][C]1.4693[/C][C]0.073494[/C][/ROW]
[ROW][C]15[/C][C]0.051781[/C][C]0.4011[/C][C]0.344887[/C][/ROW]
[ROW][C]16[/C][C]0.03687[/C][C]0.2856[/C][C]0.388087[/C][/ROW]
[ROW][C]17[/C][C]-0.068945[/C][C]-0.534[/C][C]0.297641[/C][/ROW]
[ROW][C]18[/C][C]-0.1549[/C][C]-1.1999[/C][C]0.117457[/C][/ROW]
[ROW][C]19[/C][C]0.021685[/C][C]0.168[/C][C]0.433584[/C][/ROW]
[ROW][C]20[/C][C]-0.033057[/C][C]-0.2561[/C][C]0.39939[/C][/ROW]
[ROW][C]21[/C][C]-0.104319[/C][C]-0.8081[/C][C]0.211126[/C][/ROW]
[ROW][C]22[/C][C]-0.11235[/C][C]-0.8703[/C][C]0.193814[/C][/ROW]
[ROW][C]23[/C][C]-0.099339[/C][C]-0.7695[/C][C]0.222314[/C][/ROW]
[ROW][C]24[/C][C]-0.09304[/C][C]-0.7207[/C][C]0.236951[/C][/ROW]
[ROW][C]25[/C][C]0.032271[/C][C]0.25[/C][C]0.401732[/C][/ROW]
[ROW][C]26[/C][C]-0.031827[/C][C]-0.2465[/C][C]0.403055[/C][/ROW]
[ROW][C]27[/C][C]-0.042081[/C][C]-0.326[/C][C]0.372794[/C][/ROW]
[ROW][C]28[/C][C]0.027224[/C][C]0.2109[/C][C]0.416851[/C][/ROW]
[ROW][C]29[/C][C]-0.036826[/C][C]-0.2853[/C][C]0.388216[/C][/ROW]
[ROW][C]30[/C][C]-0.050234[/C][C]-0.3891[/C][C]0.349285[/C][/ROW]
[ROW][C]31[/C][C]-0.074937[/C][C]-0.5805[/C][C]0.281889[/C][/ROW]
[ROW][C]32[/C][C]-0.068305[/C][C]-0.5291[/C][C]0.299348[/C][/ROW]
[ROW][C]33[/C][C]-0.115128[/C][C]-0.8918[/C][C]0.188038[/C][/ROW]
[ROW][C]34[/C][C]-0.104772[/C][C]-0.8116[/C][C]0.210126[/C][/ROW]
[ROW][C]35[/C][C]-0.129107[/C][C]-1.0001[/C][C]0.16065[/C][/ROW]
[ROW][C]36[/C][C]-0.040095[/C][C]-0.3106[/C][C]0.3786[/C][/ROW]
[/TABLE]
Source: https://freestatistics.org/blog/index.php?pk=35426&T=1

Globally Unique Identifier (entire table): ba.freestatistics.org/blog/index.php?pk=35426&T=1

As an alternative you can also use a QR Code:  

The GUIDs for individual cells are displayed in the table below:

Autocorrelation Function
Time lag kACF(k)T-STATP-value
10.2889822.23840.014457
20.0649920.50340.308254
30.2278021.76450.041365
40.189391.4670.073798
50.2207621.710.046215
60.0824490.63860.262742
70.0539430.41780.338777
80.1665721.29030.100955
90.1244570.9640.169447
100.0601420.46590.321503
110.2593282.00870.024535
120.0443380.34340.366233
13-0.026738-0.20710.418313
140.1896791.46930.073494
150.0517810.40110.344887
160.036870.28560.388087
17-0.068945-0.5340.297641
18-0.1549-1.19990.117457
190.0216850.1680.433584
20-0.033057-0.25610.39939
21-0.104319-0.80810.211126
22-0.11235-0.87030.193814
23-0.099339-0.76950.222314
24-0.09304-0.72070.236951
250.0322710.250.401732
26-0.031827-0.24650.403055
27-0.042081-0.3260.372794
280.0272240.21090.416851
29-0.036826-0.28530.388216
30-0.050234-0.38910.349285
31-0.074937-0.58050.281889
32-0.068305-0.52910.299348
33-0.115128-0.89180.188038
34-0.104772-0.81160.210126
35-0.129107-1.00010.16065
36-0.040095-0.31060.3786


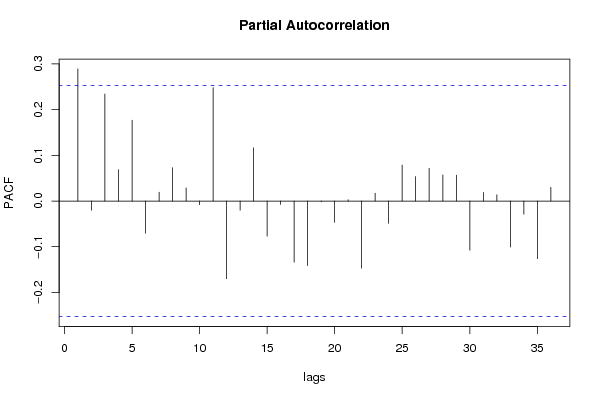
Partial Autocorrelation Function
Time lag kPACF(k)T-STATP-value
10.2889822.23840.014457
2-0.020206-0.15650.438076
30.234121.81350.03738
40.0684770.53040.298889
50.1767491.36910.088037
6-0.070492-0.5460.293535
70.0193180.14960.440776
80.0730720.5660.286749
90.0286030.22160.412704
10-0.007914-0.06130.47566
110.2480221.92120.029733
12-0.170033-1.31710.096412
13-0.02012-0.15590.438336
140.1163050.90090.185623
15-0.076912-0.59580.276788
16-0.007436-0.05760.47713
17-0.133874-1.0370.151953
18-0.141266-1.09420.139111
19-0.001854-0.01440.494294
20-0.046565-0.36070.359798
210.0029690.0230.490865
22-0.146991-1.13860.129701
230.0170390.1320.447719
24-0.048823-0.37820.353316
250.0787160.60970.272172
260.053480.41430.340083
270.0716080.55470.29059
280.057120.44240.329878
290.0564140.4370.331846
30-0.107597-0.83340.203951
310.0188140.14570.442311
320.0136970.10610.457929
33-0.100879-0.78140.218819
34-0.028735-0.22260.412311
35-0.126103-0.97680.166298
360.0298590.23130.40894

\begin{tabular}{lllllllll}
\hline
Partial Autocorrelation Function \tabularnewline
Time lag k & PACF(k) & T-STAT & P-value \tabularnewline
1 & 0.288982 & 2.2384 & 0.014457 \tabularnewline
2 & -0.020206 & -0.1565 & 0.438076 \tabularnewline
3 & 0.23412 & 1.8135 & 0.03738 \tabularnewline
4 & 0.068477 & 0.5304 & 0.298889 \tabularnewline
5 & 0.176749 & 1.3691 & 0.088037 \tabularnewline
6 & -0.070492 & -0.546 & 0.293535 \tabularnewline
7 & 0.019318 & 0.1496 & 0.440776 \tabularnewline
8 & 0.073072 & 0.566 & 0.286749 \tabularnewline
9 & 0.028603 & 0.2216 & 0.412704 \tabularnewline
10 & -0.007914 & -0.0613 & 0.47566 \tabularnewline
11 & 0.248022 & 1.9212 & 0.029733 \tabularnewline
12 & -0.170033 & -1.3171 & 0.096412 \tabularnewline
13 & -0.02012 & -0.1559 & 0.438336 \tabularnewline
14 & 0.116305 & 0.9009 & 0.185623 \tabularnewline
15 & -0.076912 & -0.5958 & 0.276788 \tabularnewline
16 & -0.007436 & -0.0576 & 0.47713 \tabularnewline
17 & -0.133874 & -1.037 & 0.151953 \tabularnewline
18 & -0.141266 & -1.0942 & 0.139111 \tabularnewline
19 & -0.001854 & -0.0144 & 0.494294 \tabularnewline
20 & -0.046565 & -0.3607 & 0.359798 \tabularnewline
21 & 0.002969 & 0.023 & 0.490865 \tabularnewline
22 & -0.146991 & -1.1386 & 0.129701 \tabularnewline
23 & 0.017039 & 0.132 & 0.447719 \tabularnewline
24 & -0.048823 & -0.3782 & 0.353316 \tabularnewline
25 & 0.078716 & 0.6097 & 0.272172 \tabularnewline
26 & 0.05348 & 0.4143 & 0.340083 \tabularnewline
27 & 0.071608 & 0.5547 & 0.29059 \tabularnewline
28 & 0.05712 & 0.4424 & 0.329878 \tabularnewline
29 & 0.056414 & 0.437 & 0.331846 \tabularnewline
30 & -0.107597 & -0.8334 & 0.203951 \tabularnewline
31 & 0.018814 & 0.1457 & 0.442311 \tabularnewline
32 & 0.013697 & 0.1061 & 0.457929 \tabularnewline
33 & -0.100879 & -0.7814 & 0.218819 \tabularnewline
34 & -0.028735 & -0.2226 & 0.412311 \tabularnewline
35 & -0.126103 & -0.9768 & 0.166298 \tabularnewline
36 & 0.029859 & 0.2313 & 0.40894 \tabularnewline
\hline
\end{tabular}
%Source: https://freestatistics.org/blog/index.php?pk=35426&T=2

[TABLE]
[ROW][C]Partial Autocorrelation Function[/C][/ROW]
[ROW][C]Time lag k[/C][C]PACF(k)[/C][C]T-STAT[/C][C]P-value[/C][/ROW]
[ROW][C]1[/C][C]0.288982[/C][C]2.2384[/C][C]0.014457[/C][/ROW]
[ROW][C]2[/C][C]-0.020206[/C][C]-0.1565[/C][C]0.438076[/C][/ROW]
[ROW][C]3[/C][C]0.23412[/C][C]1.8135[/C][C]0.03738[/C][/ROW]
[ROW][C]4[/C][C]0.068477[/C][C]0.5304[/C][C]0.298889[/C][/ROW]
[ROW][C]5[/C][C]0.176749[/C][C]1.3691[/C][C]0.088037[/C][/ROW]
[ROW][C]6[/C][C]-0.070492[/C][C]-0.546[/C][C]0.293535[/C][/ROW]
[ROW][C]7[/C][C]0.019318[/C][C]0.1496[/C][C]0.440776[/C][/ROW]
[ROW][C]8[/C][C]0.073072[/C][C]0.566[/C][C]0.286749[/C][/ROW]
[ROW][C]9[/C][C]0.028603[/C][C]0.2216[/C][C]0.412704[/C][/ROW]
[ROW][C]10[/C][C]-0.007914[/C][C]-0.0613[/C][C]0.47566[/C][/ROW]
[ROW][C]11[/C][C]0.248022[/C][C]1.9212[/C][C]0.029733[/C][/ROW]
[ROW][C]12[/C][C]-0.170033[/C][C]-1.3171[/C][C]0.096412[/C][/ROW]
[ROW][C]13[/C][C]-0.02012[/C][C]-0.1559[/C][C]0.438336[/C][/ROW]
[ROW][C]14[/C][C]0.116305[/C][C]0.9009[/C][C]0.185623[/C][/ROW]
[ROW][C]15[/C][C]-0.076912[/C][C]-0.5958[/C][C]0.276788[/C][/ROW]
[ROW][C]16[/C][C]-0.007436[/C][C]-0.0576[/C][C]0.47713[/C][/ROW]
[ROW][C]17[/C][C]-0.133874[/C][C]-1.037[/C][C]0.151953[/C][/ROW]
[ROW][C]18[/C][C]-0.141266[/C][C]-1.0942[/C][C]0.139111[/C][/ROW]
[ROW][C]19[/C][C]-0.001854[/C][C]-0.0144[/C][C]0.494294[/C][/ROW]
[ROW][C]20[/C][C]-0.046565[/C][C]-0.3607[/C][C]0.359798[/C][/ROW]
[ROW][C]21[/C][C]0.002969[/C][C]0.023[/C][C]0.490865[/C][/ROW]
[ROW][C]22[/C][C]-0.146991[/C][C]-1.1386[/C][C]0.129701[/C][/ROW]
[ROW][C]23[/C][C]0.017039[/C][C]0.132[/C][C]0.447719[/C][/ROW]
[ROW][C]24[/C][C]-0.048823[/C][C]-0.3782[/C][C]0.353316[/C][/ROW]
[ROW][C]25[/C][C]0.078716[/C][C]0.6097[/C][C]0.272172[/C][/ROW]
[ROW][C]26[/C][C]0.05348[/C][C]0.4143[/C][C]0.340083[/C][/ROW]
[ROW][C]27[/C][C]0.071608[/C][C]0.5547[/C][C]0.29059[/C][/ROW]
[ROW][C]28[/C][C]0.05712[/C][C]0.4424[/C][C]0.329878[/C][/ROW]
[ROW][C]29[/C][C]0.056414[/C][C]0.437[/C][C]0.331846[/C][/ROW]
[ROW][C]30[/C][C]-0.107597[/C][C]-0.8334[/C][C]0.203951[/C][/ROW]
[ROW][C]31[/C][C]0.018814[/C][C]0.1457[/C][C]0.442311[/C][/ROW]
[ROW][C]32[/C][C]0.013697[/C][C]0.1061[/C][C]0.457929[/C][/ROW]
[ROW][C]33[/C][C]-0.100879[/C][C]-0.7814[/C][C]0.218819[/C][/ROW]
[ROW][C]34[/C][C]-0.028735[/C][C]-0.2226[/C][C]0.412311[/C][/ROW]
[ROW][C]35[/C][C]-0.126103[/C][C]-0.9768[/C][C]0.166298[/C][/ROW]
[ROW][C]36[/C][C]0.029859[/C][C]0.2313[/C][C]0.40894[/C][/ROW]
[/TABLE]
Source: https://freestatistics.org/blog/index.php?pk=35426&T=2

Globally Unique Identifier (entire table): ba.freestatistics.org/blog/index.php?pk=35426&T=2

As an alternative you can also use a QR Code:  

The GUIDs for individual cells are displayed in the table below:

Partial Autocorrelation Function
Time lag kPACF(k)T-STATP-value
10.2889822.23840.014457
2-0.020206-0.15650.438076
30.234121.81350.03738
40.0684770.53040.298889
50.1767491.36910.088037
6-0.070492-0.5460.293535
70.0193180.14960.440776
80.0730720.5660.286749
90.0286030.22160.412704
10-0.007914-0.06130.47566
110.2480221.92120.029733
12-0.170033-1.31710.096412
13-0.02012-0.15590.438336
140.1163050.90090.185623
15-0.076912-0.59580.276788
16-0.007436-0.05760.47713
17-0.133874-1.0370.151953
18-0.141266-1.09420.139111
19-0.001854-0.01440.494294
20-0.046565-0.36070.359798
210.0029690.0230.490865
22-0.146991-1.13860.129701
230.0170390.1320.447719
24-0.048823-0.37820.353316
250.0787160.60970.272172
260.053480.41430.340083
270.0716080.55470.29059
280.057120.44240.329878
290.0564140.4370.331846
30-0.107597-0.83340.203951
310.0188140.14570.442311
320.0136970.10610.457929
33-0.100879-0.78140.218819
34-0.028735-0.22260.412311
35-0.126103-0.97680.166298
360.0298590.23130.40894


Parameters (Session):
par1 = 36 ; par2 = 1 ; par3 = 1 ; par4 = 0 ; par5 = 12 ;
Parameters (R input):
par1 = 36 ; par2 = 1 ; par3 = 1 ; par4 = 0 ; par5 = 12 ;
R code (references can be found in the software module):
if (par1 == 'Default') {
par1 = 10*log10(length(x))
} else {
par1 <- as.numeric(par1)
}
par2 <- as.numeric(par2)
par3 <- as.numeric(par3)
par4 <- as.numeric(par4)
par5 <- as.numeric(par5)
if (par2 == 0) {
x <- log(x)
} else {
x <- (x ^ par2 - 1) / par2
}
if (par3 > 0) x <- diff(x,lag=1,difference=par3)
if (par4 > 0) x <- diff(x,lag=par5,difference=par4)
bitmap(file='pic1.png')
racf <- acf(x,par1,main='Autocorrelation',xlab='lags',ylab='ACF')
dev.off()
bitmap(file='pic2.png')
rpacf <- pacf(x,par1,main='Partial Autocorrelation',xlab='lags',ylab='PACF')
dev.off()
(myacf <- c(racf$acf))
(mypacf <- c(rpacf$acf))
lengthx <- length(x)
sqrtn <- sqrt(lengthx)
load(file='createtable')
a<-table.start()
a<-table.row.start(a)
a<-table.element(a,'Autocorrelation Function',4,TRUE)
a<-table.row.end(a)
a<-table.row.start(a)
a<-table.element(a,'Time lag k',header=TRUE)
a<-table.element(a,hyperlink('basics.htm','ACF(k)','click here for more information about the Autocorrelation Function'),header=TRUE)
a<-table.element(a,'T-STAT',header=TRUE)
a<-table.element(a,'P-value',header=TRUE)
a<-table.row.end(a)
for (i in 2:(par1+1)) {
a<-table.row.start(a)
a<-table.element(a,i-1,header=TRUE)
a<-table.element(a,round(myacf[i],6))
mytstat <- myacf[i]*sqrtn
a<-table.element(a,round(mytstat,4))
a<-table.element(a,round(1-pt(abs(mytstat),lengthx),6))
a<-table.row.end(a)
}
a<-table.end(a)
table.save(a,file='mytable.tab')
a<-table.start()
a<-table.row.start(a)
a<-table.element(a,'Partial Autocorrelation Function',4,TRUE)
a<-table.row.end(a)
a<-table.row.start(a)
a<-table.element(a,'Time lag k',header=TRUE)
a<-table.element(a,hyperlink('basics.htm','PACF(k)','click here for more information about the Partial Autocorrelation Function'),header=TRUE)
a<-table.element(a,'T-STAT',header=TRUE)
a<-table.element(a,'P-value',header=TRUE)
a<-table.row.end(a)
for (i in 1:par1) {
a<-table.row.start(a)
a<-table.element(a,i,header=TRUE)
a<-table.element(a,round(mypacf[i],6))
mytstat <- mypacf[i]*sqrtn
a<-table.element(a,round(mytstat,4))
a<-table.element(a,round(1-pt(abs(mytstat),lengthx),6))
a<-table.row.end(a)
}
a<-table.end(a)
table.save(a,file='mytable1.tab')