Free Statistics

of Irreproducible Research!

Author's title

Author*The author of this computation has been verified*
R Software Modulerwasp_arimabackwardselection.wasp
Title produced by softwareARIMA Backward Selection
Date of computationSat, 20 Dec 2008 10:03:24 -0700
Cite this page as followsStatistical Computations at FreeStatistics.org, Office for Research Development and Education, URL https://freestatistics.org/blog/index.php?v=date/2008/Dec/20/t1229792764nfkyixkkfldpznp.htm/, Retrieved Sun, 19 May 2024 08:54:09 +0000
Statistical Computations at FreeStatistics.org, Office for Research Development and Education, URL https://freestatistics.org/blog/index.php?pk=35424, Retrieved Sun, 19 May 2024 08:54:09 +0000
QR Codes:

Original text written by user:
IsPrivate?No (this computation is public)
User-defined keywords
Estimated Impact211
Family? (F = Feedback message, R = changed R code, M = changed R Module, P = changed Parameters, D = changed Data)
-       [ARIMA Backward Selection] [Arima backward] [2008-12-20 17:03:24] [d6e9f26c3644bfc30f06303d9993b878] [Current]
- RMP     [ARIMA Forecasting] [] [2008-12-20 22:37:59] [b98453cac15ba1066b407e146608df68]
Feedback Forum

Post a new message
Dataseries X:
17704
15548
28029
29383
36438
32034
22679
24319
18004
17537
20366
22782
19169
13807
29743
25591
29096
26482
22405
27044
17970
18730
19684
19785
18479
10698
31956
29506
34506
27165
26736
23691
18157
17328
18205
20995
17382
9367
31124
26551
30651
25859
25100
25778
20418
18688
20424
24776
19814
12738
31566
30111
30019
31934
25826
26835
20205
17789
20520
22518
15572


Summary of computational transaction
Raw Inputview raw input (R code)
Raw Outputview raw output of R engine
Computing time15 seconds
R Server'Gwilym Jenkins' @ 72.249.127.135

\begin{tabular}{lllllllll}
\hline
Summary of computational transaction \tabularnewline
Raw Input & view raw input (R code)  \tabularnewline
Raw Output & view raw output of R engine  \tabularnewline
Computing time & 15 seconds \tabularnewline
R Server & 'Gwilym Jenkins' @ 72.249.127.135 \tabularnewline
\hline
\end{tabular}
%Source: https://freestatistics.org/blog/index.php?pk=35424&T=0

[TABLE]
[ROW][C]Summary of computational transaction[/C][/ROW]
[ROW][C]Raw Input[/C][C]view raw input (R code) [/C][/ROW]
[ROW][C]Raw Output[/C][C]view raw output of R engine [/C][/ROW]
[ROW][C]Computing time[/C][C]15 seconds[/C][/ROW]
[ROW][C]R Server[/C][C]'Gwilym Jenkins' @ 72.249.127.135[/C][/ROW]
[/TABLE]
Source: https://freestatistics.org/blog/index.php?pk=35424&T=0

Globally Unique Identifier (entire table): ba.freestatistics.org/blog/index.php?pk=35424&T=0

As an alternative you can also use a QR Code:  

The GUIDs for individual cells are displayed in the table below:

Summary of computational transaction
Raw Inputview raw input (R code)
Raw Outputview raw output of R engine
Computing time15 seconds
R Server'Gwilym Jenkins' @ 72.249.127.135


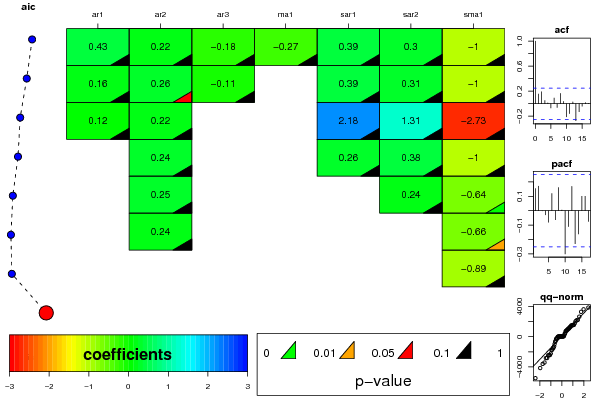
ARIMA Parameter Estimation and Backward Selection
Iterationar1ar2ar3ma1sar1sar2sma1
Estimates ( 1 )0.42840.2232-0.1765-0.27040.39350.3018-0.9973
(p-val)(0.6288 )(0.2958 )(0.4626 )(0.7592 )(0.2188 )(0.3198 )(0.1041 )
Estimates ( 2 )0.15590.2597-0.109200.38750.3119-0.9977
(p-val)(0.3944 )(0.0938 )(0.5164 )(NA )(0.2296 )(0.3027 )(0.1126 )
Estimates ( 3 )0.11810.2152002.17621.3109-2.7266
(p-val)(0.4741 )(0.1555 )(NA )(NA )(0.3388 )(0.3413 )(0.2254 )
Estimates ( 4 )00.2443000.26270.3787-0.9992
(p-val)(NA )(0.106 )(NA )(NA )(0.3733 )(0.1915 )(0.1468 )
Estimates ( 5 )00.24770000.2371-0.6437
(p-val)(NA )(0.1047 )(NA )(NA )(NA )(0.2463 )(0.006 )
Estimates ( 6 )00.23690000-0.6572
(p-val)(NA )(0.122 )(NA )(NA )(NA )(NA )(0.0193 )
Estimates ( 7 )000000-0.8938
(p-val)(NA )(NA )(NA )(NA )(NA )(NA )(0.3104 )
Estimates ( 8 )0000000
(p-val)(NA )(NA )(NA )(NA )(NA )(NA )(NA )
Estimates ( 9 )NANANANANANANA
(p-val)(NA )(NA )(NA )(NA )(NA )(NA )(NA )
Estimates ( 10 )NANANANANANANA
(p-val)(NA )(NA )(NA )(NA )(NA )(NA )(NA )
Estimates ( 11 )NANANANANANANA
(p-val)(NA )(NA )(NA )(NA )(NA )(NA )(NA )
Estimates ( 12 )NANANANANANANA
(p-val)(NA )(NA )(NA )(NA )(NA )(NA )(NA )
Estimates ( 13 )NANANANANANANA
(p-val)(NA )(NA )(NA )(NA )(NA )(NA )(NA )

\begin{tabular}{lllllllll}
\hline
ARIMA Parameter Estimation and Backward Selection \tabularnewline
Iteration & ar1 & ar2 & ar3 & ma1 & sar1 & sar2 & sma1 \tabularnewline
Estimates ( 1 ) & 0.4284 & 0.2232 & -0.1765 & -0.2704 & 0.3935 & 0.3018 & -0.9973 \tabularnewline
(p-val) & (0.6288 ) & (0.2958 ) & (0.4626 ) & (0.7592 ) & (0.2188 ) & (0.3198 ) & (0.1041 ) \tabularnewline
Estimates ( 2 ) & 0.1559 & 0.2597 & -0.1092 & 0 & 0.3875 & 0.3119 & -0.9977 \tabularnewline
(p-val) & (0.3944 ) & (0.0938 ) & (0.5164 ) & (NA ) & (0.2296 ) & (0.3027 ) & (0.1126 ) \tabularnewline
Estimates ( 3 ) & 0.1181 & 0.2152 & 0 & 0 & 2.1762 & 1.3109 & -2.7266 \tabularnewline
(p-val) & (0.4741 ) & (0.1555 ) & (NA ) & (NA ) & (0.3388 ) & (0.3413 ) & (0.2254 ) \tabularnewline
Estimates ( 4 ) & 0 & 0.2443 & 0 & 0 & 0.2627 & 0.3787 & -0.9992 \tabularnewline
(p-val) & (NA ) & (0.106 ) & (NA ) & (NA ) & (0.3733 ) & (0.1915 ) & (0.1468 ) \tabularnewline
Estimates ( 5 ) & 0 & 0.2477 & 0 & 0 & 0 & 0.2371 & -0.6437 \tabularnewline
(p-val) & (NA ) & (0.1047 ) & (NA ) & (NA ) & (NA ) & (0.2463 ) & (0.006 ) \tabularnewline
Estimates ( 6 ) & 0 & 0.2369 & 0 & 0 & 0 & 0 & -0.6572 \tabularnewline
(p-val) & (NA ) & (0.122 ) & (NA ) & (NA ) & (NA ) & (NA ) & (0.0193 ) \tabularnewline
Estimates ( 7 ) & 0 & 0 & 0 & 0 & 0 & 0 & -0.8938 \tabularnewline
(p-val) & (NA ) & (NA ) & (NA ) & (NA ) & (NA ) & (NA ) & (0.3104 ) \tabularnewline
Estimates ( 8 ) & 0 & 0 & 0 & 0 & 0 & 0 & 0 \tabularnewline
(p-val) & (NA ) & (NA ) & (NA ) & (NA ) & (NA ) & (NA ) & (NA ) \tabularnewline
Estimates ( 9 ) & NA & NA & NA & NA & NA & NA & NA \tabularnewline
(p-val) & (NA ) & (NA ) & (NA ) & (NA ) & (NA ) & (NA ) & (NA ) \tabularnewline
Estimates ( 10 ) & NA & NA & NA & NA & NA & NA & NA \tabularnewline
(p-val) & (NA ) & (NA ) & (NA ) & (NA ) & (NA ) & (NA ) & (NA ) \tabularnewline
Estimates ( 11 ) & NA & NA & NA & NA & NA & NA & NA \tabularnewline
(p-val) & (NA ) & (NA ) & (NA ) & (NA ) & (NA ) & (NA ) & (NA ) \tabularnewline
Estimates ( 12 ) & NA & NA & NA & NA & NA & NA & NA \tabularnewline
(p-val) & (NA ) & (NA ) & (NA ) & (NA ) & (NA ) & (NA ) & (NA ) \tabularnewline
Estimates ( 13 ) & NA & NA & NA & NA & NA & NA & NA \tabularnewline
(p-val) & (NA ) & (NA ) & (NA ) & (NA ) & (NA ) & (NA ) & (NA ) \tabularnewline
\hline
\end{tabular}
%Source: https://freestatistics.org/blog/index.php?pk=35424&T=1

[TABLE]
[ROW][C]ARIMA Parameter Estimation and Backward Selection[/C][/ROW]
[ROW][C]Iteration[/C][C]ar1[/C][C]ar2[/C][C]ar3[/C][C]ma1[/C][C]sar1[/C][C]sar2[/C][C]sma1[/C][/ROW]
[ROW][C]Estimates ( 1 )[/C][C]0.4284[/C][C]0.2232[/C][C]-0.1765[/C][C]-0.2704[/C][C]0.3935[/C][C]0.3018[/C][C]-0.9973[/C][/ROW]
[ROW][C](p-val)[/C][C](0.6288 )[/C][C](0.2958 )[/C][C](0.4626 )[/C][C](0.7592 )[/C][C](0.2188 )[/C][C](0.3198 )[/C][C](0.1041 )[/C][/ROW]
[ROW][C]Estimates ( 2 )[/C][C]0.1559[/C][C]0.2597[/C][C]-0.1092[/C][C]0[/C][C]0.3875[/C][C]0.3119[/C][C]-0.9977[/C][/ROW]
[ROW][C](p-val)[/C][C](0.3944 )[/C][C](0.0938 )[/C][C](0.5164 )[/C][C](NA )[/C][C](0.2296 )[/C][C](0.3027 )[/C][C](0.1126 )[/C][/ROW]
[ROW][C]Estimates ( 3 )[/C][C]0.1181[/C][C]0.2152[/C][C]0[/C][C]0[/C][C]2.1762[/C][C]1.3109[/C][C]-2.7266[/C][/ROW]
[ROW][C](p-val)[/C][C](0.4741 )[/C][C](0.1555 )[/C][C](NA )[/C][C](NA )[/C][C](0.3388 )[/C][C](0.3413 )[/C][C](0.2254 )[/C][/ROW]
[ROW][C]Estimates ( 4 )[/C][C]0[/C][C]0.2443[/C][C]0[/C][C]0[/C][C]0.2627[/C][C]0.3787[/C][C]-0.9992[/C][/ROW]
[ROW][C](p-val)[/C][C](NA )[/C][C](0.106 )[/C][C](NA )[/C][C](NA )[/C][C](0.3733 )[/C][C](0.1915 )[/C][C](0.1468 )[/C][/ROW]
[ROW][C]Estimates ( 5 )[/C][C]0[/C][C]0.2477[/C][C]0[/C][C]0[/C][C]0[/C][C]0.2371[/C][C]-0.6437[/C][/ROW]
[ROW][C](p-val)[/C][C](NA )[/C][C](0.1047 )[/C][C](NA )[/C][C](NA )[/C][C](NA )[/C][C](0.2463 )[/C][C](0.006 )[/C][/ROW]
[ROW][C]Estimates ( 6 )[/C][C]0[/C][C]0.2369[/C][C]0[/C][C]0[/C][C]0[/C][C]0[/C][C]-0.6572[/C][/ROW]
[ROW][C](p-val)[/C][C](NA )[/C][C](0.122 )[/C][C](NA )[/C][C](NA )[/C][C](NA )[/C][C](NA )[/C][C](0.0193 )[/C][/ROW]
[ROW][C]Estimates ( 7 )[/C][C]0[/C][C]0[/C][C]0[/C][C]0[/C][C]0[/C][C]0[/C][C]-0.8938[/C][/ROW]
[ROW][C](p-val)[/C][C](NA )[/C][C](NA )[/C][C](NA )[/C][C](NA )[/C][C](NA )[/C][C](NA )[/C][C](0.3104 )[/C][/ROW]
[ROW][C]Estimates ( 8 )[/C][C]0[/C][C]0[/C][C]0[/C][C]0[/C][C]0[/C][C]0[/C][C]0[/C][/ROW]
[ROW][C](p-val)[/C][C](NA )[/C][C](NA )[/C][C](NA )[/C][C](NA )[/C][C](NA )[/C][C](NA )[/C][C](NA )[/C][/ROW]
[ROW][C]Estimates ( 9 )[/C][C]NA[/C][C]NA[/C][C]NA[/C][C]NA[/C][C]NA[/C][C]NA[/C][C]NA[/C][/ROW]
[ROW][C](p-val)[/C][C](NA )[/C][C](NA )[/C][C](NA )[/C][C](NA )[/C][C](NA )[/C][C](NA )[/C][C](NA )[/C][/ROW]
[ROW][C]Estimates ( 10 )[/C][C]NA[/C][C]NA[/C][C]NA[/C][C]NA[/C][C]NA[/C][C]NA[/C][C]NA[/C][/ROW]
[ROW][C](p-val)[/C][C](NA )[/C][C](NA )[/C][C](NA )[/C][C](NA )[/C][C](NA )[/C][C](NA )[/C][C](NA )[/C][/ROW]
[ROW][C]Estimates ( 11 )[/C][C]NA[/C][C]NA[/C][C]NA[/C][C]NA[/C][C]NA[/C][C]NA[/C][C]NA[/C][/ROW]
[ROW][C](p-val)[/C][C](NA )[/C][C](NA )[/C][C](NA )[/C][C](NA )[/C][C](NA )[/C][C](NA )[/C][C](NA )[/C][/ROW]
[ROW][C]Estimates ( 12 )[/C][C]NA[/C][C]NA[/C][C]NA[/C][C]NA[/C][C]NA[/C][C]NA[/C][C]NA[/C][/ROW]
[ROW][C](p-val)[/C][C](NA )[/C][C](NA )[/C][C](NA )[/C][C](NA )[/C][C](NA )[/C][C](NA )[/C][C](NA )[/C][/ROW]
[ROW][C]Estimates ( 13 )[/C][C]NA[/C][C]NA[/C][C]NA[/C][C]NA[/C][C]NA[/C][C]NA[/C][C]NA[/C][/ROW]
[ROW][C](p-val)[/C][C](NA )[/C][C](NA )[/C][C](NA )[/C][C](NA )[/C][C](NA )[/C][C](NA )[/C][C](NA )[/C][/ROW]
[/TABLE]
Source: https://freestatistics.org/blog/index.php?pk=35424&T=1

Globally Unique Identifier (entire table): ba.freestatistics.org/blog/index.php?pk=35424&T=1

As an alternative you can also use a QR Code:  

The GUIDs for individual cells are displayed in the table below:

ARIMA Parameter Estimation and Backward Selection
Iterationar1ar2ar3ma1sar1sar2sma1
Estimates ( 1 )0.42840.2232-0.1765-0.27040.39350.3018-0.9973
(p-val)(0.6288 )(0.2958 )(0.4626 )(0.7592 )(0.2188 )(0.3198 )(0.1041 )
Estimates ( 2 )0.15590.2597-0.109200.38750.3119-0.9977
(p-val)(0.3944 )(0.0938 )(0.5164 )(NA )(0.2296 )(0.3027 )(0.1126 )
Estimates ( 3 )0.11810.2152002.17621.3109-2.7266
(p-val)(0.4741 )(0.1555 )(NA )(NA )(0.3388 )(0.3413 )(0.2254 )
Estimates ( 4 )00.2443000.26270.3787-0.9992
(p-val)(NA )(0.106 )(NA )(NA )(0.3733 )(0.1915 )(0.1468 )
Estimates ( 5 )00.24770000.2371-0.6437
(p-val)(NA )(0.1047 )(NA )(NA )(NA )(0.2463 )(0.006 )
Estimates ( 6 )00.23690000-0.6572
(p-val)(NA )(0.122 )(NA )(NA )(NA )(NA )(0.0193 )
Estimates ( 7 )000000-0.8938
(p-val)(NA )(NA )(NA )(NA )(NA )(NA )(0.3104 )
Estimates ( 8 )0000000
(p-val)(NA )(NA )(NA )(NA )(NA )(NA )(NA )
Estimates ( 9 )NANANANANANANA
(p-val)(NA )(NA )(NA )(NA )(NA )(NA )(NA )
Estimates ( 10 )NANANANANANANA
(p-val)(NA )(NA )(NA )(NA )(NA )(NA )(NA )
Estimates ( 11 )NANANANANANANA
(p-val)(NA )(NA )(NA )(NA )(NA )(NA )(NA )
Estimates ( 12 )NANANANANANANA
(p-val)(NA )(NA )(NA )(NA )(NA )(NA )(NA )
Estimates ( 13 )NANANANANANANA
(p-val)(NA )(NA )(NA )(NA )(NA )(NA )(NA )


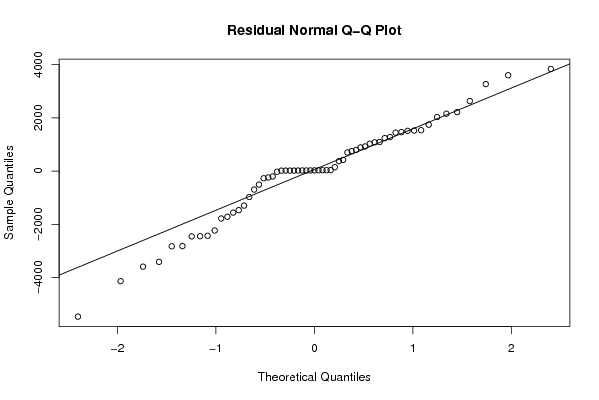
Estimated ARIMA Residuals
Value
22.7819795081356
1092.27579183779
-1298.03169486035
1277.93027291638
-2827.19206575997
-5473.97042000865
-4139.39823662756
-204.271803734054
2031.70179188838
-25.3374732332754
889.479908377309
-508.467003423132
-2234.46617484549
32.5776540820112
-3414.20359127401
2632.91726034497
1744.79114610902
1513.79063841186
-1783.20051100569
3603.92272883378
-1717.41449580073
146.149871428409
-695.229845069721
-1561.76746743795
-239.785079257248
-974.833045514297
-3594.6167627732
1082.04578705985
-1468.75964984061
-2448.51056894491
-2432.90426781894
1028.99141123768
698.541174829409
2158.15484800572
751.248528210065
927.271476072511
3270.89303486009
1536.82409226759
421.0023602197
1238.67406128516
2217.79339869042
-2457.83931623283
3840.55708755119
1464.447876722
1522.93368181558
1444.60120863833
-270.278904725363
796.447550247082
375.580920683491
-2820.74902392690

\begin{tabular}{lllllllll}
\hline
Estimated ARIMA Residuals \tabularnewline
Value \tabularnewline
22.7819795081356 \tabularnewline
1092.27579183779 \tabularnewline
-1298.03169486035 \tabularnewline
1277.93027291638 \tabularnewline
-2827.19206575997 \tabularnewline
-5473.97042000865 \tabularnewline
-4139.39823662756 \tabularnewline
-204.271803734054 \tabularnewline
2031.70179188838 \tabularnewline
-25.3374732332754 \tabularnewline
889.479908377309 \tabularnewline
-508.467003423132 \tabularnewline
-2234.46617484549 \tabularnewline
32.5776540820112 \tabularnewline
-3414.20359127401 \tabularnewline
2632.91726034497 \tabularnewline
1744.79114610902 \tabularnewline
1513.79063841186 \tabularnewline
-1783.20051100569 \tabularnewline
3603.92272883378 \tabularnewline
-1717.41449580073 \tabularnewline
146.149871428409 \tabularnewline
-695.229845069721 \tabularnewline
-1561.76746743795 \tabularnewline
-239.785079257248 \tabularnewline
-974.833045514297 \tabularnewline
-3594.6167627732 \tabularnewline
1082.04578705985 \tabularnewline
-1468.75964984061 \tabularnewline
-2448.51056894491 \tabularnewline
-2432.90426781894 \tabularnewline
1028.99141123768 \tabularnewline
698.541174829409 \tabularnewline
2158.15484800572 \tabularnewline
751.248528210065 \tabularnewline
927.271476072511 \tabularnewline
3270.89303486009 \tabularnewline
1536.82409226759 \tabularnewline
421.0023602197 \tabularnewline
1238.67406128516 \tabularnewline
2217.79339869042 \tabularnewline
-2457.83931623283 \tabularnewline
3840.55708755119 \tabularnewline
1464.447876722 \tabularnewline
1522.93368181558 \tabularnewline
1444.60120863833 \tabularnewline
-270.278904725363 \tabularnewline
796.447550247082 \tabularnewline
375.580920683491 \tabularnewline
-2820.74902392690 \tabularnewline
\hline
\end{tabular}
%Source: https://freestatistics.org/blog/index.php?pk=35424&T=2

[TABLE]
[ROW][C]Estimated ARIMA Residuals[/C][/ROW]
[ROW][C]Value[/C][/ROW]
[ROW][C]22.7819795081356[/C][/ROW]
[ROW][C]1092.27579183779[/C][/ROW]
[ROW][C]-1298.03169486035[/C][/ROW]
[ROW][C]1277.93027291638[/C][/ROW]
[ROW][C]-2827.19206575997[/C][/ROW]
[ROW][C]-5473.97042000865[/C][/ROW]
[ROW][C]-4139.39823662756[/C][/ROW]
[ROW][C]-204.271803734054[/C][/ROW]
[ROW][C]2031.70179188838[/C][/ROW]
[ROW][C]-25.3374732332754[/C][/ROW]
[ROW][C]889.479908377309[/C][/ROW]
[ROW][C]-508.467003423132[/C][/ROW]
[ROW][C]-2234.46617484549[/C][/ROW]
[ROW][C]32.5776540820112[/C][/ROW]
[ROW][C]-3414.20359127401[/C][/ROW]
[ROW][C]2632.91726034497[/C][/ROW]
[ROW][C]1744.79114610902[/C][/ROW]
[ROW][C]1513.79063841186[/C][/ROW]
[ROW][C]-1783.20051100569[/C][/ROW]
[ROW][C]3603.92272883378[/C][/ROW]
[ROW][C]-1717.41449580073[/C][/ROW]
[ROW][C]146.149871428409[/C][/ROW]
[ROW][C]-695.229845069721[/C][/ROW]
[ROW][C]-1561.76746743795[/C][/ROW]
[ROW][C]-239.785079257248[/C][/ROW]
[ROW][C]-974.833045514297[/C][/ROW]
[ROW][C]-3594.6167627732[/C][/ROW]
[ROW][C]1082.04578705985[/C][/ROW]
[ROW][C]-1468.75964984061[/C][/ROW]
[ROW][C]-2448.51056894491[/C][/ROW]
[ROW][C]-2432.90426781894[/C][/ROW]
[ROW][C]1028.99141123768[/C][/ROW]
[ROW][C]698.541174829409[/C][/ROW]
[ROW][C]2158.15484800572[/C][/ROW]
[ROW][C]751.248528210065[/C][/ROW]
[ROW][C]927.271476072511[/C][/ROW]
[ROW][C]3270.89303486009[/C][/ROW]
[ROW][C]1536.82409226759[/C][/ROW]
[ROW][C]421.0023602197[/C][/ROW]
[ROW][C]1238.67406128516[/C][/ROW]
[ROW][C]2217.79339869042[/C][/ROW]
[ROW][C]-2457.83931623283[/C][/ROW]
[ROW][C]3840.55708755119[/C][/ROW]
[ROW][C]1464.447876722[/C][/ROW]
[ROW][C]1522.93368181558[/C][/ROW]
[ROW][C]1444.60120863833[/C][/ROW]
[ROW][C]-270.278904725363[/C][/ROW]
[ROW][C]796.447550247082[/C][/ROW]
[ROW][C]375.580920683491[/C][/ROW]
[ROW][C]-2820.74902392690[/C][/ROW]
[/TABLE]
Source: https://freestatistics.org/blog/index.php?pk=35424&T=2

Globally Unique Identifier (entire table): ba.freestatistics.org/blog/index.php?pk=35424&T=2

As an alternative you can also use a QR Code:  

The GUIDs for individual cells are displayed in the table below:

Estimated ARIMA Residuals
Value
22.7819795081356
1092.27579183779
-1298.03169486035
1277.93027291638
-2827.19206575997
-5473.97042000865
-4139.39823662756
-204.271803734054
2031.70179188838
-25.3374732332754
889.479908377309
-508.467003423132
-2234.46617484549
32.5776540820112
-3414.20359127401
2632.91726034497
1744.79114610902
1513.79063841186
-1783.20051100569
3603.92272883378
-1717.41449580073
146.149871428409
-695.229845069721
-1561.76746743795
-239.785079257248
-974.833045514297
-3594.6167627732
1082.04578705985
-1468.75964984061
-2448.51056894491
-2432.90426781894
1028.99141123768
698.541174829409
2158.15484800572
751.248528210065
927.271476072511
3270.89303486009
1536.82409226759
421.0023602197
1238.67406128516
2217.79339869042
-2457.83931623283
3840.55708755119
1464.447876722
1522.93368181558
1444.60120863833
-270.278904725363
796.447550247082
375.580920683491
-2820.74902392690


Parameters (Session):
par1 = FALSE ; par2 = 1 ; par3 = 0 ; par4 = 1 ; par5 = 12 ; par6 = 3 ; par7 = 1 ; par8 = 2 ; par9 = 1 ;
Parameters (R input):
par1 = FALSE ; par2 = 1 ; par3 = 0 ; par4 = 1 ; par5 = 12 ; par6 = 3 ; par7 = 1 ; par8 = 2 ; par9 = 1 ;
R code (references can be found in the software module):
library(lattice)
if (par1 == 'TRUE') par1 <- TRUE
if (par1 == 'FALSE') par1 <- FALSE
par2 <- as.numeric(par2) #Box-Cox lambda transformation parameter
par3 <- as.numeric(par3) #degree of non-seasonal differencing
par4 <- as.numeric(par4) #degree of seasonal differencing
par5 <- as.numeric(par5) #seasonal period
par6 <- as.numeric(par6) #degree (p) of the non-seasonal AR(p) polynomial
par7 <- as.numeric(par7) #degree (q) of the non-seasonal MA(q) polynomial
par8 <- as.numeric(par8) #degree (P) of the seasonal AR(P) polynomial
par9 <- as.numeric(par9) #degree (Q) of the seasonal MA(Q) polynomial
armaGR <- function(arima.out, names, n){
try1 <- arima.out$coef
try2 <- sqrt(diag(arima.out$var.coef))
try.data.frame <- data.frame(matrix(NA,ncol=4,nrow=length(names)))
dimnames(try.data.frame) <- list(names,c('coef','std','tstat','pv'))
try.data.frame[,1] <- try1
for(i in 1:length(try2)) try.data.frame[which(rownames(try.data.frame)==names(try2)[i]),2] <- try2[i]
try.data.frame[,3] <- try.data.frame[,1] / try.data.frame[,2]
try.data.frame[,4] <- round((1-pt(abs(try.data.frame[,3]),df=n-(length(try2)+1)))*2,5)
vector <- rep(NA,length(names))
vector[is.na(try.data.frame[,4])] <- 0
maxi <- which.max(try.data.frame[,4])
continue <- max(try.data.frame[,4],na.rm=TRUE) > .05
vector[maxi] <- 0
list(summary=try.data.frame,next.vector=vector,continue=continue)
}
arimaSelect <- function(series, order=c(13,0,0), seasonal=list(order=c(2,0,0),period=12), include.mean=F){
nrc <- order[1]+order[3]+seasonal$order[1]+seasonal$order[3]
coeff <- matrix(NA, nrow=nrc*2, ncol=nrc)
pval <- matrix(NA, nrow=nrc*2, ncol=nrc)
mylist <- rep(list(NULL), nrc)
names <- NULL
if(order[1] > 0) names <- paste('ar',1:order[1],sep='')
if(order[3] > 0) names <- c( names , paste('ma',1:order[3],sep='') )
if(seasonal$order[1] > 0) names <- c(names, paste('sar',1:seasonal$order[1],sep=''))
if(seasonal$order[3] > 0) names <- c(names, paste('sma',1:seasonal$order[3],sep=''))
arima.out <- arima(series, order=order, seasonal=seasonal, include.mean=include.mean, method='ML')
mylist[[1]] <- arima.out
last.arma <- armaGR(arima.out, names, length(series))
mystop <- FALSE
i <- 1
coeff[i,] <- last.arma[[1]][,1]
pval [i,] <- last.arma[[1]][,4]
i <- 2
aic <- arima.out$aic
while(!mystop){
mylist[[i]] <- arima.out
arima.out <- arima(series, order=order, seasonal=seasonal, include.mean=include.mean, method='ML', fixed=last.arma$next.vector)
aic <- c(aic, arima.out$aic)
last.arma <- armaGR(arima.out, names, length(series))
mystop <- !last.arma$continue
coeff[i,] <- last.arma[[1]][,1]
pval [i,] <- last.arma[[1]][,4]
i <- i+1
}
list(coeff, pval, mylist, aic=aic)
}
arimaSelectplot <- function(arimaSelect.out,noms,choix){
noms <- names(arimaSelect.out[[3]][[1]]$coef)
coeff <- arimaSelect.out[[1]]
k <- min(which(is.na(coeff[,1])))-1
coeff <- coeff[1:k,]
pval <- arimaSelect.out[[2]][1:k,]
aic <- arimaSelect.out$aic[1:k]
coeff[coeff==0] <- NA
n <- ncol(coeff)
if(missing(choix)) choix <- k
layout(matrix(c(1,1,1,2,
3,3,3,2,
3,3,3,4,
5,6,7,7),nr=4),
widths=c(10,35,45,15),
heights=c(30,30,15,15))
couleurs <- rainbow(75)[1:50]#(50)
ticks <- pretty(coeff)
par(mar=c(1,1,3,1))
plot(aic,k:1-.5,type='o',pch=21,bg='blue',cex=2,axes=F,lty=2,xpd=NA)
points(aic[choix],k-choix+.5,pch=21,cex=4,bg=2,xpd=NA)
title('aic',line=2)
par(mar=c(3,0,0,0))
plot(0,axes=F,xlab='',ylab='',xlim=range(ticks),ylim=c(.1,1))
rect(xleft = min(ticks) + (0:49)/50*(max(ticks)-min(ticks)),
xright = min(ticks) + (1:50)/50*(max(ticks)-min(ticks)),
ytop = rep(1,50),
ybottom= rep(0,50),col=couleurs,border=NA)
axis(1,ticks)
rect(xleft=min(ticks),xright=max(ticks),ytop=1,ybottom=0)
text(mean(coeff,na.rm=T),.5,'coefficients',cex=2,font=2)
par(mar=c(1,1,3,1))
image(1:n,1:k,t(coeff[k:1,]),axes=F,col=couleurs,zlim=range(ticks))
for(i in 1:n) for(j in 1:k) if(!is.na(coeff[j,i])) {
if(pval[j,i]<.01) symb = 'green'
else if( (pval[j,i]<.05) & (pval[j,i]>=.01)) symb = 'orange'
else if( (pval[j,i]<.1) & (pval[j,i]>=.05)) symb = 'red'
else symb = 'black'
polygon(c(i+.5 ,i+.2 ,i+.5 ,i+.5),
c(k-j+0.5,k-j+0.5,k-j+0.8,k-j+0.5),
col=symb)
if(j==choix) {
rect(xleft=i-.5,
xright=i+.5,
ybottom=k-j+1.5,
ytop=k-j+.5,
lwd=4)
text(i,
k-j+1,
round(coeff[j,i],2),
cex=1.2,
font=2)
}
else{
rect(xleft=i-.5,xright=i+.5,ybottom=k-j+1.5,ytop=k-j+.5)
text(i,k-j+1,round(coeff[j,i],2),cex=1.2,font=1)
}
}
axis(3,1:n,noms)
par(mar=c(0.5,0,0,0.5))
plot(0,axes=F,xlab='',ylab='',type='n',xlim=c(0,8),ylim=c(-.2,.8))
cols <- c('green','orange','red','black')
niv <- c('0','0.01','0.05','0.1')
for(i in 0:3){
polygon(c(1+2*i ,1+2*i ,1+2*i-.5 ,1+2*i),
c(.4 ,.7 , .4 , .4),
col=cols[i+1])
text(2*i,0.5,niv[i+1],cex=1.5)
}
text(8,.5,1,cex=1.5)
text(4,0,'p-value',cex=2)
box()
residus <- arimaSelect.out[[3]][[choix]]$res
par(mar=c(1,2,4,1))
acf(residus,main='')
title('acf',line=.5)
par(mar=c(1,2,4,1))
pacf(residus,main='')
title('pacf',line=.5)
par(mar=c(2,2,4,1))
qqnorm(residus,main='')
title('qq-norm',line=.5)
qqline(residus)
residus
}
if (par2 == 0) x <- log(x)
if (par2 != 0) x <- x^par2
(selection <- arimaSelect(x, order=c(par6,par3,par7), seasonal=list(order=c(par8,par4,par9), period=par5)))
bitmap(file='test1.png')
resid <- arimaSelectplot(selection)
dev.off()
resid
bitmap(file='test2.png')
acf(resid,length(resid)/2, main='Residual Autocorrelation Function')
dev.off()
bitmap(file='test3.png')
pacf(resid,length(resid)/2, main='Residual Partial Autocorrelation Function')
dev.off()
bitmap(file='test4.png')
cpgram(resid, main='Residual Cumulative Periodogram')
dev.off()
bitmap(file='test5.png')
hist(resid, main='Residual Histogram', xlab='values of Residuals')
dev.off()
bitmap(file='test6.png')
densityplot(~resid,col='black',main='Residual Density Plot', xlab='values of Residuals')
dev.off()
bitmap(file='test7.png')
qqnorm(resid, main='Residual Normal Q-Q Plot')
qqline(resid)
dev.off()
ncols <- length(selection[[1]][1,])
nrows <- length(selection[[2]][,1])-1
load(file='createtable')
a<-table.start()
a<-table.row.start(a)
a<-table.element(a,'ARIMA Parameter Estimation and Backward Selection', ncols+1,TRUE)
a<-table.row.end(a)
a<-table.row.start(a)
a<-table.element(a,'Iteration', header=TRUE)
for (i in 1:ncols) {
a<-table.element(a,names(selection[[3]][[1]]$coef)[i],header=TRUE)
}
a<-table.row.end(a)
for (j in 1:nrows) {
a<-table.row.start(a)
mydum <- 'Estimates ('
mydum <- paste(mydum,j)
mydum <- paste(mydum,')')
a<-table.element(a,mydum, header=TRUE)
for (i in 1:ncols) {
a<-table.element(a,round(selection[[1]][j,i],4))
}
a<-table.row.end(a)
a<-table.row.start(a)
a<-table.element(a,'(p-val)', header=TRUE)
for (i in 1:ncols) {
mydum <- '('
mydum <- paste(mydum,round(selection[[2]][j,i],4),sep='')
mydum <- paste(mydum,')')
a<-table.element(a,mydum)
}
a<-table.row.end(a)
}
a<-table.end(a)
table.save(a,file='mytable.tab')
a<-table.start()
a<-table.row.start(a)
a<-table.element(a,'Estimated ARIMA Residuals', 1,TRUE)
a<-table.row.end(a)
a<-table.row.start(a)
a<-table.element(a,'Value', 1,TRUE)
a<-table.row.end(a)
for (i in (par4*par5+par3):length(resid)) {
a<-table.row.start(a)
a<-table.element(a,resid[i])
a<-table.row.end(a)
}
a<-table.end(a)
table.save(a,file='mytable1.tab')