Free Statistics

of Irreproducible Research!

Author's title

Author*The author of this computation has been verified*
R Software Modulerwasp_centraltendency.wasp
Title produced by softwareCentral Tendency
Date of computationSat, 20 Dec 2008 05:03:40 -0700
Cite this page as followsStatistical Computations at FreeStatistics.org, Office for Research Development and Education, URL https://freestatistics.org/blog/index.php?v=date/2008/Dec/20/t12297780079d1m9qbylv6pr9j.htm/, Retrieved Sun, 19 May 2024 08:53:51 +0000
Statistical Computations at FreeStatistics.org, Office for Research Development and Education, URL https://freestatistics.org/blog/index.php?pk=35346, Retrieved Sun, 19 May 2024 08:53:51 +0000
QR Codes:

Original text written by user:
IsPrivate?No (this computation is public)
User-defined keywords
Estimated Impact151
Family? (F = Feedback message, R = changed R code, M = changed R Module, P = changed Parameters, D = changed Data)
-       [Central Tendency] [] [2008-12-20 12:03:40] [f6a332ba2d530c028d935c5a5bbb53af] [Current]
-    D    [Central Tendency] [aantal faillissem...] [2008-12-22 10:25:05] [d2d412c7f4d35ffbf5ee5ee89db327d4]
Feedback Forum

Post a new message
Dataseries X:
655362
873127
1107897
1555964
1671159
1493308
2957796
2638691
1305669
1280496
921901
867888
652586
913831
1108544
1555827
1699283
1509458
3268975
2425016
1312703
1365498
934453
775019
651142
843192
1146766
1652601
1465906
1652734
2922334
2702805
1458956
1410363
1019279
936574
708917
885295
1099663
1576220
1487870
1488635
2882530
2677026
1404398
1344370
936865
872705
628151
953712
1160384
1400618
1661511
1495347
2918786
2775677
1407026
1370199
964526
850851
683118
847224
1073256
1514326
1503734
1507712
2865698
2788128
1391596
1366378
946295
859626


Summary of computational transaction
Raw Inputview raw input (R code)
Raw Outputview raw output of R engine
Computing time2 seconds
R Server'Sir Ronald Aylmer Fisher' @ 193.190.124.24

\begin{tabular}{lllllllll}
\hline
Summary of computational transaction \tabularnewline
Raw Input & view raw input (R code)  \tabularnewline
Raw Output & view raw output of R engine  \tabularnewline
Computing time & 2 seconds \tabularnewline
R Server & 'Sir Ronald Aylmer Fisher' @ 193.190.124.24 \tabularnewline
\hline
\end{tabular}
%Source: https://freestatistics.org/blog/index.php?pk=35346&T=0

[TABLE]
[ROW][C]Summary of computational transaction[/C][/ROW]
[ROW][C]Raw Input[/C][C]view raw input (R code) [/C][/ROW]
[ROW][C]Raw Output[/C][C]view raw output of R engine [/C][/ROW]
[ROW][C]Computing time[/C][C]2 seconds[/C][/ROW]
[ROW][C]R Server[/C][C]'Sir Ronald Aylmer Fisher' @ 193.190.124.24[/C][/ROW]
[/TABLE]
Source: https://freestatistics.org/blog/index.php?pk=35346&T=0

Globally Unique Identifier (entire table): ba.freestatistics.org/blog/index.php?pk=35346&T=0

As an alternative you can also use a QR Code:  

The GUIDs for individual cells are displayed in the table below:

Summary of computational transaction
Raw Inputview raw input (R code)
Raw Outputview raw output of R engine
Computing time2 seconds
R Server'Sir Ronald Aylmer Fisher' @ 193.190.124.24


Central Tendency - Ungrouped Data
MeasureValueS.E.Value/S.E.
Arithmetic Mean1458492.7222222280643.278486595518.0857319989124
Geometric Mean1325283.82422712
Harmonic Mean1215709.26841541
Quadratic Mean1609017.72665652
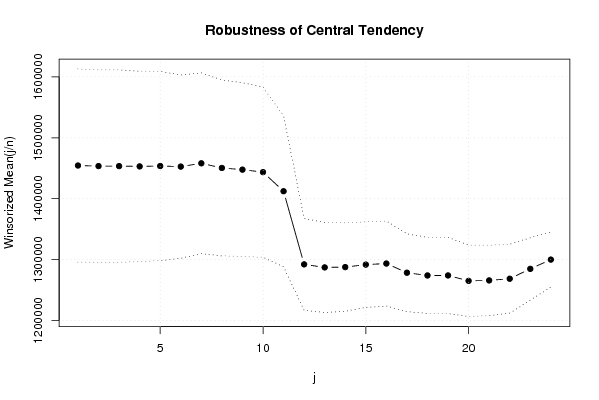
Winsorized Mean ( 1 / 24 )1454490.1111111179336.455277649818.3331875116037
Winsorized Mean ( 2 / 24 )1453545.1666666779070.423566533418.3829186831608
Winsorized Mean ( 3 / 24 )145351379015.299624634318.3953361805243
Winsorized Mean ( 4 / 24 )1453040.7777777878276.683669535718.562881175602
Winsorized Mean ( 5 / 24 )1453663.4861111177731.832339511818.7010062976761
Winsorized Mean ( 6 / 24 )1452707.8194444475377.30361735819.2724832241135
Winsorized Mean ( 7 / 24 )1458125.2361111174268.690191864419.6331082767747
Winsorized Mean ( 8 / 24 )1450476.3472222272215.516553475920.0853835359349
Winsorized Mean ( 9 / 24 )1447707.3472222271377.773150189820.2823271633317
Winsorized Mean ( 10 / 24 )1443601.7916666769947.909600228120.6382406553284
Winsorized Mean ( 11 / 24 )1412219.2562108.745089885322.73784871931
Winsorized Mean ( 12 / 24 )1292066.5833333337781.83184947134.1980925774361
Winsorized Mean ( 13 / 24 )1287064.8333333337013.210451809334.7731206675270
Winsorized Mean ( 14 / 24 )1287554.8333333336369.619344508935.4019331667195
Winsorized Mean ( 15 / 24 )1291671.2916666735192.325931627136.7032089375443
Winsorized Mean ( 16 / 24 )1293435.0694444434918.077431920537.041989839396
Winsorized Mean ( 17 / 24 )1278364.3333333331976.881510218439.9777674669378
Winsorized Mean ( 18 / 24 )1273830.5833333331242.065702295340.7729308129502
Winsorized Mean ( 19 / 24 )1273871.2222222231225.793411744840.795479731288
Winsorized Mean ( 20 / 24 )1264962.6111111129403.933893307843.0201827993842
Winsorized Mean ( 21 / 24 )1265706.0694444428905.269657187843.7880734016852
Winsorized Mean ( 22 / 24 )1268476.8472222228341.133914653744.757448697787
Winsorized Mean ( 23 / 24 )1284696.6388888925588.206420287550.206591966146
Winsorized Mean ( 24 / 24 )1299893.3055555622665.883790372857.350214868201
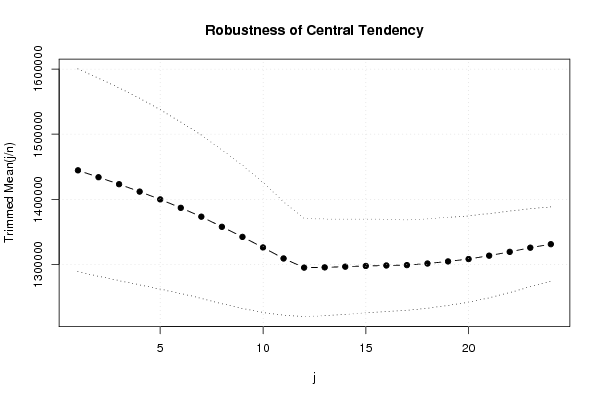
Trimmed Mean ( 1 / 24 )1444490.7142857177838.326278252218.5575767536680
Trimmed Mean ( 2 / 24 )1433903.1176470676030.974598885218.8594599136979
Trimmed Mean ( 3 / 24 )1423189.2727272774017.971445107419.2276179006436
Trimmed Mean ( 4 / 24 )1411817.87571597.432934597319.7188337225675
Trimmed Mean ( 5 / 24 )1399849.9354838768922.986297703920.310349430267
Trimmed Mean ( 6 / 24 )1386934.6833333365806.218375443421.0760429268321
Trimmed Mean ( 7 / 24 )1373326.4482758662662.489236308621.9162447105615
Trimmed Mean ( 8 / 24 )1357751.1607142958996.158373185723.0142300474160
Trimmed Mean ( 9 / 24 )1342296.9629629654935.891396069624.4338797251044
Trimmed Mean ( 10 / 24 )1326079.9807692349889.33019336826.5804326421987
Trimmed Mean ( 11 / 24 )1309156.8443546.063857392830.0637238829967
Trimmed Mean ( 12 / 24 )1295102.87537641.551323757434.4062035026329
Trimmed Mean ( 13 / 24 )1295498.9130434837136.040112738334.8852195632754
Trimmed Mean ( 14 / 24 )1296560.5454545536604.991118751335.4203212684395
Trimmed Mean ( 15 / 24 )1297663.2857142936008.4481026836.0377454205727
Trimmed Mean ( 16 / 24 )1298382.32535439.877185340736.6361970785006
Trimmed Mean ( 17 / 24 )1298968.1842105334691.429200184737.4434900538375
Trimmed Mean ( 18 / 24 )1301392.1666666734297.518556856837.9442076694056
Trimmed Mean ( 19 / 24 )1304634.7058823533827.526401509138.5672511314381
Trimmed Mean ( 20 / 24 )1308277.7533073.865108354739.5562401223411
Trimmed Mean ( 21 / 24 )1313475.5666666732356.342042293540.5940685430324
Trimmed Mean ( 22 / 24 )1319324.8928571431329.336326088642.1114855139307
Trimmed Mean ( 23 / 24 )1325725.3461538529861.155176013844.3963181711987
Trimmed Mean ( 24 / 24 )1331076.9166666728656.947560625746.4486635867509
Median1368288.5
Midrange1948563
Midmean - Weighted Average at Xnp1291474.89189189
Midmean - Weighted Average at X(n+1)p1301392.16666667
Midmean - Empirical Distribution Function1291474.89189189
Midmean - Empirical Distribution Function - Averaging1301392.16666667
Midmean - Empirical Distribution Function - Interpolation1301392.16666667
Midmean - Closest Observation1291474.89189189
Midmean - True Basic - Statistics Graphics Toolkit1301392.16666667
Midmean - MS Excel (old versions)1298968.18421053
Number of observations72

\begin{tabular}{lllllllll}
\hline
Central Tendency - Ungrouped Data \tabularnewline
Measure & Value & S.E. & Value/S.E. \tabularnewline
Arithmetic Mean & 1458492.72222222 & 80643.2784865955 & 18.0857319989124 \tabularnewline
Geometric Mean & 1325283.82422712 &  &  \tabularnewline
Harmonic Mean & 1215709.26841541 &  &  \tabularnewline
Quadratic Mean & 1609017.72665652 &  &  \tabularnewline
Winsorized Mean ( 1 / 24 ) & 1454490.11111111 & 79336.4552776498 & 18.3331875116037 \tabularnewline
Winsorized Mean ( 2 / 24 ) & 1453545.16666667 & 79070.4235665334 & 18.3829186831608 \tabularnewline
Winsorized Mean ( 3 / 24 ) & 1453513 & 79015.2996246343 & 18.3953361805243 \tabularnewline
Winsorized Mean ( 4 / 24 ) & 1453040.77777778 & 78276.6836695357 & 18.562881175602 \tabularnewline
Winsorized Mean ( 5 / 24 ) & 1453663.48611111 & 77731.8323395118 & 18.7010062976761 \tabularnewline
Winsorized Mean ( 6 / 24 ) & 1452707.81944444 & 75377.303617358 & 19.2724832241135 \tabularnewline
Winsorized Mean ( 7 / 24 ) & 1458125.23611111 & 74268.6901918644 & 19.6331082767747 \tabularnewline
Winsorized Mean ( 8 / 24 ) & 1450476.34722222 & 72215.5165534759 & 20.0853835359349 \tabularnewline
Winsorized Mean ( 9 / 24 ) & 1447707.34722222 & 71377.7731501898 & 20.2823271633317 \tabularnewline
Winsorized Mean ( 10 / 24 ) & 1443601.79166667 & 69947.9096002281 & 20.6382406553284 \tabularnewline
Winsorized Mean ( 11 / 24 ) & 1412219.25 & 62108.7450898853 & 22.73784871931 \tabularnewline
Winsorized Mean ( 12 / 24 ) & 1292066.58333333 & 37781.831849471 & 34.1980925774361 \tabularnewline
Winsorized Mean ( 13 / 24 ) & 1287064.83333333 & 37013.2104518093 & 34.7731206675270 \tabularnewline
Winsorized Mean ( 14 / 24 ) & 1287554.83333333 & 36369.6193445089 & 35.4019331667195 \tabularnewline
Winsorized Mean ( 15 / 24 ) & 1291671.29166667 & 35192.3259316271 & 36.7032089375443 \tabularnewline
Winsorized Mean ( 16 / 24 ) & 1293435.06944444 & 34918.0774319205 & 37.041989839396 \tabularnewline
Winsorized Mean ( 17 / 24 ) & 1278364.33333333 & 31976.8815102184 & 39.9777674669378 \tabularnewline
Winsorized Mean ( 18 / 24 ) & 1273830.58333333 & 31242.0657022953 & 40.7729308129502 \tabularnewline
Winsorized Mean ( 19 / 24 ) & 1273871.22222222 & 31225.7934117448 & 40.795479731288 \tabularnewline
Winsorized Mean ( 20 / 24 ) & 1264962.61111111 & 29403.9338933078 & 43.0201827993842 \tabularnewline
Winsorized Mean ( 21 / 24 ) & 1265706.06944444 & 28905.2696571878 & 43.7880734016852 \tabularnewline
Winsorized Mean ( 22 / 24 ) & 1268476.84722222 & 28341.1339146537 & 44.757448697787 \tabularnewline
Winsorized Mean ( 23 / 24 ) & 1284696.63888889 & 25588.2064202875 & 50.206591966146 \tabularnewline
Winsorized Mean ( 24 / 24 ) & 1299893.30555556 & 22665.8837903728 & 57.350214868201 \tabularnewline
Trimmed Mean ( 1 / 24 ) & 1444490.71428571 & 77838.3262782522 & 18.5575767536680 \tabularnewline
Trimmed Mean ( 2 / 24 ) & 1433903.11764706 & 76030.9745988852 & 18.8594599136979 \tabularnewline
Trimmed Mean ( 3 / 24 ) & 1423189.27272727 & 74017.9714451074 & 19.2276179006436 \tabularnewline
Trimmed Mean ( 4 / 24 ) & 1411817.875 & 71597.4329345973 & 19.7188337225675 \tabularnewline
Trimmed Mean ( 5 / 24 ) & 1399849.93548387 & 68922.9862977039 & 20.310349430267 \tabularnewline
Trimmed Mean ( 6 / 24 ) & 1386934.68333333 & 65806.2183754434 & 21.0760429268321 \tabularnewline
Trimmed Mean ( 7 / 24 ) & 1373326.44827586 & 62662.4892363086 & 21.9162447105615 \tabularnewline
Trimmed Mean ( 8 / 24 ) & 1357751.16071429 & 58996.1583731857 & 23.0142300474160 \tabularnewline
Trimmed Mean ( 9 / 24 ) & 1342296.96296296 & 54935.8913960696 & 24.4338797251044 \tabularnewline
Trimmed Mean ( 10 / 24 ) & 1326079.98076923 & 49889.330193368 & 26.5804326421987 \tabularnewline
Trimmed Mean ( 11 / 24 ) & 1309156.84 & 43546.0638573928 & 30.0637238829967 \tabularnewline
Trimmed Mean ( 12 / 24 ) & 1295102.875 & 37641.5513237574 & 34.4062035026329 \tabularnewline
Trimmed Mean ( 13 / 24 ) & 1295498.91304348 & 37136.0401127383 & 34.8852195632754 \tabularnewline
Trimmed Mean ( 14 / 24 ) & 1296560.54545455 & 36604.9911187513 & 35.4203212684395 \tabularnewline
Trimmed Mean ( 15 / 24 ) & 1297663.28571429 & 36008.44810268 & 36.0377454205727 \tabularnewline
Trimmed Mean ( 16 / 24 ) & 1298382.325 & 35439.8771853407 & 36.6361970785006 \tabularnewline
Trimmed Mean ( 17 / 24 ) & 1298968.18421053 & 34691.4292001847 & 37.4434900538375 \tabularnewline
Trimmed Mean ( 18 / 24 ) & 1301392.16666667 & 34297.5185568568 & 37.9442076694056 \tabularnewline
Trimmed Mean ( 19 / 24 ) & 1304634.70588235 & 33827.5264015091 & 38.5672511314381 \tabularnewline
Trimmed Mean ( 20 / 24 ) & 1308277.75 & 33073.8651083547 & 39.5562401223411 \tabularnewline
Trimmed Mean ( 21 / 24 ) & 1313475.56666667 & 32356.3420422935 & 40.5940685430324 \tabularnewline
Trimmed Mean ( 22 / 24 ) & 1319324.89285714 & 31329.3363260886 & 42.1114855139307 \tabularnewline
Trimmed Mean ( 23 / 24 ) & 1325725.34615385 & 29861.1551760138 & 44.3963181711987 \tabularnewline
Trimmed Mean ( 24 / 24 ) & 1331076.91666667 & 28656.9475606257 & 46.4486635867509 \tabularnewline
Median & 1368288.5 &  &  \tabularnewline
Midrange & 1948563 &  &  \tabularnewline
Midmean - Weighted Average at Xnp & 1291474.89189189 &  &  \tabularnewline
Midmean - Weighted Average at X(n+1)p & 1301392.16666667 &  &  \tabularnewline
Midmean - Empirical Distribution Function & 1291474.89189189 &  &  \tabularnewline
Midmean - Empirical Distribution Function - Averaging & 1301392.16666667 &  &  \tabularnewline
Midmean - Empirical Distribution Function - Interpolation & 1301392.16666667 &  &  \tabularnewline
Midmean - Closest Observation & 1291474.89189189 &  &  \tabularnewline
Midmean - True Basic - Statistics Graphics Toolkit & 1301392.16666667 &  &  \tabularnewline
Midmean - MS Excel (old versions) & 1298968.18421053 &  &  \tabularnewline
Number of observations & 72 &  &  \tabularnewline
\hline
\end{tabular}
%Source: https://freestatistics.org/blog/index.php?pk=35346&T=1

[TABLE]
[ROW][C]Central Tendency - Ungrouped Data[/C][/ROW]
[ROW][C]Measure[/C][C]Value[/C][C]S.E.[/C][C]Value/S.E.[/C][/ROW]
[ROW][C]Arithmetic Mean[/C][C]1458492.72222222[/C][C]80643.2784865955[/C][C]18.0857319989124[/C][/ROW]
[ROW][C]Geometric Mean[/C][C]1325283.82422712[/C][C][/C][C][/C][/ROW]
[ROW][C]Harmonic Mean[/C][C]1215709.26841541[/C][C][/C][C][/C][/ROW]
[ROW][C]Quadratic Mean[/C][C]1609017.72665652[/C][C][/C][C][/C][/ROW]
[ROW][C]Winsorized Mean ( 1 / 24 )[/C][C]1454490.11111111[/C][C]79336.4552776498[/C][C]18.3331875116037[/C][/ROW]
[ROW][C]Winsorized Mean ( 2 / 24 )[/C][C]1453545.16666667[/C][C]79070.4235665334[/C][C]18.3829186831608[/C][/ROW]
[ROW][C]Winsorized Mean ( 3 / 24 )[/C][C]1453513[/C][C]79015.2996246343[/C][C]18.3953361805243[/C][/ROW]
[ROW][C]Winsorized Mean ( 4 / 24 )[/C][C]1453040.77777778[/C][C]78276.6836695357[/C][C]18.562881175602[/C][/ROW]
[ROW][C]Winsorized Mean ( 5 / 24 )[/C][C]1453663.48611111[/C][C]77731.8323395118[/C][C]18.7010062976761[/C][/ROW]
[ROW][C]Winsorized Mean ( 6 / 24 )[/C][C]1452707.81944444[/C][C]75377.303617358[/C][C]19.2724832241135[/C][/ROW]
[ROW][C]Winsorized Mean ( 7 / 24 )[/C][C]1458125.23611111[/C][C]74268.6901918644[/C][C]19.6331082767747[/C][/ROW]
[ROW][C]Winsorized Mean ( 8 / 24 )[/C][C]1450476.34722222[/C][C]72215.5165534759[/C][C]20.0853835359349[/C][/ROW]
[ROW][C]Winsorized Mean ( 9 / 24 )[/C][C]1447707.34722222[/C][C]71377.7731501898[/C][C]20.2823271633317[/C][/ROW]
[ROW][C]Winsorized Mean ( 10 / 24 )[/C][C]1443601.79166667[/C][C]69947.9096002281[/C][C]20.6382406553284[/C][/ROW]
[ROW][C]Winsorized Mean ( 11 / 24 )[/C][C]1412219.25[/C][C]62108.7450898853[/C][C]22.73784871931[/C][/ROW]
[ROW][C]Winsorized Mean ( 12 / 24 )[/C][C]1292066.58333333[/C][C]37781.831849471[/C][C]34.1980925774361[/C][/ROW]
[ROW][C]Winsorized Mean ( 13 / 24 )[/C][C]1287064.83333333[/C][C]37013.2104518093[/C][C]34.7731206675270[/C][/ROW]
[ROW][C]Winsorized Mean ( 14 / 24 )[/C][C]1287554.83333333[/C][C]36369.6193445089[/C][C]35.4019331667195[/C][/ROW]
[ROW][C]Winsorized Mean ( 15 / 24 )[/C][C]1291671.29166667[/C][C]35192.3259316271[/C][C]36.7032089375443[/C][/ROW]
[ROW][C]Winsorized Mean ( 16 / 24 )[/C][C]1293435.06944444[/C][C]34918.0774319205[/C][C]37.041989839396[/C][/ROW]
[ROW][C]Winsorized Mean ( 17 / 24 )[/C][C]1278364.33333333[/C][C]31976.8815102184[/C][C]39.9777674669378[/C][/ROW]
[ROW][C]Winsorized Mean ( 18 / 24 )[/C][C]1273830.58333333[/C][C]31242.0657022953[/C][C]40.7729308129502[/C][/ROW]
[ROW][C]Winsorized Mean ( 19 / 24 )[/C][C]1273871.22222222[/C][C]31225.7934117448[/C][C]40.795479731288[/C][/ROW]
[ROW][C]Winsorized Mean ( 20 / 24 )[/C][C]1264962.61111111[/C][C]29403.9338933078[/C][C]43.0201827993842[/C][/ROW]
[ROW][C]Winsorized Mean ( 21 / 24 )[/C][C]1265706.06944444[/C][C]28905.2696571878[/C][C]43.7880734016852[/C][/ROW]
[ROW][C]Winsorized Mean ( 22 / 24 )[/C][C]1268476.84722222[/C][C]28341.1339146537[/C][C]44.757448697787[/C][/ROW]
[ROW][C]Winsorized Mean ( 23 / 24 )[/C][C]1284696.63888889[/C][C]25588.2064202875[/C][C]50.206591966146[/C][/ROW]
[ROW][C]Winsorized Mean ( 24 / 24 )[/C][C]1299893.30555556[/C][C]22665.8837903728[/C][C]57.350214868201[/C][/ROW]
[ROW][C]Trimmed Mean ( 1 / 24 )[/C][C]1444490.71428571[/C][C]77838.3262782522[/C][C]18.5575767536680[/C][/ROW]
[ROW][C]Trimmed Mean ( 2 / 24 )[/C][C]1433903.11764706[/C][C]76030.9745988852[/C][C]18.8594599136979[/C][/ROW]
[ROW][C]Trimmed Mean ( 3 / 24 )[/C][C]1423189.27272727[/C][C]74017.9714451074[/C][C]19.2276179006436[/C][/ROW]
[ROW][C]Trimmed Mean ( 4 / 24 )[/C][C]1411817.875[/C][C]71597.4329345973[/C][C]19.7188337225675[/C][/ROW]
[ROW][C]Trimmed Mean ( 5 / 24 )[/C][C]1399849.93548387[/C][C]68922.9862977039[/C][C]20.310349430267[/C][/ROW]
[ROW][C]Trimmed Mean ( 6 / 24 )[/C][C]1386934.68333333[/C][C]65806.2183754434[/C][C]21.0760429268321[/C][/ROW]
[ROW][C]Trimmed Mean ( 7 / 24 )[/C][C]1373326.44827586[/C][C]62662.4892363086[/C][C]21.9162447105615[/C][/ROW]
[ROW][C]Trimmed Mean ( 8 / 24 )[/C][C]1357751.16071429[/C][C]58996.1583731857[/C][C]23.0142300474160[/C][/ROW]
[ROW][C]Trimmed Mean ( 9 / 24 )[/C][C]1342296.96296296[/C][C]54935.8913960696[/C][C]24.4338797251044[/C][/ROW]
[ROW][C]Trimmed Mean ( 10 / 24 )[/C][C]1326079.98076923[/C][C]49889.330193368[/C][C]26.5804326421987[/C][/ROW]
[ROW][C]Trimmed Mean ( 11 / 24 )[/C][C]1309156.84[/C][C]43546.0638573928[/C][C]30.0637238829967[/C][/ROW]
[ROW][C]Trimmed Mean ( 12 / 24 )[/C][C]1295102.875[/C][C]37641.5513237574[/C][C]34.4062035026329[/C][/ROW]
[ROW][C]Trimmed Mean ( 13 / 24 )[/C][C]1295498.91304348[/C][C]37136.0401127383[/C][C]34.8852195632754[/C][/ROW]
[ROW][C]Trimmed Mean ( 14 / 24 )[/C][C]1296560.54545455[/C][C]36604.9911187513[/C][C]35.4203212684395[/C][/ROW]
[ROW][C]Trimmed Mean ( 15 / 24 )[/C][C]1297663.28571429[/C][C]36008.44810268[/C][C]36.0377454205727[/C][/ROW]
[ROW][C]Trimmed Mean ( 16 / 24 )[/C][C]1298382.325[/C][C]35439.8771853407[/C][C]36.6361970785006[/C][/ROW]
[ROW][C]Trimmed Mean ( 17 / 24 )[/C][C]1298968.18421053[/C][C]34691.4292001847[/C][C]37.4434900538375[/C][/ROW]
[ROW][C]Trimmed Mean ( 18 / 24 )[/C][C]1301392.16666667[/C][C]34297.5185568568[/C][C]37.9442076694056[/C][/ROW]
[ROW][C]Trimmed Mean ( 19 / 24 )[/C][C]1304634.70588235[/C][C]33827.5264015091[/C][C]38.5672511314381[/C][/ROW]
[ROW][C]Trimmed Mean ( 20 / 24 )[/C][C]1308277.75[/C][C]33073.8651083547[/C][C]39.5562401223411[/C][/ROW]
[ROW][C]Trimmed Mean ( 21 / 24 )[/C][C]1313475.56666667[/C][C]32356.3420422935[/C][C]40.5940685430324[/C][/ROW]
[ROW][C]Trimmed Mean ( 22 / 24 )[/C][C]1319324.89285714[/C][C]31329.3363260886[/C][C]42.1114855139307[/C][/ROW]
[ROW][C]Trimmed Mean ( 23 / 24 )[/C][C]1325725.34615385[/C][C]29861.1551760138[/C][C]44.3963181711987[/C][/ROW]
[ROW][C]Trimmed Mean ( 24 / 24 )[/C][C]1331076.91666667[/C][C]28656.9475606257[/C][C]46.4486635867509[/C][/ROW]
[ROW][C]Median[/C][C]1368288.5[/C][C][/C][C][/C][/ROW]
[ROW][C]Midrange[/C][C]1948563[/C][C][/C][C][/C][/ROW]
[ROW][C]Midmean - Weighted Average at Xnp[/C][C]1291474.89189189[/C][C][/C][C][/C][/ROW]
[ROW][C]Midmean - Weighted Average at X(n+1)p[/C][C]1301392.16666667[/C][C][/C][C][/C][/ROW]
[ROW][C]Midmean - Empirical Distribution Function[/C][C]1291474.89189189[/C][C][/C][C][/C][/ROW]
[ROW][C]Midmean - Empirical Distribution Function - Averaging[/C][C]1301392.16666667[/C][C][/C][C][/C][/ROW]
[ROW][C]Midmean - Empirical Distribution Function - Interpolation[/C][C]1301392.16666667[/C][C][/C][C][/C][/ROW]
[ROW][C]Midmean - Closest Observation[/C][C]1291474.89189189[/C][C][/C][C][/C][/ROW]
[ROW][C]Midmean - True Basic - Statistics Graphics Toolkit[/C][C]1301392.16666667[/C][C][/C][C][/C][/ROW]
[ROW][C]Midmean - MS Excel (old versions)[/C][C]1298968.18421053[/C][C][/C][C][/C][/ROW]
[ROW][C]Number of observations[/C][C]72[/C][C][/C][C][/C][/ROW]
[/TABLE]
Source: https://freestatistics.org/blog/index.php?pk=35346&T=1

Globally Unique Identifier (entire table): ba.freestatistics.org/blog/index.php?pk=35346&T=1

As an alternative you can also use a QR Code:  

The GUIDs for individual cells are displayed in the table below:

Central Tendency - Ungrouped Data
MeasureValueS.E.Value/S.E.
Arithmetic Mean1458492.7222222280643.278486595518.0857319989124
Geometric Mean1325283.82422712
Harmonic Mean1215709.26841541
Quadratic Mean1609017.72665652
Winsorized Mean ( 1 / 24 )1454490.1111111179336.455277649818.3331875116037
Winsorized Mean ( 2 / 24 )1453545.1666666779070.423566533418.3829186831608
Winsorized Mean ( 3 / 24 )145351379015.299624634318.3953361805243
Winsorized Mean ( 4 / 24 )1453040.7777777878276.683669535718.562881175602
Winsorized Mean ( 5 / 24 )1453663.4861111177731.832339511818.7010062976761
Winsorized Mean ( 6 / 24 )1452707.8194444475377.30361735819.2724832241135
Winsorized Mean ( 7 / 24 )1458125.2361111174268.690191864419.6331082767747
Winsorized Mean ( 8 / 24 )1450476.3472222272215.516553475920.0853835359349
Winsorized Mean ( 9 / 24 )1447707.3472222271377.773150189820.2823271633317
Winsorized Mean ( 10 / 24 )1443601.7916666769947.909600228120.6382406553284
Winsorized Mean ( 11 / 24 )1412219.2562108.745089885322.73784871931
Winsorized Mean ( 12 / 24 )1292066.5833333337781.83184947134.1980925774361
Winsorized Mean ( 13 / 24 )1287064.8333333337013.210451809334.7731206675270
Winsorized Mean ( 14 / 24 )1287554.8333333336369.619344508935.4019331667195
Winsorized Mean ( 15 / 24 )1291671.2916666735192.325931627136.7032089375443
Winsorized Mean ( 16 / 24 )1293435.0694444434918.077431920537.041989839396
Winsorized Mean ( 17 / 24 )1278364.3333333331976.881510218439.9777674669378
Winsorized Mean ( 18 / 24 )1273830.5833333331242.065702295340.7729308129502
Winsorized Mean ( 19 / 24 )1273871.2222222231225.793411744840.795479731288
Winsorized Mean ( 20 / 24 )1264962.6111111129403.933893307843.0201827993842
Winsorized Mean ( 21 / 24 )1265706.0694444428905.269657187843.7880734016852
Winsorized Mean ( 22 / 24 )1268476.8472222228341.133914653744.757448697787
Winsorized Mean ( 23 / 24 )1284696.6388888925588.206420287550.206591966146
Winsorized Mean ( 24 / 24 )1299893.3055555622665.883790372857.350214868201
Trimmed Mean ( 1 / 24 )1444490.7142857177838.326278252218.5575767536680
Trimmed Mean ( 2 / 24 )1433903.1176470676030.974598885218.8594599136979
Trimmed Mean ( 3 / 24 )1423189.2727272774017.971445107419.2276179006436
Trimmed Mean ( 4 / 24 )1411817.87571597.432934597319.7188337225675
Trimmed Mean ( 5 / 24 )1399849.9354838768922.986297703920.310349430267
Trimmed Mean ( 6 / 24 )1386934.6833333365806.218375443421.0760429268321
Trimmed Mean ( 7 / 24 )1373326.4482758662662.489236308621.9162447105615
Trimmed Mean ( 8 / 24 )1357751.1607142958996.158373185723.0142300474160
Trimmed Mean ( 9 / 24 )1342296.9629629654935.891396069624.4338797251044
Trimmed Mean ( 10 / 24 )1326079.9807692349889.33019336826.5804326421987
Trimmed Mean ( 11 / 24 )1309156.8443546.063857392830.0637238829967
Trimmed Mean ( 12 / 24 )1295102.87537641.551323757434.4062035026329
Trimmed Mean ( 13 / 24 )1295498.9130434837136.040112738334.8852195632754
Trimmed Mean ( 14 / 24 )1296560.5454545536604.991118751335.4203212684395
Trimmed Mean ( 15 / 24 )1297663.2857142936008.4481026836.0377454205727
Trimmed Mean ( 16 / 24 )1298382.32535439.877185340736.6361970785006
Trimmed Mean ( 17 / 24 )1298968.1842105334691.429200184737.4434900538375
Trimmed Mean ( 18 / 24 )1301392.1666666734297.518556856837.9442076694056
Trimmed Mean ( 19 / 24 )1304634.7058823533827.526401509138.5672511314381
Trimmed Mean ( 20 / 24 )1308277.7533073.865108354739.5562401223411
Trimmed Mean ( 21 / 24 )1313475.5666666732356.342042293540.5940685430324
Trimmed Mean ( 22 / 24 )1319324.8928571431329.336326088642.1114855139307
Trimmed Mean ( 23 / 24 )1325725.3461538529861.155176013844.3963181711987
Trimmed Mean ( 24 / 24 )1331076.9166666728656.947560625746.4486635867509
Median1368288.5
Midrange1948563
Midmean - Weighted Average at Xnp1291474.89189189
Midmean - Weighted Average at X(n+1)p1301392.16666667
Midmean - Empirical Distribution Function1291474.89189189
Midmean - Empirical Distribution Function - Averaging1301392.16666667
Midmean - Empirical Distribution Function - Interpolation1301392.16666667
Midmean - Closest Observation1291474.89189189
Midmean - True Basic - Statistics Graphics Toolkit1301392.16666667
Midmean - MS Excel (old versions)1298968.18421053
Number of observations72


Parameters (Session):
Parameters (R input):
R code (references can be found in the software module):
geomean <- function(x) {
return(exp(mean(log(x))))
}
harmean <- function(x) {
return(1/mean(1/x))
}
quamean <- function(x) {
return(sqrt(mean(x*x)))
}
winmean <- function(x) {
x <-sort(x[!is.na(x)])
n<-length(x)
denom <- 3
nodenom <- n/denom
if (nodenom>40) denom <- n/40
sqrtn = sqrt(n)
roundnodenom = floor(nodenom)
win <- array(NA,dim=c(roundnodenom,2))
for (j in 1:roundnodenom) {
win[j,1] <- (j*x[j+1]+sum(x[(j+1):(n-j)])+j*x[n-j])/n
win[j,2] <- sd(c(rep(x[j+1],j),x[(j+1):(n-j)],rep(x[n-j],j)))/sqrtn
}
return(win)
}
trimean <- function(x) {
x <-sort(x[!is.na(x)])
n<-length(x)
denom <- 3
nodenom <- n/denom
if (nodenom>40) denom <- n/40
sqrtn = sqrt(n)
roundnodenom = floor(nodenom)
tri <- array(NA,dim=c(roundnodenom,2))
for (j in 1:roundnodenom) {
tri[j,1] <- mean(x,trim=j/n)
tri[j,2] <- sd(x[(j+1):(n-j)]) / sqrt(n-j*2)
}
return(tri)
}
midrange <- function(x) {
return((max(x)+min(x))/2)
}
q1 <- function(data,n,p,i,f) {
np <- n*p;
i <<- floor(np)
f <<- np - i
qvalue <- (1-f)*data[i] + f*data[i+1]
}
q2 <- function(data,n,p,i,f) {
np <- (n+1)*p
i <<- floor(np)
f <<- np - i
qvalue <- (1-f)*data[i] + f*data[i+1]
}
q3 <- function(data,n,p,i,f) {
np <- n*p
i <<- floor(np)
f <<- np - i
if (f==0) {
qvalue <- data[i]
} else {
qvalue <- data[i+1]
}
}
q4 <- function(data,n,p,i,f) {
np <- n*p
i <<- floor(np)
f <<- np - i
if (f==0) {
qvalue <- (data[i]+data[i+1])/2
} else {
qvalue <- data[i+1]
}
}
q5 <- function(data,n,p,i,f) {
np <- (n-1)*p
i <<- floor(np)
f <<- np - i
if (f==0) {
qvalue <- data[i+1]
} else {
qvalue <- data[i+1] + f*(data[i+2]-data[i+1])
}
}
q6 <- function(data,n,p,i,f) {
np <- n*p+0.5
i <<- floor(np)
f <<- np - i
qvalue <- data[i]
}
q7 <- function(data,n,p,i,f) {
np <- (n+1)*p
i <<- floor(np)
f <<- np - i
if (f==0) {
qvalue <- data[i]
} else {
qvalue <- f*data[i] + (1-f)*data[i+1]
}
}
q8 <- function(data,n,p,i,f) {
np <- (n+1)*p
i <<- floor(np)
f <<- np - i
if (f==0) {
qvalue <- data[i]
} else {
if (f == 0.5) {
qvalue <- (data[i]+data[i+1])/2
} else {
if (f < 0.5) {
qvalue <- data[i]
} else {
qvalue <- data[i+1]
}
}
}
}
midmean <- function(x,def) {
x <-sort(x[!is.na(x)])
n<-length(x)
if (def==1) {
qvalue1 <- q1(x,n,0.25,i,f)
qvalue3 <- q1(x,n,0.75,i,f)
}
if (def==2) {
qvalue1 <- q2(x,n,0.25,i,f)
qvalue3 <- q2(x,n,0.75,i,f)
}
if (def==3) {
qvalue1 <- q3(x,n,0.25,i,f)
qvalue3 <- q3(x,n,0.75,i,f)
}
if (def==4) {
qvalue1 <- q4(x,n,0.25,i,f)
qvalue3 <- q4(x,n,0.75,i,f)
}
if (def==5) {
qvalue1 <- q5(x,n,0.25,i,f)
qvalue3 <- q5(x,n,0.75,i,f)
}
if (def==6) {
qvalue1 <- q6(x,n,0.25,i,f)
qvalue3 <- q6(x,n,0.75,i,f)
}
if (def==7) {
qvalue1 <- q7(x,n,0.25,i,f)
qvalue3 <- q7(x,n,0.75,i,f)
}
if (def==8) {
qvalue1 <- q8(x,n,0.25,i,f)
qvalue3 <- q8(x,n,0.75,i,f)
}
midm <- 0
myn <- 0
roundno4 <- round(n/4)
round3no4 <- round(3*n/4)
for (i in 1:n) {
if ((x[i]>=qvalue1) & (x[i]<=qvalue3)){
midm = midm + x[i]
myn = myn + 1
}
}
midm = midm / myn
return(midm)
}
(arm <- mean(x))
sqrtn <- sqrt(length(x))
(armse <- sd(x) / sqrtn)
(armose <- arm / armse)
(geo <- geomean(x))
(har <- harmean(x))
(qua <- quamean(x))
(win <- winmean(x))
(tri <- trimean(x))
(midr <- midrange(x))
midm <- array(NA,dim=8)
for (j in 1:8) midm[j] <- midmean(x,j)
midm
bitmap(file='test1.png')
lb <- win[,1] - 2*win[,2]
ub <- win[,1] + 2*win[,2]
if ((ylimmin == '') | (ylimmax == '')) plot(win[,1],type='b',main=main, xlab='j', pch=19, ylab='Winsorized Mean(j/n)', ylim=c(min(lb),max(ub))) else plot(win[,1],type='l',main=main, xlab='j', pch=19, ylab='Winsorized Mean(j/n)', ylim=c(ylimmin,ylimmax))
lines(ub,lty=3)
lines(lb,lty=3)
grid()
dev.off()
bitmap(file='test2.png')
lb <- tri[,1] - 2*tri[,2]
ub <- tri[,1] + 2*tri[,2]
if ((ylimmin == '') | (ylimmax == '')) plot(tri[,1],type='b',main=main, xlab='j', pch=19, ylab='Trimmed Mean(j/n)', ylim=c(min(lb),max(ub))) else plot(tri[,1],type='l',main=main, xlab='j', pch=19, ylab='Trimmed Mean(j/n)', ylim=c(ylimmin,ylimmax))
lines(ub,lty=3)
lines(lb,lty=3)
grid()
dev.off()
load(file='createtable')
a<-table.start()
a<-table.row.start(a)
a<-table.element(a,'Central Tendency - Ungrouped Data',4,TRUE)
a<-table.row.end(a)
a<-table.row.start(a)
a<-table.element(a,'Measure',header=TRUE)
a<-table.element(a,'Value',header=TRUE)
a<-table.element(a,'S.E.',header=TRUE)
a<-table.element(a,'Value/S.E.',header=TRUE)
a<-table.row.end(a)
a<-table.row.start(a)
a<-table.element(a,hyperlink('arithmetic_mean.htm', 'Arithmetic Mean', 'click to view the definition of the Arithmetic Mean'),header=TRUE)
a<-table.element(a,arm)
a<-table.element(a,hyperlink('arithmetic_mean_standard_error.htm', armse, 'click to view the definition of the Standard Error of the Arithmetic Mean'))
a<-table.element(a,armose)
a<-table.row.end(a)
a<-table.row.start(a)
a<-table.element(a,hyperlink('geometric_mean.htm', 'Geometric Mean', 'click to view the definition of the Geometric Mean'),header=TRUE)
a<-table.element(a,geo)
a<-table.element(a,'')
a<-table.row.end(a)
a<-table.row.start(a)
a<-table.element(a,hyperlink('harmonic_mean.htm', 'Harmonic Mean', 'click to view the definition of the Harmonic Mean'),header=TRUE)
a<-table.element(a,har)
a<-table.element(a,'')
a<-table.row.end(a)
a<-table.row.start(a)
a<-table.element(a,hyperlink('quadratic_mean.htm', 'Quadratic Mean', 'click to view the definition of the Quadratic Mean'),header=TRUE)
a<-table.element(a,qua)
a<-table.element(a,'')
a<-table.row.end(a)
for (j in 1:length(win[,1])) {
a<-table.row.start(a)
mylabel <- paste('Winsorized Mean (',j)
mylabel <- paste(mylabel,'/')
mylabel <- paste(mylabel,length(win[,1]))
mylabel <- paste(mylabel,')')
a<-table.element(a,hyperlink('winsorized_mean.htm', mylabel, 'click to view the definition of the Winsorized Mean'),header=TRUE)
a<-table.element(a,win[j,1])
a<-table.element(a,win[j,2])
a<-table.element(a,win[j,1]/win[j,2])
a<-table.row.end(a)
}
for (j in 1:length(tri[,1])) {
a<-table.row.start(a)
mylabel <- paste('Trimmed Mean (',j)
mylabel <- paste(mylabel,'/')
mylabel <- paste(mylabel,length(tri[,1]))
mylabel <- paste(mylabel,')')
a<-table.element(a,hyperlink('arithmetic_mean.htm', mylabel, 'click to view the definition of the Trimmed Mean'),header=TRUE)
a<-table.element(a,tri[j,1])
a<-table.element(a,tri[j,2])
a<-table.element(a,tri[j,1]/tri[j,2])
a<-table.row.end(a)
}
a<-table.row.start(a)
a<-table.element(a,hyperlink('median_1.htm', 'Median', 'click to view the definition of the Median'),header=TRUE)
a<-table.element(a,median(x))
a<-table.element(a,'')
a<-table.row.end(a)
a<-table.row.start(a)
a<-table.element(a,hyperlink('midrange.htm', 'Midrange', 'click to view the definition of the Midrange'),header=TRUE)
a<-table.element(a,midr)
a<-table.element(a,'')
a<-table.row.end(a)
a<-table.row.start(a)
mymid <- hyperlink('midmean.htm', 'Midmean', 'click to view the definition of the Midmean')
mylabel <- paste(mymid,hyperlink('method_1.htm','Weighted Average at Xnp',''),sep=' - ')
a<-table.element(a,mylabel,header=TRUE)
a<-table.element(a,midm[1])
a<-table.element(a,'')
a<-table.row.end(a)
a<-table.row.start(a)
mymid <- hyperlink('midmean.htm', 'Midmean', 'click to view the definition of the Midmean')
mylabel <- paste(mymid,hyperlink('method_2.htm','Weighted Average at X(n+1)p',''),sep=' - ')
a<-table.element(a,mylabel,header=TRUE)
a<-table.element(a,midm[2])
a<-table.element(a,'')
a<-table.row.end(a)
a<-table.row.start(a)
mymid <- hyperlink('midmean.htm', 'Midmean', 'click to view the definition of the Midmean')
mylabel <- paste(mymid,hyperlink('method_3.htm','Empirical Distribution Function',''),sep=' - ')
a<-table.element(a,mylabel,header=TRUE)
a<-table.element(a,midm[3])
a<-table.element(a,'')
a<-table.row.end(a)
a<-table.row.start(a)
mymid <- hyperlink('midmean.htm', 'Midmean', 'click to view the definition of the Midmean')
mylabel <- paste(mymid,hyperlink('method_4.htm','Empirical Distribution Function - Averaging',''),sep=' - ')
a<-table.element(a,mylabel,header=TRUE)
a<-table.element(a,midm[4])
a<-table.element(a,'')
a<-table.row.end(a)
a<-table.row.start(a)
mymid <- hyperlink('midmean.htm', 'Midmean', 'click to view the definition of the Midmean')
mylabel <- paste(mymid,hyperlink('method_5.htm','Empirical Distribution Function - Interpolation',''),sep=' - ')
a<-table.element(a,mylabel,header=TRUE)
a<-table.element(a,midm[5])
a<-table.element(a,'')
a<-table.row.end(a)
a<-table.row.start(a)
mymid <- hyperlink('midmean.htm', 'Midmean', 'click to view the definition of the Midmean')
mylabel <- paste(mymid,hyperlink('method_6.htm','Closest Observation',''),sep=' - ')
a<-table.element(a,mylabel,header=TRUE)
a<-table.element(a,midm[6])
a<-table.element(a,'')
a<-table.row.end(a)
a<-table.row.start(a)
mymid <- hyperlink('midmean.htm', 'Midmean', 'click to view the definition of the Midmean')
mylabel <- paste(mymid,hyperlink('method_7.htm','True Basic - Statistics Graphics Toolkit',''),sep=' - ')
a<-table.element(a,mylabel,header=TRUE)
a<-table.element(a,midm[7])
a<-table.element(a,'')
a<-table.row.end(a)
a<-table.row.start(a)
mymid <- hyperlink('midmean.htm', 'Midmean', 'click to view the definition of the Midmean')
mylabel <- paste(mymid,hyperlink('method_8.htm','MS Excel (old versions)',''),sep=' - ')
a<-table.element(a,mylabel,header=TRUE)
a<-table.element(a,midm[8])
a<-table.element(a,'')
a<-table.row.end(a)
a<-table.row.start(a)
a<-table.element(a,'Number of observations',header=TRUE)
a<-table.element(a,length(x))
a<-table.element(a,'')
a<-table.row.end(a)
a<-table.end(a)
table.save(a,file='mytable.tab')