Free Statistics

of Irreproducible Research!

Author's title

Author*The author of this computation has been verified*
R Software Modulerwasp_autocorrelation.wasp
Title produced by software(Partial) Autocorrelation Function
Date of computationFri, 19 Dec 2008 19:19:45 -0700
Cite this page as followsStatistical Computations at FreeStatistics.org, Office for Research Development and Education, URL https://freestatistics.org/blog/index.php?v=date/2008/Dec/20/t12297398757ddqawcxaz63iqr.htm/, Retrieved Sun, 19 May 2024 11:39:11 +0000
Statistical Computations at FreeStatistics.org, Office for Research Development and Education, URL https://freestatistics.org/blog/index.php?pk=35287, Retrieved Sun, 19 May 2024 11:39:11 +0000
QR Codes:

Original text written by user:
IsPrivate?No (this computation is public)
User-defined keywords
Estimated Impact213
Family? (F = Feedback message, R = changed R code, M = changed R Module, P = changed Parameters, D = changed Data)
-     [Multiple Regression] [Werkloosheid- Azië] [2008-12-17 14:33:28] [5e74953d94072114d25d7276793b561e]
- RMPD    [(Partial) Autocorrelation Function] [voeding] [2008-12-20 02:19:45] [5925747fb2a6bb4cfcd8015825ee5e92] [Current]
Feedback Forum

Post a new message
Dataseries X:
99.2
93.6
104.2
95.3
102.7
103.1
100
107.2
107
119
110.4
101.7
102.4
98.8
105.6
104.4
106.3
107.2
108.5
106.9
114.2
125.9
110.6
110.5
106.7
104.7
107.4
109.8
103.4
114.8
114.3
109.6
118.3
127.3
112.3
114.9
108.2
105.4
122.1
113.5
110
125.3
114.3
115.6
127.1
123
122.2
126.4
112.7
105.8
120.9
116.3
115.7
127.9
108.3
121.1
128.6
123.1
127.7
126.6
118.4
110
129.6
115.8
125.9
128.4
114
125.6
128.5
136.6
133.1
124.6


Summary of computational transaction
Raw Inputview raw input (R code)
Raw Outputview raw output of R engine
Computing time1 seconds
R Server'Gwilym Jenkins' @ 72.249.127.135

\begin{tabular}{lllllllll}
\hline
Summary of computational transaction \tabularnewline
Raw Input & view raw input (R code)  \tabularnewline
Raw Output & view raw output of R engine  \tabularnewline
Computing time & 1 seconds \tabularnewline
R Server & 'Gwilym Jenkins' @ 72.249.127.135 \tabularnewline
\hline
\end{tabular}
%Source: https://freestatistics.org/blog/index.php?pk=35287&T=0

[TABLE]
[ROW][C]Summary of computational transaction[/C][/ROW]
[ROW][C]Raw Input[/C][C]view raw input (R code) [/C][/ROW]
[ROW][C]Raw Output[/C][C]view raw output of R engine [/C][/ROW]
[ROW][C]Computing time[/C][C]1 seconds[/C][/ROW]
[ROW][C]R Server[/C][C]'Gwilym Jenkins' @ 72.249.127.135[/C][/ROW]
[/TABLE]
Source: https://freestatistics.org/blog/index.php?pk=35287&T=0

Globally Unique Identifier (entire table): ba.freestatistics.org/blog/index.php?pk=35287&T=0

As an alternative you can also use a QR Code:  

The GUIDs for individual cells are displayed in the table below:

Summary of computational transaction
Raw Inputview raw input (R code)
Raw Outputview raw output of R engine
Computing time1 seconds
R Server'Gwilym Jenkins' @ 72.249.127.135


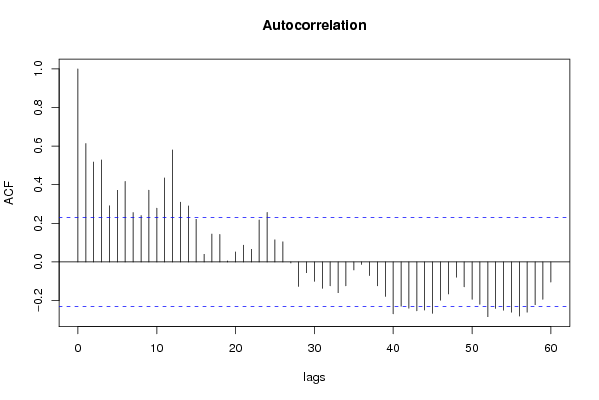
Autocorrelation Function
Time lag kACF(k)T-STATP-value
10.6130325.20181e-06
20.5174824.3911.9e-05
30.528184.48181.4e-05
40.2903222.46350.008076
50.370683.14530.001206
60.4167533.53630.000357
70.2558392.17090.016619
80.2402262.03840.022593
90.3714233.15160.001183
100.2785222.36330.010407
110.4352543.69330.000214
120.5804464.92523e-06
130.3094772.6260.005274
140.2899272.46010.008145
150.2206461.87220.032617
160.0394130.33440.369514
170.1440191.2220.112839
180.1422661.20720.115659
190.0046590.03950.484286
200.0516110.43790.331372
210.0865070.7340.232656
220.0654390.55530.290216
230.2176481.84680.034442
240.256372.17540.016443
250.1141170.96830.168064
260.1037260.88010.190855
27-0.005726-0.04860.480693
28-0.127096-1.07840.142218
29-0.056173-0.47660.317529
30-0.100737-0.85480.197754
31-0.136674-1.15970.124997
32-0.124255-1.05430.147627
33-0.159319-1.35190.090325
34-0.124176-1.05370.147778
35-0.041787-0.35460.361973
36-0.012946-0.10990.456416
37-0.070754-0.60040.275075
38-0.124321-1.05490.1475
39-0.17942-1.52240.066141
40-0.268972-2.28230.012714
41-0.229391-1.94640.027752
42-0.239894-2.03560.022738
43-0.253536-2.15130.017403
44-0.249879-2.12030.018714
45-0.266679-2.26280.013331
46-0.198258-1.68230.048424
47-0.16596-1.40820.081685
48-0.079143-0.67160.252008
49-0.129068-1.09520.138544
50-0.194114-1.64710.051946
51-0.219957-1.86640.033029
52-0.283844-2.40850.00929
53-0.241284-2.04740.022136
54-0.250251-2.12340.018577
55-0.260791-2.21290.015038
56-0.280744-2.38220.009927
57-0.260485-2.21030.015132
58-0.221528-1.87970.032096
59-0.194251-1.64830.051827
60-0.104734-0.88870.188563

\begin{tabular}{lllllllll}
\hline
Autocorrelation Function \tabularnewline
Time lag k & ACF(k) & T-STAT & P-value \tabularnewline
1 & 0.613032 & 5.2018 & 1e-06 \tabularnewline
2 & 0.517482 & 4.391 & 1.9e-05 \tabularnewline
3 & 0.52818 & 4.4818 & 1.4e-05 \tabularnewline
4 & 0.290322 & 2.4635 & 0.008076 \tabularnewline
5 & 0.37068 & 3.1453 & 0.001206 \tabularnewline
6 & 0.416753 & 3.5363 & 0.000357 \tabularnewline
7 & 0.255839 & 2.1709 & 0.016619 \tabularnewline
8 & 0.240226 & 2.0384 & 0.022593 \tabularnewline
9 & 0.371423 & 3.1516 & 0.001183 \tabularnewline
10 & 0.278522 & 2.3633 & 0.010407 \tabularnewline
11 & 0.435254 & 3.6933 & 0.000214 \tabularnewline
12 & 0.580446 & 4.9252 & 3e-06 \tabularnewline
13 & 0.309477 & 2.626 & 0.005274 \tabularnewline
14 & 0.289927 & 2.4601 & 0.008145 \tabularnewline
15 & 0.220646 & 1.8722 & 0.032617 \tabularnewline
16 & 0.039413 & 0.3344 & 0.369514 \tabularnewline
17 & 0.144019 & 1.222 & 0.112839 \tabularnewline
18 & 0.142266 & 1.2072 & 0.115659 \tabularnewline
19 & 0.004659 & 0.0395 & 0.484286 \tabularnewline
20 & 0.051611 & 0.4379 & 0.331372 \tabularnewline
21 & 0.086507 & 0.734 & 0.232656 \tabularnewline
22 & 0.065439 & 0.5553 & 0.290216 \tabularnewline
23 & 0.217648 & 1.8468 & 0.034442 \tabularnewline
24 & 0.25637 & 2.1754 & 0.016443 \tabularnewline
25 & 0.114117 & 0.9683 & 0.168064 \tabularnewline
26 & 0.103726 & 0.8801 & 0.190855 \tabularnewline
27 & -0.005726 & -0.0486 & 0.480693 \tabularnewline
28 & -0.127096 & -1.0784 & 0.142218 \tabularnewline
29 & -0.056173 & -0.4766 & 0.317529 \tabularnewline
30 & -0.100737 & -0.8548 & 0.197754 \tabularnewline
31 & -0.136674 & -1.1597 & 0.124997 \tabularnewline
32 & -0.124255 & -1.0543 & 0.147627 \tabularnewline
33 & -0.159319 & -1.3519 & 0.090325 \tabularnewline
34 & -0.124176 & -1.0537 & 0.147778 \tabularnewline
35 & -0.041787 & -0.3546 & 0.361973 \tabularnewline
36 & -0.012946 & -0.1099 & 0.456416 \tabularnewline
37 & -0.070754 & -0.6004 & 0.275075 \tabularnewline
38 & -0.124321 & -1.0549 & 0.1475 \tabularnewline
39 & -0.17942 & -1.5224 & 0.066141 \tabularnewline
40 & -0.268972 & -2.2823 & 0.012714 \tabularnewline
41 & -0.229391 & -1.9464 & 0.027752 \tabularnewline
42 & -0.239894 & -2.0356 & 0.022738 \tabularnewline
43 & -0.253536 & -2.1513 & 0.017403 \tabularnewline
44 & -0.249879 & -2.1203 & 0.018714 \tabularnewline
45 & -0.266679 & -2.2628 & 0.013331 \tabularnewline
46 & -0.198258 & -1.6823 & 0.048424 \tabularnewline
47 & -0.16596 & -1.4082 & 0.081685 \tabularnewline
48 & -0.079143 & -0.6716 & 0.252008 \tabularnewline
49 & -0.129068 & -1.0952 & 0.138544 \tabularnewline
50 & -0.194114 & -1.6471 & 0.051946 \tabularnewline
51 & -0.219957 & -1.8664 & 0.033029 \tabularnewline
52 & -0.283844 & -2.4085 & 0.00929 \tabularnewline
53 & -0.241284 & -2.0474 & 0.022136 \tabularnewline
54 & -0.250251 & -2.1234 & 0.018577 \tabularnewline
55 & -0.260791 & -2.2129 & 0.015038 \tabularnewline
56 & -0.280744 & -2.3822 & 0.009927 \tabularnewline
57 & -0.260485 & -2.2103 & 0.015132 \tabularnewline
58 & -0.221528 & -1.8797 & 0.032096 \tabularnewline
59 & -0.194251 & -1.6483 & 0.051827 \tabularnewline
60 & -0.104734 & -0.8887 & 0.188563 \tabularnewline
\hline
\end{tabular}
%Source: https://freestatistics.org/blog/index.php?pk=35287&T=1

[TABLE]
[ROW][C]Autocorrelation Function[/C][/ROW]
[ROW][C]Time lag k[/C][C]ACF(k)[/C][C]T-STAT[/C][C]P-value[/C][/ROW]
[ROW][C]1[/C][C]0.613032[/C][C]5.2018[/C][C]1e-06[/C][/ROW]
[ROW][C]2[/C][C]0.517482[/C][C]4.391[/C][C]1.9e-05[/C][/ROW]
[ROW][C]3[/C][C]0.52818[/C][C]4.4818[/C][C]1.4e-05[/C][/ROW]
[ROW][C]4[/C][C]0.290322[/C][C]2.4635[/C][C]0.008076[/C][/ROW]
[ROW][C]5[/C][C]0.37068[/C][C]3.1453[/C][C]0.001206[/C][/ROW]
[ROW][C]6[/C][C]0.416753[/C][C]3.5363[/C][C]0.000357[/C][/ROW]
[ROW][C]7[/C][C]0.255839[/C][C]2.1709[/C][C]0.016619[/C][/ROW]
[ROW][C]8[/C][C]0.240226[/C][C]2.0384[/C][C]0.022593[/C][/ROW]
[ROW][C]9[/C][C]0.371423[/C][C]3.1516[/C][C]0.001183[/C][/ROW]
[ROW][C]10[/C][C]0.278522[/C][C]2.3633[/C][C]0.010407[/C][/ROW]
[ROW][C]11[/C][C]0.435254[/C][C]3.6933[/C][C]0.000214[/C][/ROW]
[ROW][C]12[/C][C]0.580446[/C][C]4.9252[/C][C]3e-06[/C][/ROW]
[ROW][C]13[/C][C]0.309477[/C][C]2.626[/C][C]0.005274[/C][/ROW]
[ROW][C]14[/C][C]0.289927[/C][C]2.4601[/C][C]0.008145[/C][/ROW]
[ROW][C]15[/C][C]0.220646[/C][C]1.8722[/C][C]0.032617[/C][/ROW]
[ROW][C]16[/C][C]0.039413[/C][C]0.3344[/C][C]0.369514[/C][/ROW]
[ROW][C]17[/C][C]0.144019[/C][C]1.222[/C][C]0.112839[/C][/ROW]
[ROW][C]18[/C][C]0.142266[/C][C]1.2072[/C][C]0.115659[/C][/ROW]
[ROW][C]19[/C][C]0.004659[/C][C]0.0395[/C][C]0.484286[/C][/ROW]
[ROW][C]20[/C][C]0.051611[/C][C]0.4379[/C][C]0.331372[/C][/ROW]
[ROW][C]21[/C][C]0.086507[/C][C]0.734[/C][C]0.232656[/C][/ROW]
[ROW][C]22[/C][C]0.065439[/C][C]0.5553[/C][C]0.290216[/C][/ROW]
[ROW][C]23[/C][C]0.217648[/C][C]1.8468[/C][C]0.034442[/C][/ROW]
[ROW][C]24[/C][C]0.25637[/C][C]2.1754[/C][C]0.016443[/C][/ROW]
[ROW][C]25[/C][C]0.114117[/C][C]0.9683[/C][C]0.168064[/C][/ROW]
[ROW][C]26[/C][C]0.103726[/C][C]0.8801[/C][C]0.190855[/C][/ROW]
[ROW][C]27[/C][C]-0.005726[/C][C]-0.0486[/C][C]0.480693[/C][/ROW]
[ROW][C]28[/C][C]-0.127096[/C][C]-1.0784[/C][C]0.142218[/C][/ROW]
[ROW][C]29[/C][C]-0.056173[/C][C]-0.4766[/C][C]0.317529[/C][/ROW]
[ROW][C]30[/C][C]-0.100737[/C][C]-0.8548[/C][C]0.197754[/C][/ROW]
[ROW][C]31[/C][C]-0.136674[/C][C]-1.1597[/C][C]0.124997[/C][/ROW]
[ROW][C]32[/C][C]-0.124255[/C][C]-1.0543[/C][C]0.147627[/C][/ROW]
[ROW][C]33[/C][C]-0.159319[/C][C]-1.3519[/C][C]0.090325[/C][/ROW]
[ROW][C]34[/C][C]-0.124176[/C][C]-1.0537[/C][C]0.147778[/C][/ROW]
[ROW][C]35[/C][C]-0.041787[/C][C]-0.3546[/C][C]0.361973[/C][/ROW]
[ROW][C]36[/C][C]-0.012946[/C][C]-0.1099[/C][C]0.456416[/C][/ROW]
[ROW][C]37[/C][C]-0.070754[/C][C]-0.6004[/C][C]0.275075[/C][/ROW]
[ROW][C]38[/C][C]-0.124321[/C][C]-1.0549[/C][C]0.1475[/C][/ROW]
[ROW][C]39[/C][C]-0.17942[/C][C]-1.5224[/C][C]0.066141[/C][/ROW]
[ROW][C]40[/C][C]-0.268972[/C][C]-2.2823[/C][C]0.012714[/C][/ROW]
[ROW][C]41[/C][C]-0.229391[/C][C]-1.9464[/C][C]0.027752[/C][/ROW]
[ROW][C]42[/C][C]-0.239894[/C][C]-2.0356[/C][C]0.022738[/C][/ROW]
[ROW][C]43[/C][C]-0.253536[/C][C]-2.1513[/C][C]0.017403[/C][/ROW]
[ROW][C]44[/C][C]-0.249879[/C][C]-2.1203[/C][C]0.018714[/C][/ROW]
[ROW][C]45[/C][C]-0.266679[/C][C]-2.2628[/C][C]0.013331[/C][/ROW]
[ROW][C]46[/C][C]-0.198258[/C][C]-1.6823[/C][C]0.048424[/C][/ROW]
[ROW][C]47[/C][C]-0.16596[/C][C]-1.4082[/C][C]0.081685[/C][/ROW]
[ROW][C]48[/C][C]-0.079143[/C][C]-0.6716[/C][C]0.252008[/C][/ROW]
[ROW][C]49[/C][C]-0.129068[/C][C]-1.0952[/C][C]0.138544[/C][/ROW]
[ROW][C]50[/C][C]-0.194114[/C][C]-1.6471[/C][C]0.051946[/C][/ROW]
[ROW][C]51[/C][C]-0.219957[/C][C]-1.8664[/C][C]0.033029[/C][/ROW]
[ROW][C]52[/C][C]-0.283844[/C][C]-2.4085[/C][C]0.00929[/C][/ROW]
[ROW][C]53[/C][C]-0.241284[/C][C]-2.0474[/C][C]0.022136[/C][/ROW]
[ROW][C]54[/C][C]-0.250251[/C][C]-2.1234[/C][C]0.018577[/C][/ROW]
[ROW][C]55[/C][C]-0.260791[/C][C]-2.2129[/C][C]0.015038[/C][/ROW]
[ROW][C]56[/C][C]-0.280744[/C][C]-2.3822[/C][C]0.009927[/C][/ROW]
[ROW][C]57[/C][C]-0.260485[/C][C]-2.2103[/C][C]0.015132[/C][/ROW]
[ROW][C]58[/C][C]-0.221528[/C][C]-1.8797[/C][C]0.032096[/C][/ROW]
[ROW][C]59[/C][C]-0.194251[/C][C]-1.6483[/C][C]0.051827[/C][/ROW]
[ROW][C]60[/C][C]-0.104734[/C][C]-0.8887[/C][C]0.188563[/C][/ROW]
[/TABLE]
Source: https://freestatistics.org/blog/index.php?pk=35287&T=1

Globally Unique Identifier (entire table): ba.freestatistics.org/blog/index.php?pk=35287&T=1

As an alternative you can also use a QR Code:  

The GUIDs for individual cells are displayed in the table below:

Autocorrelation Function
Time lag kACF(k)T-STATP-value
10.6130325.20181e-06
20.5174824.3911.9e-05
30.528184.48181.4e-05
40.2903222.46350.008076
50.370683.14530.001206
60.4167533.53630.000357
70.2558392.17090.016619
80.2402262.03840.022593
90.3714233.15160.001183
100.2785222.36330.010407
110.4352543.69330.000214
120.5804464.92523e-06
130.3094772.6260.005274
140.2899272.46010.008145
150.2206461.87220.032617
160.0394130.33440.369514
170.1440191.2220.112839
180.1422661.20720.115659
190.0046590.03950.484286
200.0516110.43790.331372
210.0865070.7340.232656
220.0654390.55530.290216
230.2176481.84680.034442
240.256372.17540.016443
250.1141170.96830.168064
260.1037260.88010.190855
27-0.005726-0.04860.480693
28-0.127096-1.07840.142218
29-0.056173-0.47660.317529
30-0.100737-0.85480.197754
31-0.136674-1.15970.124997
32-0.124255-1.05430.147627
33-0.159319-1.35190.090325
34-0.124176-1.05370.147778
35-0.041787-0.35460.361973
36-0.012946-0.10990.456416
37-0.070754-0.60040.275075
38-0.124321-1.05490.1475
39-0.17942-1.52240.066141
40-0.268972-2.28230.012714
41-0.229391-1.94640.027752
42-0.239894-2.03560.022738
43-0.253536-2.15130.017403
44-0.249879-2.12030.018714
45-0.266679-2.26280.013331
46-0.198258-1.68230.048424
47-0.16596-1.40820.081685
48-0.079143-0.67160.252008
49-0.129068-1.09520.138544
50-0.194114-1.64710.051946
51-0.219957-1.86640.033029
52-0.283844-2.40850.00929
53-0.241284-2.04740.022136
54-0.250251-2.12340.018577
55-0.260791-2.21290.015038
56-0.280744-2.38220.009927
57-0.260485-2.21030.015132
58-0.221528-1.87970.032096
59-0.194251-1.64830.051827
60-0.104734-0.88870.188563


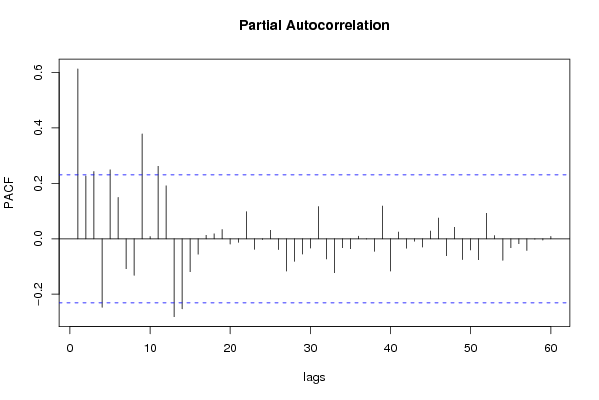
Partial Autocorrelation Function
Time lag kPACF(k)T-STATP-value
10.6130325.20181e-06
20.2269721.92590.029032
30.2429052.06110.021452
4-0.247087-2.09660.019771
50.2489592.11250.019057
60.1494561.26820.10441
7-0.108009-0.91650.181235
8-0.131579-1.11650.133964
90.3786963.21330.000982
100.0080050.06790.473016
110.2614462.21840.014839
120.1913111.62330.054445
13-0.280881-2.38340.009898
14-0.252607-2.14340.017728
15-0.118709-1.00730.158587
16-0.055654-0.47220.319091
170.0124380.10550.45812
180.0180450.15310.439368
190.03340.28340.388838
20-0.019091-0.1620.435884
21-0.012617-0.10710.457521
220.0979610.83120.204296
23-0.037873-0.32140.374432
24-0.002834-0.0240.490442
250.0307710.26110.397379
26-0.038694-0.32830.371808
27-0.116404-0.98770.163299
28-0.081104-0.68820.246772
29-0.054844-0.46540.321536
30-0.033325-0.28280.389081
310.1164020.98770.163302
32-0.0726-0.6160.269909
33-0.1222-1.03690.151626
34-0.03203-0.27180.393282
35-0.035825-0.3040.381008
360.009650.08190.467484
37-0.000947-0.0080.496805
38-0.045176-0.38330.351302
390.1182891.00370.159438
40-0.116435-0.9880.163234
410.0242170.20550.418887
42-0.03392-0.28780.387154
43-0.008613-0.07310.470969
44-0.029725-0.25220.400792
450.0278940.23670.406785
460.0749730.63620.263343
47-0.06105-0.5180.303015
480.0414450.35170.363057
49-0.074829-0.63490.26374
50-0.039924-0.33880.367887
51-0.075533-0.64090.261806
520.091890.77970.219059
530.0118270.10040.460172
54-0.077742-0.65970.255787
55-0.032043-0.27190.393242
56-0.017644-0.14970.440704
57-0.041918-0.35570.361559
58-0.001301-0.0110.495612
59-0.004478-0.0380.484896
600.0085890.07290.471053

\begin{tabular}{lllllllll}
\hline
Partial Autocorrelation Function \tabularnewline
Time lag k & PACF(k) & T-STAT & P-value \tabularnewline
1 & 0.613032 & 5.2018 & 1e-06 \tabularnewline
2 & 0.226972 & 1.9259 & 0.029032 \tabularnewline
3 & 0.242905 & 2.0611 & 0.021452 \tabularnewline
4 & -0.247087 & -2.0966 & 0.019771 \tabularnewline
5 & 0.248959 & 2.1125 & 0.019057 \tabularnewline
6 & 0.149456 & 1.2682 & 0.10441 \tabularnewline
7 & -0.108009 & -0.9165 & 0.181235 \tabularnewline
8 & -0.131579 & -1.1165 & 0.133964 \tabularnewline
9 & 0.378696 & 3.2133 & 0.000982 \tabularnewline
10 & 0.008005 & 0.0679 & 0.473016 \tabularnewline
11 & 0.261446 & 2.2184 & 0.014839 \tabularnewline
12 & 0.191311 & 1.6233 & 0.054445 \tabularnewline
13 & -0.280881 & -2.3834 & 0.009898 \tabularnewline
14 & -0.252607 & -2.1434 & 0.017728 \tabularnewline
15 & -0.118709 & -1.0073 & 0.158587 \tabularnewline
16 & -0.055654 & -0.4722 & 0.319091 \tabularnewline
17 & 0.012438 & 0.1055 & 0.45812 \tabularnewline
18 & 0.018045 & 0.1531 & 0.439368 \tabularnewline
19 & 0.0334 & 0.2834 & 0.388838 \tabularnewline
20 & -0.019091 & -0.162 & 0.435884 \tabularnewline
21 & -0.012617 & -0.1071 & 0.457521 \tabularnewline
22 & 0.097961 & 0.8312 & 0.204296 \tabularnewline
23 & -0.037873 & -0.3214 & 0.374432 \tabularnewline
24 & -0.002834 & -0.024 & 0.490442 \tabularnewline
25 & 0.030771 & 0.2611 & 0.397379 \tabularnewline
26 & -0.038694 & -0.3283 & 0.371808 \tabularnewline
27 & -0.116404 & -0.9877 & 0.163299 \tabularnewline
28 & -0.081104 & -0.6882 & 0.246772 \tabularnewline
29 & -0.054844 & -0.4654 & 0.321536 \tabularnewline
30 & -0.033325 & -0.2828 & 0.389081 \tabularnewline
31 & 0.116402 & 0.9877 & 0.163302 \tabularnewline
32 & -0.0726 & -0.616 & 0.269909 \tabularnewline
33 & -0.1222 & -1.0369 & 0.151626 \tabularnewline
34 & -0.03203 & -0.2718 & 0.393282 \tabularnewline
35 & -0.035825 & -0.304 & 0.381008 \tabularnewline
36 & 0.00965 & 0.0819 & 0.467484 \tabularnewline
37 & -0.000947 & -0.008 & 0.496805 \tabularnewline
38 & -0.045176 & -0.3833 & 0.351302 \tabularnewline
39 & 0.118289 & 1.0037 & 0.159438 \tabularnewline
40 & -0.116435 & -0.988 & 0.163234 \tabularnewline
41 & 0.024217 & 0.2055 & 0.418887 \tabularnewline
42 & -0.03392 & -0.2878 & 0.387154 \tabularnewline
43 & -0.008613 & -0.0731 & 0.470969 \tabularnewline
44 & -0.029725 & -0.2522 & 0.400792 \tabularnewline
45 & 0.027894 & 0.2367 & 0.406785 \tabularnewline
46 & 0.074973 & 0.6362 & 0.263343 \tabularnewline
47 & -0.06105 & -0.518 & 0.303015 \tabularnewline
48 & 0.041445 & 0.3517 & 0.363057 \tabularnewline
49 & -0.074829 & -0.6349 & 0.26374 \tabularnewline
50 & -0.039924 & -0.3388 & 0.367887 \tabularnewline
51 & -0.075533 & -0.6409 & 0.261806 \tabularnewline
52 & 0.09189 & 0.7797 & 0.219059 \tabularnewline
53 & 0.011827 & 0.1004 & 0.460172 \tabularnewline
54 & -0.077742 & -0.6597 & 0.255787 \tabularnewline
55 & -0.032043 & -0.2719 & 0.393242 \tabularnewline
56 & -0.017644 & -0.1497 & 0.440704 \tabularnewline
57 & -0.041918 & -0.3557 & 0.361559 \tabularnewline
58 & -0.001301 & -0.011 & 0.495612 \tabularnewline
59 & -0.004478 & -0.038 & 0.484896 \tabularnewline
60 & 0.008589 & 0.0729 & 0.471053 \tabularnewline
\hline
\end{tabular}
%Source: https://freestatistics.org/blog/index.php?pk=35287&T=2

[TABLE]
[ROW][C]Partial Autocorrelation Function[/C][/ROW]
[ROW][C]Time lag k[/C][C]PACF(k)[/C][C]T-STAT[/C][C]P-value[/C][/ROW]
[ROW][C]1[/C][C]0.613032[/C][C]5.2018[/C][C]1e-06[/C][/ROW]
[ROW][C]2[/C][C]0.226972[/C][C]1.9259[/C][C]0.029032[/C][/ROW]
[ROW][C]3[/C][C]0.242905[/C][C]2.0611[/C][C]0.021452[/C][/ROW]
[ROW][C]4[/C][C]-0.247087[/C][C]-2.0966[/C][C]0.019771[/C][/ROW]
[ROW][C]5[/C][C]0.248959[/C][C]2.1125[/C][C]0.019057[/C][/ROW]
[ROW][C]6[/C][C]0.149456[/C][C]1.2682[/C][C]0.10441[/C][/ROW]
[ROW][C]7[/C][C]-0.108009[/C][C]-0.9165[/C][C]0.181235[/C][/ROW]
[ROW][C]8[/C][C]-0.131579[/C][C]-1.1165[/C][C]0.133964[/C][/ROW]
[ROW][C]9[/C][C]0.378696[/C][C]3.2133[/C][C]0.000982[/C][/ROW]
[ROW][C]10[/C][C]0.008005[/C][C]0.0679[/C][C]0.473016[/C][/ROW]
[ROW][C]11[/C][C]0.261446[/C][C]2.2184[/C][C]0.014839[/C][/ROW]
[ROW][C]12[/C][C]0.191311[/C][C]1.6233[/C][C]0.054445[/C][/ROW]
[ROW][C]13[/C][C]-0.280881[/C][C]-2.3834[/C][C]0.009898[/C][/ROW]
[ROW][C]14[/C][C]-0.252607[/C][C]-2.1434[/C][C]0.017728[/C][/ROW]
[ROW][C]15[/C][C]-0.118709[/C][C]-1.0073[/C][C]0.158587[/C][/ROW]
[ROW][C]16[/C][C]-0.055654[/C][C]-0.4722[/C][C]0.319091[/C][/ROW]
[ROW][C]17[/C][C]0.012438[/C][C]0.1055[/C][C]0.45812[/C][/ROW]
[ROW][C]18[/C][C]0.018045[/C][C]0.1531[/C][C]0.439368[/C][/ROW]
[ROW][C]19[/C][C]0.0334[/C][C]0.2834[/C][C]0.388838[/C][/ROW]
[ROW][C]20[/C][C]-0.019091[/C][C]-0.162[/C][C]0.435884[/C][/ROW]
[ROW][C]21[/C][C]-0.012617[/C][C]-0.1071[/C][C]0.457521[/C][/ROW]
[ROW][C]22[/C][C]0.097961[/C][C]0.8312[/C][C]0.204296[/C][/ROW]
[ROW][C]23[/C][C]-0.037873[/C][C]-0.3214[/C][C]0.374432[/C][/ROW]
[ROW][C]24[/C][C]-0.002834[/C][C]-0.024[/C][C]0.490442[/C][/ROW]
[ROW][C]25[/C][C]0.030771[/C][C]0.2611[/C][C]0.397379[/C][/ROW]
[ROW][C]26[/C][C]-0.038694[/C][C]-0.3283[/C][C]0.371808[/C][/ROW]
[ROW][C]27[/C][C]-0.116404[/C][C]-0.9877[/C][C]0.163299[/C][/ROW]
[ROW][C]28[/C][C]-0.081104[/C][C]-0.6882[/C][C]0.246772[/C][/ROW]
[ROW][C]29[/C][C]-0.054844[/C][C]-0.4654[/C][C]0.321536[/C][/ROW]
[ROW][C]30[/C][C]-0.033325[/C][C]-0.2828[/C][C]0.389081[/C][/ROW]
[ROW][C]31[/C][C]0.116402[/C][C]0.9877[/C][C]0.163302[/C][/ROW]
[ROW][C]32[/C][C]-0.0726[/C][C]-0.616[/C][C]0.269909[/C][/ROW]
[ROW][C]33[/C][C]-0.1222[/C][C]-1.0369[/C][C]0.151626[/C][/ROW]
[ROW][C]34[/C][C]-0.03203[/C][C]-0.2718[/C][C]0.393282[/C][/ROW]
[ROW][C]35[/C][C]-0.035825[/C][C]-0.304[/C][C]0.381008[/C][/ROW]
[ROW][C]36[/C][C]0.00965[/C][C]0.0819[/C][C]0.467484[/C][/ROW]
[ROW][C]37[/C][C]-0.000947[/C][C]-0.008[/C][C]0.496805[/C][/ROW]
[ROW][C]38[/C][C]-0.045176[/C][C]-0.3833[/C][C]0.351302[/C][/ROW]
[ROW][C]39[/C][C]0.118289[/C][C]1.0037[/C][C]0.159438[/C][/ROW]
[ROW][C]40[/C][C]-0.116435[/C][C]-0.988[/C][C]0.163234[/C][/ROW]
[ROW][C]41[/C][C]0.024217[/C][C]0.2055[/C][C]0.418887[/C][/ROW]
[ROW][C]42[/C][C]-0.03392[/C][C]-0.2878[/C][C]0.387154[/C][/ROW]
[ROW][C]43[/C][C]-0.008613[/C][C]-0.0731[/C][C]0.470969[/C][/ROW]
[ROW][C]44[/C][C]-0.029725[/C][C]-0.2522[/C][C]0.400792[/C][/ROW]
[ROW][C]45[/C][C]0.027894[/C][C]0.2367[/C][C]0.406785[/C][/ROW]
[ROW][C]46[/C][C]0.074973[/C][C]0.6362[/C][C]0.263343[/C][/ROW]
[ROW][C]47[/C][C]-0.06105[/C][C]-0.518[/C][C]0.303015[/C][/ROW]
[ROW][C]48[/C][C]0.041445[/C][C]0.3517[/C][C]0.363057[/C][/ROW]
[ROW][C]49[/C][C]-0.074829[/C][C]-0.6349[/C][C]0.26374[/C][/ROW]
[ROW][C]50[/C][C]-0.039924[/C][C]-0.3388[/C][C]0.367887[/C][/ROW]
[ROW][C]51[/C][C]-0.075533[/C][C]-0.6409[/C][C]0.261806[/C][/ROW]
[ROW][C]52[/C][C]0.09189[/C][C]0.7797[/C][C]0.219059[/C][/ROW]
[ROW][C]53[/C][C]0.011827[/C][C]0.1004[/C][C]0.460172[/C][/ROW]
[ROW][C]54[/C][C]-0.077742[/C][C]-0.6597[/C][C]0.255787[/C][/ROW]
[ROW][C]55[/C][C]-0.032043[/C][C]-0.2719[/C][C]0.393242[/C][/ROW]
[ROW][C]56[/C][C]-0.017644[/C][C]-0.1497[/C][C]0.440704[/C][/ROW]
[ROW][C]57[/C][C]-0.041918[/C][C]-0.3557[/C][C]0.361559[/C][/ROW]
[ROW][C]58[/C][C]-0.001301[/C][C]-0.011[/C][C]0.495612[/C][/ROW]
[ROW][C]59[/C][C]-0.004478[/C][C]-0.038[/C][C]0.484896[/C][/ROW]
[ROW][C]60[/C][C]0.008589[/C][C]0.0729[/C][C]0.471053[/C][/ROW]
[/TABLE]
Source: https://freestatistics.org/blog/index.php?pk=35287&T=2

Globally Unique Identifier (entire table): ba.freestatistics.org/blog/index.php?pk=35287&T=2

As an alternative you can also use a QR Code:  

The GUIDs for individual cells are displayed in the table below:

Partial Autocorrelation Function
Time lag kPACF(k)T-STATP-value
10.6130325.20181e-06
20.2269721.92590.029032
30.2429052.06110.021452
4-0.247087-2.09660.019771
50.2489592.11250.019057
60.1494561.26820.10441
7-0.108009-0.91650.181235
8-0.131579-1.11650.133964
90.3786963.21330.000982
100.0080050.06790.473016
110.2614462.21840.014839
120.1913111.62330.054445
13-0.280881-2.38340.009898
14-0.252607-2.14340.017728
15-0.118709-1.00730.158587
16-0.055654-0.47220.319091
170.0124380.10550.45812
180.0180450.15310.439368
190.03340.28340.388838
20-0.019091-0.1620.435884
21-0.012617-0.10710.457521
220.0979610.83120.204296
23-0.037873-0.32140.374432
24-0.002834-0.0240.490442
250.0307710.26110.397379
26-0.038694-0.32830.371808
27-0.116404-0.98770.163299
28-0.081104-0.68820.246772
29-0.054844-0.46540.321536
30-0.033325-0.28280.389081
310.1164020.98770.163302
32-0.0726-0.6160.269909
33-0.1222-1.03690.151626
34-0.03203-0.27180.393282
35-0.035825-0.3040.381008
360.009650.08190.467484
37-0.000947-0.0080.496805
38-0.045176-0.38330.351302
390.1182891.00370.159438
40-0.116435-0.9880.163234
410.0242170.20550.418887
42-0.03392-0.28780.387154
43-0.008613-0.07310.470969
44-0.029725-0.25220.400792
450.0278940.23670.406785
460.0749730.63620.263343
47-0.06105-0.5180.303015
480.0414450.35170.363057
49-0.074829-0.63490.26374
50-0.039924-0.33880.367887
51-0.075533-0.64090.261806
520.091890.77970.219059
530.0118270.10040.460172
54-0.077742-0.65970.255787
55-0.032043-0.27190.393242
56-0.017644-0.14970.440704
57-0.041918-0.35570.361559
58-0.001301-0.0110.495612
59-0.004478-0.0380.484896
600.0085890.07290.471053


Parameters (Session):
par1 = 1 ; par2 = Include Monthly Dummies ; par3 = No Linear Trend ;
Parameters (R input):
par1 = 60 ; par2 = -0.7 ; par3 = 0 ; par4 = 0 ; par5 = 12 ;
R code (references can be found in the software module):
if (par1 == 'Default') {
par1 = 10*log10(length(x))
} else {
par1 <- as.numeric(par1)
}
par2 <- as.numeric(par2)
par3 <- as.numeric(par3)
par4 <- as.numeric(par4)
par5 <- as.numeric(par5)
if (par2 == 0) {
x <- log(x)
} else {
x <- (x ^ par2 - 1) / par2
}
if (par3 > 0) x <- diff(x,lag=1,difference=par3)
if (par4 > 0) x <- diff(x,lag=par5,difference=par4)
bitmap(file='pic1.png')
racf <- acf(x,par1,main='Autocorrelation',xlab='lags',ylab='ACF')
dev.off()
bitmap(file='pic2.png')
rpacf <- pacf(x,par1,main='Partial Autocorrelation',xlab='lags',ylab='PACF')
dev.off()
(myacf <- c(racf$acf))
(mypacf <- c(rpacf$acf))
lengthx <- length(x)
sqrtn <- sqrt(lengthx)
load(file='createtable')
a<-table.start()
a<-table.row.start(a)
a<-table.element(a,'Autocorrelation Function',4,TRUE)
a<-table.row.end(a)
a<-table.row.start(a)
a<-table.element(a,'Time lag k',header=TRUE)
a<-table.element(a,hyperlink('basics.htm','ACF(k)','click here for more information about the Autocorrelation Function'),header=TRUE)
a<-table.element(a,'T-STAT',header=TRUE)
a<-table.element(a,'P-value',header=TRUE)
a<-table.row.end(a)
for (i in 2:(par1+1)) {
a<-table.row.start(a)
a<-table.element(a,i-1,header=TRUE)
a<-table.element(a,round(myacf[i],6))
mytstat <- myacf[i]*sqrtn
a<-table.element(a,round(mytstat,4))
a<-table.element(a,round(1-pt(abs(mytstat),lengthx),6))
a<-table.row.end(a)
}
a<-table.end(a)
table.save(a,file='mytable.tab')
a<-table.start()
a<-table.row.start(a)
a<-table.element(a,'Partial Autocorrelation Function',4,TRUE)
a<-table.row.end(a)
a<-table.row.start(a)
a<-table.element(a,'Time lag k',header=TRUE)
a<-table.element(a,hyperlink('basics.htm','PACF(k)','click here for more information about the Partial Autocorrelation Function'),header=TRUE)
a<-table.element(a,'T-STAT',header=TRUE)
a<-table.element(a,'P-value',header=TRUE)
a<-table.row.end(a)
for (i in 1:par1) {
a<-table.row.start(a)
a<-table.element(a,i,header=TRUE)
a<-table.element(a,round(mypacf[i],6))
mytstat <- mypacf[i]*sqrtn
a<-table.element(a,round(mytstat,4))
a<-table.element(a,round(1-pt(abs(mytstat),lengthx),6))
a<-table.row.end(a)
}
a<-table.end(a)
table.save(a,file='mytable1.tab')