Free Statistics

of Irreproducible Research!

Author's title

Author*The author of this computation has been verified*
R Software Modulerwasp_autocorrelation.wasp
Title produced by software(Partial) Autocorrelation Function
Date of computationFri, 19 Dec 2008 16:32:33 -0700
Cite this page as followsStatistical Computations at FreeStatistics.org, Office for Research Development and Education, URL https://freestatistics.org/blog/index.php?v=date/2008/Dec/20/t1229729608irsrqagbomig0hi.htm/, Retrieved Sun, 19 May 2024 10:20:14 +0000
Statistical Computations at FreeStatistics.org, Office for Research Development and Education, URL https://freestatistics.org/blog/index.php?pk=35277, Retrieved Sun, 19 May 2024 10:20:14 +0000
QR Codes:

Original text written by user:
IsPrivate?No (this computation is public)
User-defined keywords
Estimated Impact224
Family? (F = Feedback message, R = changed R code, M = changed R Module, P = changed Parameters, D = changed Data)
-     [(Partial) Autocorrelation Function] [(P)ACF omzet] [2008-12-17 19:57:22] [5161246d1ccc1b670cc664d03050f084]
-   PD    [(Partial) Autocorrelation Function] [(P)ACF omzet met ...] [2008-12-19 23:32:33] [e515c0250d6233b5d2604259ab52cebe] [Current]
Feedback Forum

Post a new message
Dataseries X:
124.1
110.7
128.1
108.9
111.2
131.9
120.5
115.4
130.8
112.6
111.1
129.5
131.8
127.7
142.6
115.8
119.5
139.8
130.6
126.2
141.7
118.9
120.3
141.2
138.9
141.3
153.7
131
136.5
160.1
139.8
143.8
155.8
131
131.8
151.7
153.8
152.9
156.1
147.2
145.7
165.3
147.4
154.4
165.3
145.2
139.7
158.4
169.1
162.1
166.2
157.2
161.4
169
171.8
161.4
175.7
164.7
146.1
173


Summary of computational transaction
Raw Inputview raw input (R code)
Raw Outputview raw output of R engine
Computing time1 seconds
R Server'Gwilym Jenkins' @ 72.249.127.135

\begin{tabular}{lllllllll}
\hline
Summary of computational transaction \tabularnewline
Raw Input & view raw input (R code)  \tabularnewline
Raw Output & view raw output of R engine  \tabularnewline
Computing time & 1 seconds \tabularnewline
R Server & 'Gwilym Jenkins' @ 72.249.127.135 \tabularnewline
\hline
\end{tabular}
%Source: https://freestatistics.org/blog/index.php?pk=35277&T=0

[TABLE]
[ROW][C]Summary of computational transaction[/C][/ROW]
[ROW][C]Raw Input[/C][C]view raw input (R code) [/C][/ROW]
[ROW][C]Raw Output[/C][C]view raw output of R engine [/C][/ROW]
[ROW][C]Computing time[/C][C]1 seconds[/C][/ROW]
[ROW][C]R Server[/C][C]'Gwilym Jenkins' @ 72.249.127.135[/C][/ROW]
[/TABLE]
Source: https://freestatistics.org/blog/index.php?pk=35277&T=0

Globally Unique Identifier (entire table): ba.freestatistics.org/blog/index.php?pk=35277&T=0

As an alternative you can also use a QR Code:  

The GUIDs for individual cells are displayed in the table below:

Summary of computational transaction
Raw Inputview raw input (R code)
Raw Outputview raw output of R engine
Computing time1 seconds
R Server'Gwilym Jenkins' @ 72.249.127.135


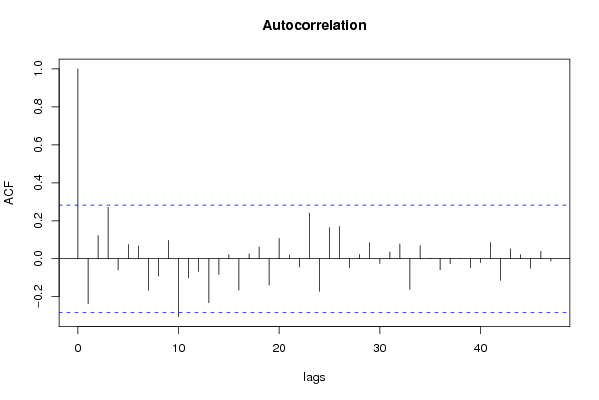
Autocorrelation Function
Time lag kACF(k)T-STATP-value
1-0.2377-1.64680.053062
20.1217380.84340.201587
30.2709341.87710.033296
4-0.0593-0.41080.341508
50.0745850.51670.303855
60.0669650.46390.322392
7-0.165952-1.14970.127972
8-0.091395-0.63320.264804
90.0960390.66540.254497
10-0.305408-2.11590.019782
11-0.101475-0.7030.242714
12-0.067884-0.47030.32013
13-0.232592-1.61140.05682
14-0.08295-0.57470.284092
150.0209110.14490.442707
16-0.165903-1.14940.128042
170.0255220.17680.430196
180.0611070.42340.33696
19-0.139258-0.96480.169738
200.1065140.7380.232068
210.0191780.13290.447426
22-0.043187-0.29920.383036
230.240471.6660.051111
24-0.171852-1.19060.119828
250.1634391.13230.131559
260.1691971.17220.123444
27-0.046665-0.32330.373936
280.0225850.15650.438159
290.0843230.58420.280909
30-0.024832-0.1720.432063
310.0356970.24730.402859
320.077690.53830.296445
33-0.161814-1.12110.133915
340.0682960.47320.319118
350.0029090.02020.492002
36-0.057755-0.40010.345415
37-0.026064-0.18060.428729
380.0023680.01640.49349
39-0.047738-0.33070.371141
40-0.020499-0.1420.44383
410.0852650.59070.278735
42-0.113834-0.78870.217094
430.0512230.35490.362115
440.0209230.1450.442675
45-0.049903-0.34570.365526
460.0386850.2680.394918
47-0.012607-0.08730.465382
48NANANA
49NANANA
50NANANA
51NANANA
52NANANA
53NANANA
54NANANA
55NANANA
56NANANA
57NANANA
58NANANA
59NANANA
60NANANA

\begin{tabular}{lllllllll}
\hline
Autocorrelation Function \tabularnewline
Time lag k & ACF(k) & T-STAT & P-value \tabularnewline
1 & -0.2377 & -1.6468 & 0.053062 \tabularnewline
2 & 0.121738 & 0.8434 & 0.201587 \tabularnewline
3 & 0.270934 & 1.8771 & 0.033296 \tabularnewline
4 & -0.0593 & -0.4108 & 0.341508 \tabularnewline
5 & 0.074585 & 0.5167 & 0.303855 \tabularnewline
6 & 0.066965 & 0.4639 & 0.322392 \tabularnewline
7 & -0.165952 & -1.1497 & 0.127972 \tabularnewline
8 & -0.091395 & -0.6332 & 0.264804 \tabularnewline
9 & 0.096039 & 0.6654 & 0.254497 \tabularnewline
10 & -0.305408 & -2.1159 & 0.019782 \tabularnewline
11 & -0.101475 & -0.703 & 0.242714 \tabularnewline
12 & -0.067884 & -0.4703 & 0.32013 \tabularnewline
13 & -0.232592 & -1.6114 & 0.05682 \tabularnewline
14 & -0.08295 & -0.5747 & 0.284092 \tabularnewline
15 & 0.020911 & 0.1449 & 0.442707 \tabularnewline
16 & -0.165903 & -1.1494 & 0.128042 \tabularnewline
17 & 0.025522 & 0.1768 & 0.430196 \tabularnewline
18 & 0.061107 & 0.4234 & 0.33696 \tabularnewline
19 & -0.139258 & -0.9648 & 0.169738 \tabularnewline
20 & 0.106514 & 0.738 & 0.232068 \tabularnewline
21 & 0.019178 & 0.1329 & 0.447426 \tabularnewline
22 & -0.043187 & -0.2992 & 0.383036 \tabularnewline
23 & 0.24047 & 1.666 & 0.051111 \tabularnewline
24 & -0.171852 & -1.1906 & 0.119828 \tabularnewline
25 & 0.163439 & 1.1323 & 0.131559 \tabularnewline
26 & 0.169197 & 1.1722 & 0.123444 \tabularnewline
27 & -0.046665 & -0.3233 & 0.373936 \tabularnewline
28 & 0.022585 & 0.1565 & 0.438159 \tabularnewline
29 & 0.084323 & 0.5842 & 0.280909 \tabularnewline
30 & -0.024832 & -0.172 & 0.432063 \tabularnewline
31 & 0.035697 & 0.2473 & 0.402859 \tabularnewline
32 & 0.07769 & 0.5383 & 0.296445 \tabularnewline
33 & -0.161814 & -1.1211 & 0.133915 \tabularnewline
34 & 0.068296 & 0.4732 & 0.319118 \tabularnewline
35 & 0.002909 & 0.0202 & 0.492002 \tabularnewline
36 & -0.057755 & -0.4001 & 0.345415 \tabularnewline
37 & -0.026064 & -0.1806 & 0.428729 \tabularnewline
38 & 0.002368 & 0.0164 & 0.49349 \tabularnewline
39 & -0.047738 & -0.3307 & 0.371141 \tabularnewline
40 & -0.020499 & -0.142 & 0.44383 \tabularnewline
41 & 0.085265 & 0.5907 & 0.278735 \tabularnewline
42 & -0.113834 & -0.7887 & 0.217094 \tabularnewline
43 & 0.051223 & 0.3549 & 0.362115 \tabularnewline
44 & 0.020923 & 0.145 & 0.442675 \tabularnewline
45 & -0.049903 & -0.3457 & 0.365526 \tabularnewline
46 & 0.038685 & 0.268 & 0.394918 \tabularnewline
47 & -0.012607 & -0.0873 & 0.465382 \tabularnewline
48 & NA & NA & NA \tabularnewline
49 & NA & NA & NA \tabularnewline
50 & NA & NA & NA \tabularnewline
51 & NA & NA & NA \tabularnewline
52 & NA & NA & NA \tabularnewline
53 & NA & NA & NA \tabularnewline
54 & NA & NA & NA \tabularnewline
55 & NA & NA & NA \tabularnewline
56 & NA & NA & NA \tabularnewline
57 & NA & NA & NA \tabularnewline
58 & NA & NA & NA \tabularnewline
59 & NA & NA & NA \tabularnewline
60 & NA & NA & NA \tabularnewline
\hline
\end{tabular}
%Source: https://freestatistics.org/blog/index.php?pk=35277&T=1

[TABLE]
[ROW][C]Autocorrelation Function[/C][/ROW]
[ROW][C]Time lag k[/C][C]ACF(k)[/C][C]T-STAT[/C][C]P-value[/C][/ROW]
[ROW][C]1[/C][C]-0.2377[/C][C]-1.6468[/C][C]0.053062[/C][/ROW]
[ROW][C]2[/C][C]0.121738[/C][C]0.8434[/C][C]0.201587[/C][/ROW]
[ROW][C]3[/C][C]0.270934[/C][C]1.8771[/C][C]0.033296[/C][/ROW]
[ROW][C]4[/C][C]-0.0593[/C][C]-0.4108[/C][C]0.341508[/C][/ROW]
[ROW][C]5[/C][C]0.074585[/C][C]0.5167[/C][C]0.303855[/C][/ROW]
[ROW][C]6[/C][C]0.066965[/C][C]0.4639[/C][C]0.322392[/C][/ROW]
[ROW][C]7[/C][C]-0.165952[/C][C]-1.1497[/C][C]0.127972[/C][/ROW]
[ROW][C]8[/C][C]-0.091395[/C][C]-0.6332[/C][C]0.264804[/C][/ROW]
[ROW][C]9[/C][C]0.096039[/C][C]0.6654[/C][C]0.254497[/C][/ROW]
[ROW][C]10[/C][C]-0.305408[/C][C]-2.1159[/C][C]0.019782[/C][/ROW]
[ROW][C]11[/C][C]-0.101475[/C][C]-0.703[/C][C]0.242714[/C][/ROW]
[ROW][C]12[/C][C]-0.067884[/C][C]-0.4703[/C][C]0.32013[/C][/ROW]
[ROW][C]13[/C][C]-0.232592[/C][C]-1.6114[/C][C]0.05682[/C][/ROW]
[ROW][C]14[/C][C]-0.08295[/C][C]-0.5747[/C][C]0.284092[/C][/ROW]
[ROW][C]15[/C][C]0.020911[/C][C]0.1449[/C][C]0.442707[/C][/ROW]
[ROW][C]16[/C][C]-0.165903[/C][C]-1.1494[/C][C]0.128042[/C][/ROW]
[ROW][C]17[/C][C]0.025522[/C][C]0.1768[/C][C]0.430196[/C][/ROW]
[ROW][C]18[/C][C]0.061107[/C][C]0.4234[/C][C]0.33696[/C][/ROW]
[ROW][C]19[/C][C]-0.139258[/C][C]-0.9648[/C][C]0.169738[/C][/ROW]
[ROW][C]20[/C][C]0.106514[/C][C]0.738[/C][C]0.232068[/C][/ROW]
[ROW][C]21[/C][C]0.019178[/C][C]0.1329[/C][C]0.447426[/C][/ROW]
[ROW][C]22[/C][C]-0.043187[/C][C]-0.2992[/C][C]0.383036[/C][/ROW]
[ROW][C]23[/C][C]0.24047[/C][C]1.666[/C][C]0.051111[/C][/ROW]
[ROW][C]24[/C][C]-0.171852[/C][C]-1.1906[/C][C]0.119828[/C][/ROW]
[ROW][C]25[/C][C]0.163439[/C][C]1.1323[/C][C]0.131559[/C][/ROW]
[ROW][C]26[/C][C]0.169197[/C][C]1.1722[/C][C]0.123444[/C][/ROW]
[ROW][C]27[/C][C]-0.046665[/C][C]-0.3233[/C][C]0.373936[/C][/ROW]
[ROW][C]28[/C][C]0.022585[/C][C]0.1565[/C][C]0.438159[/C][/ROW]
[ROW][C]29[/C][C]0.084323[/C][C]0.5842[/C][C]0.280909[/C][/ROW]
[ROW][C]30[/C][C]-0.024832[/C][C]-0.172[/C][C]0.432063[/C][/ROW]
[ROW][C]31[/C][C]0.035697[/C][C]0.2473[/C][C]0.402859[/C][/ROW]
[ROW][C]32[/C][C]0.07769[/C][C]0.5383[/C][C]0.296445[/C][/ROW]
[ROW][C]33[/C][C]-0.161814[/C][C]-1.1211[/C][C]0.133915[/C][/ROW]
[ROW][C]34[/C][C]0.068296[/C][C]0.4732[/C][C]0.319118[/C][/ROW]
[ROW][C]35[/C][C]0.002909[/C][C]0.0202[/C][C]0.492002[/C][/ROW]
[ROW][C]36[/C][C]-0.057755[/C][C]-0.4001[/C][C]0.345415[/C][/ROW]
[ROW][C]37[/C][C]-0.026064[/C][C]-0.1806[/C][C]0.428729[/C][/ROW]
[ROW][C]38[/C][C]0.002368[/C][C]0.0164[/C][C]0.49349[/C][/ROW]
[ROW][C]39[/C][C]-0.047738[/C][C]-0.3307[/C][C]0.371141[/C][/ROW]
[ROW][C]40[/C][C]-0.020499[/C][C]-0.142[/C][C]0.44383[/C][/ROW]
[ROW][C]41[/C][C]0.085265[/C][C]0.5907[/C][C]0.278735[/C][/ROW]
[ROW][C]42[/C][C]-0.113834[/C][C]-0.7887[/C][C]0.217094[/C][/ROW]
[ROW][C]43[/C][C]0.051223[/C][C]0.3549[/C][C]0.362115[/C][/ROW]
[ROW][C]44[/C][C]0.020923[/C][C]0.145[/C][C]0.442675[/C][/ROW]
[ROW][C]45[/C][C]-0.049903[/C][C]-0.3457[/C][C]0.365526[/C][/ROW]
[ROW][C]46[/C][C]0.038685[/C][C]0.268[/C][C]0.394918[/C][/ROW]
[ROW][C]47[/C][C]-0.012607[/C][C]-0.0873[/C][C]0.465382[/C][/ROW]
[ROW][C]48[/C][C]NA[/C][C]NA[/C][C]NA[/C][/ROW]
[ROW][C]49[/C][C]NA[/C][C]NA[/C][C]NA[/C][/ROW]
[ROW][C]50[/C][C]NA[/C][C]NA[/C][C]NA[/C][/ROW]
[ROW][C]51[/C][C]NA[/C][C]NA[/C][C]NA[/C][/ROW]
[ROW][C]52[/C][C]NA[/C][C]NA[/C][C]NA[/C][/ROW]
[ROW][C]53[/C][C]NA[/C][C]NA[/C][C]NA[/C][/ROW]
[ROW][C]54[/C][C]NA[/C][C]NA[/C][C]NA[/C][/ROW]
[ROW][C]55[/C][C]NA[/C][C]NA[/C][C]NA[/C][/ROW]
[ROW][C]56[/C][C]NA[/C][C]NA[/C][C]NA[/C][/ROW]
[ROW][C]57[/C][C]NA[/C][C]NA[/C][C]NA[/C][/ROW]
[ROW][C]58[/C][C]NA[/C][C]NA[/C][C]NA[/C][/ROW]
[ROW][C]59[/C][C]NA[/C][C]NA[/C][C]NA[/C][/ROW]
[ROW][C]60[/C][C]NA[/C][C]NA[/C][C]NA[/C][/ROW]
[/TABLE]
Source: https://freestatistics.org/blog/index.php?pk=35277&T=1

Globally Unique Identifier (entire table): ba.freestatistics.org/blog/index.php?pk=35277&T=1

As an alternative you can also use a QR Code:  

The GUIDs for individual cells are displayed in the table below:

Autocorrelation Function
Time lag kACF(k)T-STATP-value
1-0.2377-1.64680.053062
20.1217380.84340.201587
30.2709341.87710.033296
4-0.0593-0.41080.341508
50.0745850.51670.303855
60.0669650.46390.322392
7-0.165952-1.14970.127972
8-0.091395-0.63320.264804
90.0960390.66540.254497
10-0.305408-2.11590.019782
11-0.101475-0.7030.242714
12-0.067884-0.47030.32013
13-0.232592-1.61140.05682
14-0.08295-0.57470.284092
150.0209110.14490.442707
16-0.165903-1.14940.128042
170.0255220.17680.430196
180.0611070.42340.33696
19-0.139258-0.96480.169738
200.1065140.7380.232068
210.0191780.13290.447426
22-0.043187-0.29920.383036
230.240471.6660.051111
24-0.171852-1.19060.119828
250.1634391.13230.131559
260.1691971.17220.123444
27-0.046665-0.32330.373936
280.0225850.15650.438159
290.0843230.58420.280909
30-0.024832-0.1720.432063
310.0356970.24730.402859
320.077690.53830.296445
33-0.161814-1.12110.133915
340.0682960.47320.319118
350.0029090.02020.492002
36-0.057755-0.40010.345415
37-0.026064-0.18060.428729
380.0023680.01640.49349
39-0.047738-0.33070.371141
40-0.020499-0.1420.44383
410.0852650.59070.278735
42-0.113834-0.78870.217094
430.0512230.35490.362115
440.0209230.1450.442675
45-0.049903-0.34570.365526
460.0386850.2680.394918
47-0.012607-0.08730.465382
48NANANA
49NANANA
50NANANA
51NANANA
52NANANA
53NANANA
54NANANA
55NANANA
56NANANA
57NANANA
58NANANA
59NANANA
60NANANA


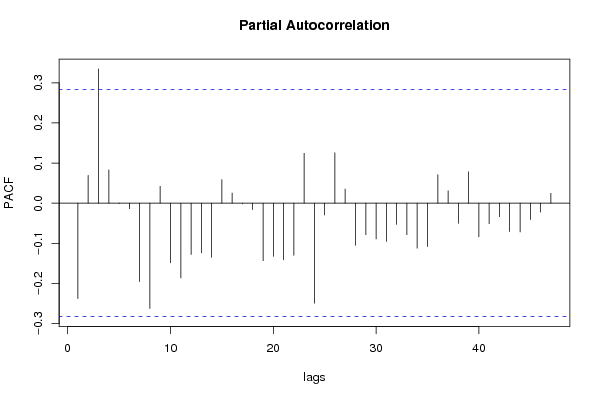
Partial Autocorrelation Function
Time lag kPACF(k)T-STATP-value
1-0.2377-1.64680.053062
20.0691430.4790.317043
30.3347282.31910.012347
40.0828150.57380.284404
5-0.000805-0.00560.497787
6-0.01375-0.09530.462251
7-0.195521-1.35460.090942
8-0.26229-1.81720.037716
90.0420430.29130.386045
10-0.148554-1.02920.15427
11-0.186329-1.29090.101457
12-0.12771-0.88480.190337
13-0.123617-0.85640.198005
14-0.13483-0.93410.177456
150.0585220.40550.343473
160.0252470.17490.43094
17-0.001671-0.01160.495406
18-0.015793-0.10940.456664
19-0.143373-0.99330.162769
20-0.132526-0.91820.181562
21-0.141076-0.97740.166634
22-0.12994-0.90030.18624
230.1244710.86240.196389
24-0.249461-1.72830.04518
25-0.029273-0.20280.42007
260.12570.87090.194078
270.0353970.24520.403658
28-0.105072-0.7280.235087
29-0.078632-0.54480.294215
30-0.088977-0.61640.270255
31-0.095292-0.66020.25614
32-0.052837-0.36610.357963
33-0.078609-0.54460.294269
34-0.112079-0.77650.220629
35-0.108082-0.74880.228811
360.0710460.49220.312404
370.0309960.21470.415436
38-0.050198-0.34780.364763
390.0783350.54270.294917
40-0.083889-0.58120.281913
41-0.051249-0.35510.362048
42-0.033721-0.23360.408134
43-0.070616-0.48920.31345
44-0.071683-0.49660.310857
45-0.040814-0.28280.389286
46-0.022129-0.15330.439397
470.0245320.170.432877
48NANANA
49NANANA
50NANANA
51NANANA
52NANANA
53NANANA
54NANANA
55NANANA
56NANANA
57NANANA
58NANANA
59NANANA
60NANANA

\begin{tabular}{lllllllll}
\hline
Partial Autocorrelation Function \tabularnewline
Time lag k & PACF(k) & T-STAT & P-value \tabularnewline
1 & -0.2377 & -1.6468 & 0.053062 \tabularnewline
2 & 0.069143 & 0.479 & 0.317043 \tabularnewline
3 & 0.334728 & 2.3191 & 0.012347 \tabularnewline
4 & 0.082815 & 0.5738 & 0.284404 \tabularnewline
5 & -0.000805 & -0.0056 & 0.497787 \tabularnewline
6 & -0.01375 & -0.0953 & 0.462251 \tabularnewline
7 & -0.195521 & -1.3546 & 0.090942 \tabularnewline
8 & -0.26229 & -1.8172 & 0.037716 \tabularnewline
9 & 0.042043 & 0.2913 & 0.386045 \tabularnewline
10 & -0.148554 & -1.0292 & 0.15427 \tabularnewline
11 & -0.186329 & -1.2909 & 0.101457 \tabularnewline
12 & -0.12771 & -0.8848 & 0.190337 \tabularnewline
13 & -0.123617 & -0.8564 & 0.198005 \tabularnewline
14 & -0.13483 & -0.9341 & 0.177456 \tabularnewline
15 & 0.058522 & 0.4055 & 0.343473 \tabularnewline
16 & 0.025247 & 0.1749 & 0.43094 \tabularnewline
17 & -0.001671 & -0.0116 & 0.495406 \tabularnewline
18 & -0.015793 & -0.1094 & 0.456664 \tabularnewline
19 & -0.143373 & -0.9933 & 0.162769 \tabularnewline
20 & -0.132526 & -0.9182 & 0.181562 \tabularnewline
21 & -0.141076 & -0.9774 & 0.166634 \tabularnewline
22 & -0.12994 & -0.9003 & 0.18624 \tabularnewline
23 & 0.124471 & 0.8624 & 0.196389 \tabularnewline
24 & -0.249461 & -1.7283 & 0.04518 \tabularnewline
25 & -0.029273 & -0.2028 & 0.42007 \tabularnewline
26 & 0.1257 & 0.8709 & 0.194078 \tabularnewline
27 & 0.035397 & 0.2452 & 0.403658 \tabularnewline
28 & -0.105072 & -0.728 & 0.235087 \tabularnewline
29 & -0.078632 & -0.5448 & 0.294215 \tabularnewline
30 & -0.088977 & -0.6164 & 0.270255 \tabularnewline
31 & -0.095292 & -0.6602 & 0.25614 \tabularnewline
32 & -0.052837 & -0.3661 & 0.357963 \tabularnewline
33 & -0.078609 & -0.5446 & 0.294269 \tabularnewline
34 & -0.112079 & -0.7765 & 0.220629 \tabularnewline
35 & -0.108082 & -0.7488 & 0.228811 \tabularnewline
36 & 0.071046 & 0.4922 & 0.312404 \tabularnewline
37 & 0.030996 & 0.2147 & 0.415436 \tabularnewline
38 & -0.050198 & -0.3478 & 0.364763 \tabularnewline
39 & 0.078335 & 0.5427 & 0.294917 \tabularnewline
40 & -0.083889 & -0.5812 & 0.281913 \tabularnewline
41 & -0.051249 & -0.3551 & 0.362048 \tabularnewline
42 & -0.033721 & -0.2336 & 0.408134 \tabularnewline
43 & -0.070616 & -0.4892 & 0.31345 \tabularnewline
44 & -0.071683 & -0.4966 & 0.310857 \tabularnewline
45 & -0.040814 & -0.2828 & 0.389286 \tabularnewline
46 & -0.022129 & -0.1533 & 0.439397 \tabularnewline
47 & 0.024532 & 0.17 & 0.432877 \tabularnewline
48 & NA & NA & NA \tabularnewline
49 & NA & NA & NA \tabularnewline
50 & NA & NA & NA \tabularnewline
51 & NA & NA & NA \tabularnewline
52 & NA & NA & NA \tabularnewline
53 & NA & NA & NA \tabularnewline
54 & NA & NA & NA \tabularnewline
55 & NA & NA & NA \tabularnewline
56 & NA & NA & NA \tabularnewline
57 & NA & NA & NA \tabularnewline
58 & NA & NA & NA \tabularnewline
59 & NA & NA & NA \tabularnewline
60 & NA & NA & NA \tabularnewline
\hline
\end{tabular}
%Source: https://freestatistics.org/blog/index.php?pk=35277&T=2

[TABLE]
[ROW][C]Partial Autocorrelation Function[/C][/ROW]
[ROW][C]Time lag k[/C][C]PACF(k)[/C][C]T-STAT[/C][C]P-value[/C][/ROW]
[ROW][C]1[/C][C]-0.2377[/C][C]-1.6468[/C][C]0.053062[/C][/ROW]
[ROW][C]2[/C][C]0.069143[/C][C]0.479[/C][C]0.317043[/C][/ROW]
[ROW][C]3[/C][C]0.334728[/C][C]2.3191[/C][C]0.012347[/C][/ROW]
[ROW][C]4[/C][C]0.082815[/C][C]0.5738[/C][C]0.284404[/C][/ROW]
[ROW][C]5[/C][C]-0.000805[/C][C]-0.0056[/C][C]0.497787[/C][/ROW]
[ROW][C]6[/C][C]-0.01375[/C][C]-0.0953[/C][C]0.462251[/C][/ROW]
[ROW][C]7[/C][C]-0.195521[/C][C]-1.3546[/C][C]0.090942[/C][/ROW]
[ROW][C]8[/C][C]-0.26229[/C][C]-1.8172[/C][C]0.037716[/C][/ROW]
[ROW][C]9[/C][C]0.042043[/C][C]0.2913[/C][C]0.386045[/C][/ROW]
[ROW][C]10[/C][C]-0.148554[/C][C]-1.0292[/C][C]0.15427[/C][/ROW]
[ROW][C]11[/C][C]-0.186329[/C][C]-1.2909[/C][C]0.101457[/C][/ROW]
[ROW][C]12[/C][C]-0.12771[/C][C]-0.8848[/C][C]0.190337[/C][/ROW]
[ROW][C]13[/C][C]-0.123617[/C][C]-0.8564[/C][C]0.198005[/C][/ROW]
[ROW][C]14[/C][C]-0.13483[/C][C]-0.9341[/C][C]0.177456[/C][/ROW]
[ROW][C]15[/C][C]0.058522[/C][C]0.4055[/C][C]0.343473[/C][/ROW]
[ROW][C]16[/C][C]0.025247[/C][C]0.1749[/C][C]0.43094[/C][/ROW]
[ROW][C]17[/C][C]-0.001671[/C][C]-0.0116[/C][C]0.495406[/C][/ROW]
[ROW][C]18[/C][C]-0.015793[/C][C]-0.1094[/C][C]0.456664[/C][/ROW]
[ROW][C]19[/C][C]-0.143373[/C][C]-0.9933[/C][C]0.162769[/C][/ROW]
[ROW][C]20[/C][C]-0.132526[/C][C]-0.9182[/C][C]0.181562[/C][/ROW]
[ROW][C]21[/C][C]-0.141076[/C][C]-0.9774[/C][C]0.166634[/C][/ROW]
[ROW][C]22[/C][C]-0.12994[/C][C]-0.9003[/C][C]0.18624[/C][/ROW]
[ROW][C]23[/C][C]0.124471[/C][C]0.8624[/C][C]0.196389[/C][/ROW]
[ROW][C]24[/C][C]-0.249461[/C][C]-1.7283[/C][C]0.04518[/C][/ROW]
[ROW][C]25[/C][C]-0.029273[/C][C]-0.2028[/C][C]0.42007[/C][/ROW]
[ROW][C]26[/C][C]0.1257[/C][C]0.8709[/C][C]0.194078[/C][/ROW]
[ROW][C]27[/C][C]0.035397[/C][C]0.2452[/C][C]0.403658[/C][/ROW]
[ROW][C]28[/C][C]-0.105072[/C][C]-0.728[/C][C]0.235087[/C][/ROW]
[ROW][C]29[/C][C]-0.078632[/C][C]-0.5448[/C][C]0.294215[/C][/ROW]
[ROW][C]30[/C][C]-0.088977[/C][C]-0.6164[/C][C]0.270255[/C][/ROW]
[ROW][C]31[/C][C]-0.095292[/C][C]-0.6602[/C][C]0.25614[/C][/ROW]
[ROW][C]32[/C][C]-0.052837[/C][C]-0.3661[/C][C]0.357963[/C][/ROW]
[ROW][C]33[/C][C]-0.078609[/C][C]-0.5446[/C][C]0.294269[/C][/ROW]
[ROW][C]34[/C][C]-0.112079[/C][C]-0.7765[/C][C]0.220629[/C][/ROW]
[ROW][C]35[/C][C]-0.108082[/C][C]-0.7488[/C][C]0.228811[/C][/ROW]
[ROW][C]36[/C][C]0.071046[/C][C]0.4922[/C][C]0.312404[/C][/ROW]
[ROW][C]37[/C][C]0.030996[/C][C]0.2147[/C][C]0.415436[/C][/ROW]
[ROW][C]38[/C][C]-0.050198[/C][C]-0.3478[/C][C]0.364763[/C][/ROW]
[ROW][C]39[/C][C]0.078335[/C][C]0.5427[/C][C]0.294917[/C][/ROW]
[ROW][C]40[/C][C]-0.083889[/C][C]-0.5812[/C][C]0.281913[/C][/ROW]
[ROW][C]41[/C][C]-0.051249[/C][C]-0.3551[/C][C]0.362048[/C][/ROW]
[ROW][C]42[/C][C]-0.033721[/C][C]-0.2336[/C][C]0.408134[/C][/ROW]
[ROW][C]43[/C][C]-0.070616[/C][C]-0.4892[/C][C]0.31345[/C][/ROW]
[ROW][C]44[/C][C]-0.071683[/C][C]-0.4966[/C][C]0.310857[/C][/ROW]
[ROW][C]45[/C][C]-0.040814[/C][C]-0.2828[/C][C]0.389286[/C][/ROW]
[ROW][C]46[/C][C]-0.022129[/C][C]-0.1533[/C][C]0.439397[/C][/ROW]
[ROW][C]47[/C][C]0.024532[/C][C]0.17[/C][C]0.432877[/C][/ROW]
[ROW][C]48[/C][C]NA[/C][C]NA[/C][C]NA[/C][/ROW]
[ROW][C]49[/C][C]NA[/C][C]NA[/C][C]NA[/C][/ROW]
[ROW][C]50[/C][C]NA[/C][C]NA[/C][C]NA[/C][/ROW]
[ROW][C]51[/C][C]NA[/C][C]NA[/C][C]NA[/C][/ROW]
[ROW][C]52[/C][C]NA[/C][C]NA[/C][C]NA[/C][/ROW]
[ROW][C]53[/C][C]NA[/C][C]NA[/C][C]NA[/C][/ROW]
[ROW][C]54[/C][C]NA[/C][C]NA[/C][C]NA[/C][/ROW]
[ROW][C]55[/C][C]NA[/C][C]NA[/C][C]NA[/C][/ROW]
[ROW][C]56[/C][C]NA[/C][C]NA[/C][C]NA[/C][/ROW]
[ROW][C]57[/C][C]NA[/C][C]NA[/C][C]NA[/C][/ROW]
[ROW][C]58[/C][C]NA[/C][C]NA[/C][C]NA[/C][/ROW]
[ROW][C]59[/C][C]NA[/C][C]NA[/C][C]NA[/C][/ROW]
[ROW][C]60[/C][C]NA[/C][C]NA[/C][C]NA[/C][/ROW]
[/TABLE]
Source: https://freestatistics.org/blog/index.php?pk=35277&T=2

Globally Unique Identifier (entire table): ba.freestatistics.org/blog/index.php?pk=35277&T=2

As an alternative you can also use a QR Code:  

The GUIDs for individual cells are displayed in the table below:

Partial Autocorrelation Function
Time lag kPACF(k)T-STATP-value
1-0.2377-1.64680.053062
20.0691430.4790.317043
30.3347282.31910.012347
40.0828150.57380.284404
5-0.000805-0.00560.497787
6-0.01375-0.09530.462251
7-0.195521-1.35460.090942
8-0.26229-1.81720.037716
90.0420430.29130.386045
10-0.148554-1.02920.15427
11-0.186329-1.29090.101457
12-0.12771-0.88480.190337
13-0.123617-0.85640.198005
14-0.13483-0.93410.177456
150.0585220.40550.343473
160.0252470.17490.43094
17-0.001671-0.01160.495406
18-0.015793-0.10940.456664
19-0.143373-0.99330.162769
20-0.132526-0.91820.181562
21-0.141076-0.97740.166634
22-0.12994-0.90030.18624
230.1244710.86240.196389
24-0.249461-1.72830.04518
25-0.029273-0.20280.42007
260.12570.87090.194078
270.0353970.24520.403658
28-0.105072-0.7280.235087
29-0.078632-0.54480.294215
30-0.088977-0.61640.270255
31-0.095292-0.66020.25614
32-0.052837-0.36610.357963
33-0.078609-0.54460.294269
34-0.112079-0.77650.220629
35-0.108082-0.74880.228811
360.0710460.49220.312404
370.0309960.21470.415436
38-0.050198-0.34780.364763
390.0783350.54270.294917
40-0.083889-0.58120.281913
41-0.051249-0.35510.362048
42-0.033721-0.23360.408134
43-0.070616-0.48920.31345
44-0.071683-0.49660.310857
45-0.040814-0.28280.389286
46-0.022129-0.15330.439397
470.0245320.170.432877
48NANANA
49NANANA
50NANANA
51NANANA
52NANANA
53NANANA
54NANANA
55NANANA
56NANANA
57NANANA
58NANANA
59NANANA
60NANANA


Parameters (Session):
par1 = 60 ; par2 = 1 ; par3 = 0 ; par4 = 1 ; par5 = 12 ;
Parameters (R input):
par1 = 60 ; par2 = 1 ; par3 = 0 ; par4 = 1 ; par5 = 12 ;
R code (references can be found in the software module):
if (par1 == 'Default') {
par1 = 10*log10(length(x))
} else {
par1 <- as.numeric(par1)
}
par2 <- as.numeric(par2)
par3 <- as.numeric(par3)
par4 <- as.numeric(par4)
par5 <- as.numeric(par5)
if (par2 == 0) {
x <- log(x)
} else {
x <- (x ^ par2 - 1) / par2
}
if (par3 > 0) x <- diff(x,lag=1,difference=par3)
if (par4 > 0) x <- diff(x,lag=par5,difference=par4)
bitmap(file='pic1.png')
racf <- acf(x,par1,main='Autocorrelation',xlab='lags',ylab='ACF')
dev.off()
bitmap(file='pic2.png')
rpacf <- pacf(x,par1,main='Partial Autocorrelation',xlab='lags',ylab='PACF')
dev.off()
(myacf <- c(racf$acf))
(mypacf <- c(rpacf$acf))
lengthx <- length(x)
sqrtn <- sqrt(lengthx)
load(file='createtable')
a<-table.start()
a<-table.row.start(a)
a<-table.element(a,'Autocorrelation Function',4,TRUE)
a<-table.row.end(a)
a<-table.row.start(a)
a<-table.element(a,'Time lag k',header=TRUE)
a<-table.element(a,hyperlink('basics.htm','ACF(k)','click here for more information about the Autocorrelation Function'),header=TRUE)
a<-table.element(a,'T-STAT',header=TRUE)
a<-table.element(a,'P-value',header=TRUE)
a<-table.row.end(a)
for (i in 2:(par1+1)) {
a<-table.row.start(a)
a<-table.element(a,i-1,header=TRUE)
a<-table.element(a,round(myacf[i],6))
mytstat <- myacf[i]*sqrtn
a<-table.element(a,round(mytstat,4))
a<-table.element(a,round(1-pt(abs(mytstat),lengthx),6))
a<-table.row.end(a)
}
a<-table.end(a)
table.save(a,file='mytable.tab')
a<-table.start()
a<-table.row.start(a)
a<-table.element(a,'Partial Autocorrelation Function',4,TRUE)
a<-table.row.end(a)
a<-table.row.start(a)
a<-table.element(a,'Time lag k',header=TRUE)
a<-table.element(a,hyperlink('basics.htm','PACF(k)','click here for more information about the Partial Autocorrelation Function'),header=TRUE)
a<-table.element(a,'T-STAT',header=TRUE)
a<-table.element(a,'P-value',header=TRUE)
a<-table.row.end(a)
for (i in 1:par1) {
a<-table.row.start(a)
a<-table.element(a,i,header=TRUE)
a<-table.element(a,round(mypacf[i],6))
mytstat <- mypacf[i]*sqrtn
a<-table.element(a,round(mytstat,4))
a<-table.element(a,round(1-pt(abs(mytstat),lengthx),6))
a<-table.row.end(a)
}
a<-table.end(a)
table.save(a,file='mytable1.tab')