Free Statistics

of Irreproducible Research!

Author's title

Author*The author of this computation has been verified*
R Software Modulerwasp_autocorrelation.wasp
Title produced by software(Partial) Autocorrelation Function
Date of computationWed, 17 Dec 2008 13:02:19 -0700
Cite this page as followsStatistical Computations at FreeStatistics.org, Office for Research Development and Education, URL https://freestatistics.org/blog/index.php?v=date/2008/Dec/17/t1229544249ocw0nr1thrnmfe2.htm/, Retrieved Sun, 19 May 2024 06:00:06 +0000
Statistical Computations at FreeStatistics.org, Office for Research Development and Education, URL https://freestatistics.org/blog/index.php?pk=34535, Retrieved Sun, 19 May 2024 06:00:06 +0000
QR Codes:

Original text written by user:
IsPrivate?No (this computation is public)
User-defined keywords
Estimated Impact212
Family? (F = Feedback message, R = changed R code, M = changed R Module, P = changed Parameters, D = changed Data)
-     [Standard Deviation-Mean Plot] [Standard Deviatio...] [2008-12-16 18:30:07] [b47fceb71c9525e79a89b5fc6d023d0e]
- RM D  [Variance Reduction Matrix] [Variance Reductio...] [2008-12-16 19:16:23] [b47fceb71c9525e79a89b5fc6d023d0e]
- RMP     [(Partial) Autocorrelation Function] [autocorrelation f...] [2008-12-16 21:14:03] [b47fceb71c9525e79a89b5fc6d023d0e]
-   P         [(Partial) Autocorrelation Function] [Autocorrelation F...] [2008-12-17 20:02:19] [541f63fa3157af9df10fc4d202b2a90b] [Current]
Feedback Forum

Post a new message
Dataseries X:
91.2
99.2
108.2
101.5
106.9
104.4
77.9
60
99.5
95
105.6
102.5
93.3
97.3
127
111.7
96.4
133
72.2
95.8
124.1
127.6
110.7
104.6
112.7
115.3
139.4
119
97.4
154
81.5
88.8
127.7
105.1
114.9
106.4
104.5
121.6
141.4
99
126.7
134.1
81.3
88.6
132.7
132.9
134.4
103.7
119.7
115
132.9
108.5
113.9
142
97.7
92.2
128.8
134.9
128.2
114.8


Summary of computational transaction
Raw Inputview raw input (R code)
Raw Outputview raw output of R engine
Computing time1 seconds
R Server'Gwilym Jenkins' @ 72.249.127.135

\begin{tabular}{lllllllll}
\hline
Summary of computational transaction \tabularnewline
Raw Input & view raw input (R code)  \tabularnewline
Raw Output & view raw output of R engine  \tabularnewline
Computing time & 1 seconds \tabularnewline
R Server & 'Gwilym Jenkins' @ 72.249.127.135 \tabularnewline
\hline
\end{tabular}
%Source: https://freestatistics.org/blog/index.php?pk=34535&T=0

[TABLE]
[ROW][C]Summary of computational transaction[/C][/ROW]
[ROW][C]Raw Input[/C][C]view raw input (R code) [/C][/ROW]
[ROW][C]Raw Output[/C][C]view raw output of R engine [/C][/ROW]
[ROW][C]Computing time[/C][C]1 seconds[/C][/ROW]
[ROW][C]R Server[/C][C]'Gwilym Jenkins' @ 72.249.127.135[/C][/ROW]
[/TABLE]
Source: https://freestatistics.org/blog/index.php?pk=34535&T=0

Globally Unique Identifier (entire table): ba.freestatistics.org/blog/index.php?pk=34535&T=0

As an alternative you can also use a QR Code:  

The GUIDs for individual cells are displayed in the table below:

Summary of computational transaction
Raw Inputview raw input (R code)
Raw Outputview raw output of R engine
Computing time1 seconds
R Server'Gwilym Jenkins' @ 72.249.127.135


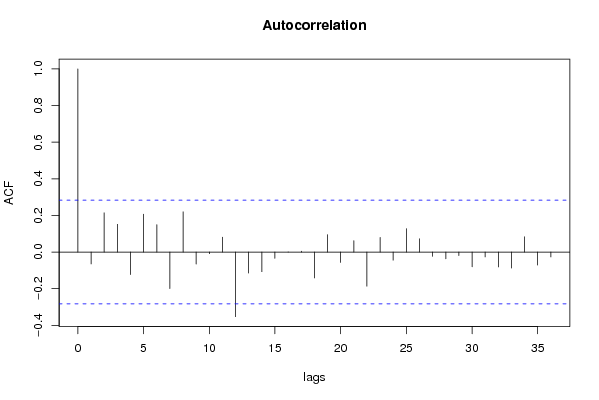
Autocorrelation Function
Time lag kACF(k)T-STATP-value
1-0.065141-0.45130.3269
20.2141241.48350.07224
30.1514431.04920.149664
4-0.123027-0.85240.199125
50.2064561.43040.079544
60.1494861.03570.152773
7-0.199676-1.38340.086472
80.2199141.52360.067084
9-0.065591-0.45440.325784
10-0.009159-0.06350.474833
110.0808790.56030.288925
12-0.353018-2.44580.009085
13-0.115228-0.79830.214308
14-0.107256-0.74310.230523
15-0.034648-0.240.405657
160.0002870.0020.49921
170.0043330.030.488087
18-0.141278-0.97880.166293
190.0945620.65510.257752
20-0.056789-0.39340.347866
210.0621570.43060.334331
22-0.186972-1.29540.100693
230.07960.55150.29193
24-0.044599-0.3090.379332
250.1273910.88260.190927
260.0721270.49970.309782
27-0.023339-0.16170.436112
28-0.036979-0.25620.399446
29-0.019214-0.13310.447327
30-0.080545-0.5580.289709
31-0.027199-0.18840.425662
32-0.081364-0.56370.287788
33-0.087445-0.60580.273739
340.08320.57640.283511
35-0.071411-0.49480.311516
36-0.026936-0.18660.426374

\begin{tabular}{lllllllll}
\hline
Autocorrelation Function \tabularnewline
Time lag k & ACF(k) & T-STAT & P-value \tabularnewline
1 & -0.065141 & -0.4513 & 0.3269 \tabularnewline
2 & 0.214124 & 1.4835 & 0.07224 \tabularnewline
3 & 0.151443 & 1.0492 & 0.149664 \tabularnewline
4 & -0.123027 & -0.8524 & 0.199125 \tabularnewline
5 & 0.206456 & 1.4304 & 0.079544 \tabularnewline
6 & 0.149486 & 1.0357 & 0.152773 \tabularnewline
7 & -0.199676 & -1.3834 & 0.086472 \tabularnewline
8 & 0.219914 & 1.5236 & 0.067084 \tabularnewline
9 & -0.065591 & -0.4544 & 0.325784 \tabularnewline
10 & -0.009159 & -0.0635 & 0.474833 \tabularnewline
11 & 0.080879 & 0.5603 & 0.288925 \tabularnewline
12 & -0.353018 & -2.4458 & 0.009085 \tabularnewline
13 & -0.115228 & -0.7983 & 0.214308 \tabularnewline
14 & -0.107256 & -0.7431 & 0.230523 \tabularnewline
15 & -0.034648 & -0.24 & 0.405657 \tabularnewline
16 & 0.000287 & 0.002 & 0.49921 \tabularnewline
17 & 0.004333 & 0.03 & 0.488087 \tabularnewline
18 & -0.141278 & -0.9788 & 0.166293 \tabularnewline
19 & 0.094562 & 0.6551 & 0.257752 \tabularnewline
20 & -0.056789 & -0.3934 & 0.347866 \tabularnewline
21 & 0.062157 & 0.4306 & 0.334331 \tabularnewline
22 & -0.186972 & -1.2954 & 0.100693 \tabularnewline
23 & 0.0796 & 0.5515 & 0.29193 \tabularnewline
24 & -0.044599 & -0.309 & 0.379332 \tabularnewline
25 & 0.127391 & 0.8826 & 0.190927 \tabularnewline
26 & 0.072127 & 0.4997 & 0.309782 \tabularnewline
27 & -0.023339 & -0.1617 & 0.436112 \tabularnewline
28 & -0.036979 & -0.2562 & 0.399446 \tabularnewline
29 & -0.019214 & -0.1331 & 0.447327 \tabularnewline
30 & -0.080545 & -0.558 & 0.289709 \tabularnewline
31 & -0.027199 & -0.1884 & 0.425662 \tabularnewline
32 & -0.081364 & -0.5637 & 0.287788 \tabularnewline
33 & -0.087445 & -0.6058 & 0.273739 \tabularnewline
34 & 0.0832 & 0.5764 & 0.283511 \tabularnewline
35 & -0.071411 & -0.4948 & 0.311516 \tabularnewline
36 & -0.026936 & -0.1866 & 0.426374 \tabularnewline
\hline
\end{tabular}
%Source: https://freestatistics.org/blog/index.php?pk=34535&T=1

[TABLE]
[ROW][C]Autocorrelation Function[/C][/ROW]
[ROW][C]Time lag k[/C][C]ACF(k)[/C][C]T-STAT[/C][C]P-value[/C][/ROW]
[ROW][C]1[/C][C]-0.065141[/C][C]-0.4513[/C][C]0.3269[/C][/ROW]
[ROW][C]2[/C][C]0.214124[/C][C]1.4835[/C][C]0.07224[/C][/ROW]
[ROW][C]3[/C][C]0.151443[/C][C]1.0492[/C][C]0.149664[/C][/ROW]
[ROW][C]4[/C][C]-0.123027[/C][C]-0.8524[/C][C]0.199125[/C][/ROW]
[ROW][C]5[/C][C]0.206456[/C][C]1.4304[/C][C]0.079544[/C][/ROW]
[ROW][C]6[/C][C]0.149486[/C][C]1.0357[/C][C]0.152773[/C][/ROW]
[ROW][C]7[/C][C]-0.199676[/C][C]-1.3834[/C][C]0.086472[/C][/ROW]
[ROW][C]8[/C][C]0.219914[/C][C]1.5236[/C][C]0.067084[/C][/ROW]
[ROW][C]9[/C][C]-0.065591[/C][C]-0.4544[/C][C]0.325784[/C][/ROW]
[ROW][C]10[/C][C]-0.009159[/C][C]-0.0635[/C][C]0.474833[/C][/ROW]
[ROW][C]11[/C][C]0.080879[/C][C]0.5603[/C][C]0.288925[/C][/ROW]
[ROW][C]12[/C][C]-0.353018[/C][C]-2.4458[/C][C]0.009085[/C][/ROW]
[ROW][C]13[/C][C]-0.115228[/C][C]-0.7983[/C][C]0.214308[/C][/ROW]
[ROW][C]14[/C][C]-0.107256[/C][C]-0.7431[/C][C]0.230523[/C][/ROW]
[ROW][C]15[/C][C]-0.034648[/C][C]-0.24[/C][C]0.405657[/C][/ROW]
[ROW][C]16[/C][C]0.000287[/C][C]0.002[/C][C]0.49921[/C][/ROW]
[ROW][C]17[/C][C]0.004333[/C][C]0.03[/C][C]0.488087[/C][/ROW]
[ROW][C]18[/C][C]-0.141278[/C][C]-0.9788[/C][C]0.166293[/C][/ROW]
[ROW][C]19[/C][C]0.094562[/C][C]0.6551[/C][C]0.257752[/C][/ROW]
[ROW][C]20[/C][C]-0.056789[/C][C]-0.3934[/C][C]0.347866[/C][/ROW]
[ROW][C]21[/C][C]0.062157[/C][C]0.4306[/C][C]0.334331[/C][/ROW]
[ROW][C]22[/C][C]-0.186972[/C][C]-1.2954[/C][C]0.100693[/C][/ROW]
[ROW][C]23[/C][C]0.0796[/C][C]0.5515[/C][C]0.29193[/C][/ROW]
[ROW][C]24[/C][C]-0.044599[/C][C]-0.309[/C][C]0.379332[/C][/ROW]
[ROW][C]25[/C][C]0.127391[/C][C]0.8826[/C][C]0.190927[/C][/ROW]
[ROW][C]26[/C][C]0.072127[/C][C]0.4997[/C][C]0.309782[/C][/ROW]
[ROW][C]27[/C][C]-0.023339[/C][C]-0.1617[/C][C]0.436112[/C][/ROW]
[ROW][C]28[/C][C]-0.036979[/C][C]-0.2562[/C][C]0.399446[/C][/ROW]
[ROW][C]29[/C][C]-0.019214[/C][C]-0.1331[/C][C]0.447327[/C][/ROW]
[ROW][C]30[/C][C]-0.080545[/C][C]-0.558[/C][C]0.289709[/C][/ROW]
[ROW][C]31[/C][C]-0.027199[/C][C]-0.1884[/C][C]0.425662[/C][/ROW]
[ROW][C]32[/C][C]-0.081364[/C][C]-0.5637[/C][C]0.287788[/C][/ROW]
[ROW][C]33[/C][C]-0.087445[/C][C]-0.6058[/C][C]0.273739[/C][/ROW]
[ROW][C]34[/C][C]0.0832[/C][C]0.5764[/C][C]0.283511[/C][/ROW]
[ROW][C]35[/C][C]-0.071411[/C][C]-0.4948[/C][C]0.311516[/C][/ROW]
[ROW][C]36[/C][C]-0.026936[/C][C]-0.1866[/C][C]0.426374[/C][/ROW]
[/TABLE]
Source: https://freestatistics.org/blog/index.php?pk=34535&T=1

Globally Unique Identifier (entire table): ba.freestatistics.org/blog/index.php?pk=34535&T=1

As an alternative you can also use a QR Code:  

The GUIDs for individual cells are displayed in the table below:

Autocorrelation Function
Time lag kACF(k)T-STATP-value
1-0.065141-0.45130.3269
20.2141241.48350.07224
30.1514431.04920.149664
4-0.123027-0.85240.199125
50.2064561.43040.079544
60.1494861.03570.152773
7-0.199676-1.38340.086472
80.2199141.52360.067084
9-0.065591-0.45440.325784
10-0.009159-0.06350.474833
110.0808790.56030.288925
12-0.353018-2.44580.009085
13-0.115228-0.79830.214308
14-0.107256-0.74310.230523
15-0.034648-0.240.405657
160.0002870.0020.49921
170.0043330.030.488087
18-0.141278-0.97880.166293
190.0945620.65510.257752
20-0.056789-0.39340.347866
210.0621570.43060.334331
22-0.186972-1.29540.100693
230.07960.55150.29193
24-0.044599-0.3090.379332
250.1273910.88260.190927
260.0721270.49970.309782
27-0.023339-0.16170.436112
28-0.036979-0.25620.399446
29-0.019214-0.13310.447327
30-0.080545-0.5580.289709
31-0.027199-0.18840.425662
32-0.081364-0.56370.287788
33-0.087445-0.60580.273739
340.08320.57640.283511
35-0.071411-0.49480.311516
36-0.026936-0.18660.426374


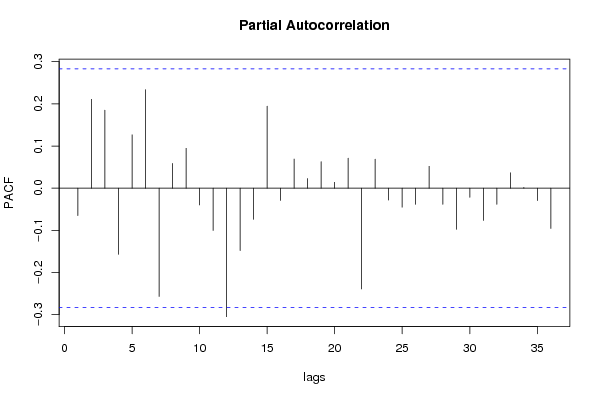
Partial Autocorrelation Function
Time lag kPACF(k)T-STATP-value
1-0.065141-0.45130.3269
20.2107751.46030.075362
30.1851581.28280.102859
4-0.157188-1.0890.140789
50.1266050.87710.192389
60.2335841.61830.056073
7-0.25721-1.7820.040538
80.0585960.4060.343286
90.0944710.65450.257952
10-0.039812-0.27580.391932
11-0.100319-0.6950.245194
12-0.305034-2.11330.019898
13-0.148099-1.02610.155003
14-0.073943-0.51230.305397
150.1944011.34680.092177
16-0.029086-0.20150.420575
170.0691020.47880.317144
180.0228160.15810.43753
190.0628530.43550.33259
200.013770.09540.462198
210.0712080.49330.312009
22-0.239385-1.65850.051868
230.068640.47550.318276
24-0.028417-0.19690.422376
25-0.045201-0.31320.377756
26-0.03841-0.26610.395645
270.0518490.35920.360504
28-0.038322-0.26550.395879
29-0.097848-0.67790.250543
30-0.021742-0.15060.440448
31-0.076727-0.53160.298735
32-0.038331-0.26560.395856
330.0363950.25210.401001
340.0017690.01230.495137
35-0.029546-0.20470.419336
36-0.09567-0.66280.255309

\begin{tabular}{lllllllll}
\hline
Partial Autocorrelation Function \tabularnewline
Time lag k & PACF(k) & T-STAT & P-value \tabularnewline
1 & -0.065141 & -0.4513 & 0.3269 \tabularnewline
2 & 0.210775 & 1.4603 & 0.075362 \tabularnewline
3 & 0.185158 & 1.2828 & 0.102859 \tabularnewline
4 & -0.157188 & -1.089 & 0.140789 \tabularnewline
5 & 0.126605 & 0.8771 & 0.192389 \tabularnewline
6 & 0.233584 & 1.6183 & 0.056073 \tabularnewline
7 & -0.25721 & -1.782 & 0.040538 \tabularnewline
8 & 0.058596 & 0.406 & 0.343286 \tabularnewline
9 & 0.094471 & 0.6545 & 0.257952 \tabularnewline
10 & -0.039812 & -0.2758 & 0.391932 \tabularnewline
11 & -0.100319 & -0.695 & 0.245194 \tabularnewline
12 & -0.305034 & -2.1133 & 0.019898 \tabularnewline
13 & -0.148099 & -1.0261 & 0.155003 \tabularnewline
14 & -0.073943 & -0.5123 & 0.305397 \tabularnewline
15 & 0.194401 & 1.3468 & 0.092177 \tabularnewline
16 & -0.029086 & -0.2015 & 0.420575 \tabularnewline
17 & 0.069102 & 0.4788 & 0.317144 \tabularnewline
18 & 0.022816 & 0.1581 & 0.43753 \tabularnewline
19 & 0.062853 & 0.4355 & 0.33259 \tabularnewline
20 & 0.01377 & 0.0954 & 0.462198 \tabularnewline
21 & 0.071208 & 0.4933 & 0.312009 \tabularnewline
22 & -0.239385 & -1.6585 & 0.051868 \tabularnewline
23 & 0.06864 & 0.4755 & 0.318276 \tabularnewline
24 & -0.028417 & -0.1969 & 0.422376 \tabularnewline
25 & -0.045201 & -0.3132 & 0.377756 \tabularnewline
26 & -0.03841 & -0.2661 & 0.395645 \tabularnewline
27 & 0.051849 & 0.3592 & 0.360504 \tabularnewline
28 & -0.038322 & -0.2655 & 0.395879 \tabularnewline
29 & -0.097848 & -0.6779 & 0.250543 \tabularnewline
30 & -0.021742 & -0.1506 & 0.440448 \tabularnewline
31 & -0.076727 & -0.5316 & 0.298735 \tabularnewline
32 & -0.038331 & -0.2656 & 0.395856 \tabularnewline
33 & 0.036395 & 0.2521 & 0.401001 \tabularnewline
34 & 0.001769 & 0.0123 & 0.495137 \tabularnewline
35 & -0.029546 & -0.2047 & 0.419336 \tabularnewline
36 & -0.09567 & -0.6628 & 0.255309 \tabularnewline
\hline
\end{tabular}
%Source: https://freestatistics.org/blog/index.php?pk=34535&T=2

[TABLE]
[ROW][C]Partial Autocorrelation Function[/C][/ROW]
[ROW][C]Time lag k[/C][C]PACF(k)[/C][C]T-STAT[/C][C]P-value[/C][/ROW]
[ROW][C]1[/C][C]-0.065141[/C][C]-0.4513[/C][C]0.3269[/C][/ROW]
[ROW][C]2[/C][C]0.210775[/C][C]1.4603[/C][C]0.075362[/C][/ROW]
[ROW][C]3[/C][C]0.185158[/C][C]1.2828[/C][C]0.102859[/C][/ROW]
[ROW][C]4[/C][C]-0.157188[/C][C]-1.089[/C][C]0.140789[/C][/ROW]
[ROW][C]5[/C][C]0.126605[/C][C]0.8771[/C][C]0.192389[/C][/ROW]
[ROW][C]6[/C][C]0.233584[/C][C]1.6183[/C][C]0.056073[/C][/ROW]
[ROW][C]7[/C][C]-0.25721[/C][C]-1.782[/C][C]0.040538[/C][/ROW]
[ROW][C]8[/C][C]0.058596[/C][C]0.406[/C][C]0.343286[/C][/ROW]
[ROW][C]9[/C][C]0.094471[/C][C]0.6545[/C][C]0.257952[/C][/ROW]
[ROW][C]10[/C][C]-0.039812[/C][C]-0.2758[/C][C]0.391932[/C][/ROW]
[ROW][C]11[/C][C]-0.100319[/C][C]-0.695[/C][C]0.245194[/C][/ROW]
[ROW][C]12[/C][C]-0.305034[/C][C]-2.1133[/C][C]0.019898[/C][/ROW]
[ROW][C]13[/C][C]-0.148099[/C][C]-1.0261[/C][C]0.155003[/C][/ROW]
[ROW][C]14[/C][C]-0.073943[/C][C]-0.5123[/C][C]0.305397[/C][/ROW]
[ROW][C]15[/C][C]0.194401[/C][C]1.3468[/C][C]0.092177[/C][/ROW]
[ROW][C]16[/C][C]-0.029086[/C][C]-0.2015[/C][C]0.420575[/C][/ROW]
[ROW][C]17[/C][C]0.069102[/C][C]0.4788[/C][C]0.317144[/C][/ROW]
[ROW][C]18[/C][C]0.022816[/C][C]0.1581[/C][C]0.43753[/C][/ROW]
[ROW][C]19[/C][C]0.062853[/C][C]0.4355[/C][C]0.33259[/C][/ROW]
[ROW][C]20[/C][C]0.01377[/C][C]0.0954[/C][C]0.462198[/C][/ROW]
[ROW][C]21[/C][C]0.071208[/C][C]0.4933[/C][C]0.312009[/C][/ROW]
[ROW][C]22[/C][C]-0.239385[/C][C]-1.6585[/C][C]0.051868[/C][/ROW]
[ROW][C]23[/C][C]0.06864[/C][C]0.4755[/C][C]0.318276[/C][/ROW]
[ROW][C]24[/C][C]-0.028417[/C][C]-0.1969[/C][C]0.422376[/C][/ROW]
[ROW][C]25[/C][C]-0.045201[/C][C]-0.3132[/C][C]0.377756[/C][/ROW]
[ROW][C]26[/C][C]-0.03841[/C][C]-0.2661[/C][C]0.395645[/C][/ROW]
[ROW][C]27[/C][C]0.051849[/C][C]0.3592[/C][C]0.360504[/C][/ROW]
[ROW][C]28[/C][C]-0.038322[/C][C]-0.2655[/C][C]0.395879[/C][/ROW]
[ROW][C]29[/C][C]-0.097848[/C][C]-0.6779[/C][C]0.250543[/C][/ROW]
[ROW][C]30[/C][C]-0.021742[/C][C]-0.1506[/C][C]0.440448[/C][/ROW]
[ROW][C]31[/C][C]-0.076727[/C][C]-0.5316[/C][C]0.298735[/C][/ROW]
[ROW][C]32[/C][C]-0.038331[/C][C]-0.2656[/C][C]0.395856[/C][/ROW]
[ROW][C]33[/C][C]0.036395[/C][C]0.2521[/C][C]0.401001[/C][/ROW]
[ROW][C]34[/C][C]0.001769[/C][C]0.0123[/C][C]0.495137[/C][/ROW]
[ROW][C]35[/C][C]-0.029546[/C][C]-0.2047[/C][C]0.419336[/C][/ROW]
[ROW][C]36[/C][C]-0.09567[/C][C]-0.6628[/C][C]0.255309[/C][/ROW]
[/TABLE]
Source: https://freestatistics.org/blog/index.php?pk=34535&T=2

Globally Unique Identifier (entire table): ba.freestatistics.org/blog/index.php?pk=34535&T=2

As an alternative you can also use a QR Code:  

The GUIDs for individual cells are displayed in the table below:

Partial Autocorrelation Function
Time lag kPACF(k)T-STATP-value
1-0.065141-0.45130.3269
20.2107751.46030.075362
30.1851581.28280.102859
4-0.157188-1.0890.140789
50.1266050.87710.192389
60.2335841.61830.056073
7-0.25721-1.7820.040538
80.0585960.4060.343286
90.0944710.65450.257952
10-0.039812-0.27580.391932
11-0.100319-0.6950.245194
12-0.305034-2.11330.019898
13-0.148099-1.02610.155003
14-0.073943-0.51230.305397
150.1944011.34680.092177
16-0.029086-0.20150.420575
170.0691020.47880.317144
180.0228160.15810.43753
190.0628530.43550.33259
200.013770.09540.462198
210.0712080.49330.312009
22-0.239385-1.65850.051868
230.068640.47550.318276
24-0.028417-0.19690.422376
25-0.045201-0.31320.377756
26-0.03841-0.26610.395645
270.0518490.35920.360504
28-0.038322-0.26550.395879
29-0.097848-0.67790.250543
30-0.021742-0.15060.440448
31-0.076727-0.53160.298735
32-0.038331-0.26560.395856
330.0363950.25210.401001
340.0017690.01230.495137
35-0.029546-0.20470.419336
36-0.09567-0.66280.255309


Parameters (Session):
par1 = 36 ; par2 = 1 ; par3 = 0 ; par4 = 1 ; par5 = 12 ;
Parameters (R input):
par1 = 36 ; par2 = 1 ; par3 = 0 ; par4 = 1 ; par5 = 12 ;
R code (references can be found in the software module):
if (par1 == 'Default') {
par1 = 10*log10(length(x))
} else {
par1 <- as.numeric(par1)
}
par2 <- as.numeric(par2)
par3 <- as.numeric(par3)
par4 <- as.numeric(par4)
par5 <- as.numeric(par5)
if (par2 == 0) {
x <- log(x)
} else {
x <- (x ^ par2 - 1) / par2
}
if (par3 > 0) x <- diff(x,lag=1,difference=par3)
if (par4 > 0) x <- diff(x,lag=par5,difference=par4)
bitmap(file='pic1.png')
racf <- acf(x,par1,main='Autocorrelation',xlab='lags',ylab='ACF')
dev.off()
bitmap(file='pic2.png')
rpacf <- pacf(x,par1,main='Partial Autocorrelation',xlab='lags',ylab='PACF')
dev.off()
(myacf <- c(racf$acf))
(mypacf <- c(rpacf$acf))
lengthx <- length(x)
sqrtn <- sqrt(lengthx)
load(file='createtable')
a<-table.start()
a<-table.row.start(a)
a<-table.element(a,'Autocorrelation Function',4,TRUE)
a<-table.row.end(a)
a<-table.row.start(a)
a<-table.element(a,'Time lag k',header=TRUE)
a<-table.element(a,hyperlink('basics.htm','ACF(k)','click here for more information about the Autocorrelation Function'),header=TRUE)
a<-table.element(a,'T-STAT',header=TRUE)
a<-table.element(a,'P-value',header=TRUE)
a<-table.row.end(a)
for (i in 2:(par1+1)) {
a<-table.row.start(a)
a<-table.element(a,i-1,header=TRUE)
a<-table.element(a,round(myacf[i],6))
mytstat <- myacf[i]*sqrtn
a<-table.element(a,round(mytstat,4))
a<-table.element(a,round(1-pt(abs(mytstat),lengthx),6))
a<-table.row.end(a)
}
a<-table.end(a)
table.save(a,file='mytable.tab')
a<-table.start()
a<-table.row.start(a)
a<-table.element(a,'Partial Autocorrelation Function',4,TRUE)
a<-table.row.end(a)
a<-table.row.start(a)
a<-table.element(a,'Time lag k',header=TRUE)
a<-table.element(a,hyperlink('basics.htm','PACF(k)','click here for more information about the Partial Autocorrelation Function'),header=TRUE)
a<-table.element(a,'T-STAT',header=TRUE)
a<-table.element(a,'P-value',header=TRUE)
a<-table.row.end(a)
for (i in 1:par1) {
a<-table.row.start(a)
a<-table.element(a,i,header=TRUE)
a<-table.element(a,round(mypacf[i],6))
mytstat <- mypacf[i]*sqrtn
a<-table.element(a,round(mytstat,4))
a<-table.element(a,round(1-pt(abs(mytstat),lengthx),6))
a<-table.row.end(a)
}
a<-table.end(a)
table.save(a,file='mytable1.tab')