Free Statistics

of Irreproducible Research!

Author's title

Author*The author of this computation has been verified*
R Software Modulerwasp_autocorrelation.wasp
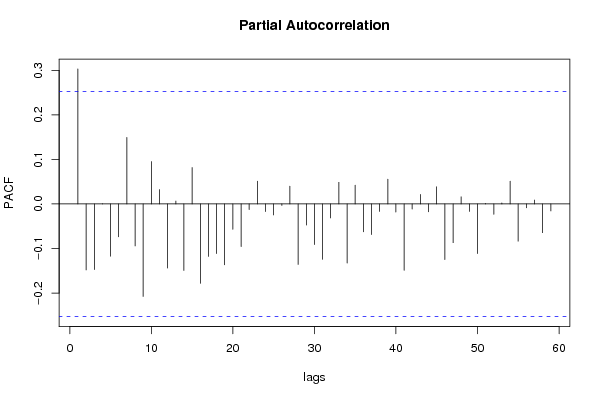
Title produced by software(Partial) Autocorrelation Function
Date of computationWed, 17 Dec 2008 12:57:12 -0700
Cite this page as followsStatistical Computations at FreeStatistics.org, Office for Research Development and Education, URL https://freestatistics.org/blog/index.php?v=date/2008/Dec/17/t12295441579p7v58krsbr2pq1.htm/, Retrieved Sun, 19 May 2024 05:53:22 +0000
Statistical Computations at FreeStatistics.org, Office for Research Development and Education, URL https://freestatistics.org/blog/index.php?pk=34534, Retrieved Sun, 19 May 2024 05:53:22 +0000
QR Codes:

Original text written by user:
IsPrivate?No (this computation is public)
User-defined keywords
Estimated Impact150
Family? (F = Feedback message, R = changed R code, M = changed R Module, P = changed Parameters, D = changed Data)
-     [(Partial) Autocorrelation Function] [Paper ACF compone...] [2008-12-17 19:49:08] [f9b9e85820b2a54b20380c3265aca831]
-   P   [(Partial) Autocorrelation Function] [Paper Stap 3 ACF] [2008-12-17 19:51:37] [f9b9e85820b2a54b20380c3265aca831]
-   P       [(Partial) Autocorrelation Function] [Paper ACF model m...] [2008-12-17 19:57:12] [0da3c04827d8ef68db874351a2e09488] [Current]
Feedback Forum

Post a new message
Dataseries X:
94.7
101.8
102.5
105.3
110.3
109.8
117.3
118.8
131.3
125.9
133.1
147
145.8
164.4
149.8
137.7
151.7
156.8
180
180.4
170.4
191.6
199.5
218.2
217.5
205
194
199.3
219.3
211.1
215.2
240.2
242.2
240.7
255.4
253
218.2
203.7
205.6
215.6
188.5
202.9
214
230.3
230
241
259.6
247.8
270.3
289.7
322.7
315
320.2
329.5
360.6
382.2
435.4
464
468.8
403
351.6


Summary of computational transaction
Raw Inputview raw input (R code)
Raw Outputview raw output of R engine
Computing time2 seconds
R Server'George Udny Yule' @ 72.249.76.132

\begin{tabular}{lllllllll}
\hline
Summary of computational transaction \tabularnewline
Raw Input & view raw input (R code)  \tabularnewline
Raw Output & view raw output of R engine  \tabularnewline
Computing time & 2 seconds \tabularnewline
R Server & 'George Udny Yule' @ 72.249.76.132 \tabularnewline
\hline
\end{tabular}
%Source: https://freestatistics.org/blog/index.php?pk=34534&T=0

[TABLE]
[ROW][C]Summary of computational transaction[/C][/ROW]
[ROW][C]Raw Input[/C][C]view raw input (R code) [/C][/ROW]
[ROW][C]Raw Output[/C][C]view raw output of R engine [/C][/ROW]
[ROW][C]Computing time[/C][C]2 seconds[/C][/ROW]
[ROW][C]R Server[/C][C]'George Udny Yule' @ 72.249.76.132[/C][/ROW]
[/TABLE]
Source: https://freestatistics.org/blog/index.php?pk=34534&T=0

Globally Unique Identifier (entire table): ba.freestatistics.org/blog/index.php?pk=34534&T=0

As an alternative you can also use a QR Code:  

The GUIDs for individual cells are displayed in the table below:

Summary of computational transaction
Raw Inputview raw input (R code)
Raw Outputview raw output of R engine
Computing time2 seconds
R Server'George Udny Yule' @ 72.249.76.132


Autocorrelation Function
Time lag kACF(k)T-STATP-value
10.3032522.3490.011068
2-0.042672-0.33050.371072
3-0.190614-1.47650.072521
4-0.102323-0.79260.21557
5-0.110362-0.85490.198015
6-0.094464-0.73170.233595
70.102890.7970.214302
80.0431450.33420.369696
9-0.159265-1.23370.11107
10-0.070704-0.54770.292975
110.0583010.45160.326593
12-0.008636-0.06690.473443
13-0.061961-0.47990.316506
14-0.123999-0.96050.170332
150.0644780.49940.309645
16-0.117656-0.91140.182877
17-0.138978-1.07650.143002
18-0.098996-0.76680.223097
19-0.069365-0.53730.296524
20-0.032379-0.25080.401409
21-0.031486-0.24390.404075
220.1211070.93810.175979
230.1845321.42940.07904
240.0758960.58790.279406
250.0278250.21550.415042
260.0280720.21740.414298
270.0407830.31590.376587
28-0.056846-0.44030.33064
29-0.097862-0.7580.225699
30-0.013955-0.10810.45714
31-0.04617-0.35760.360937
32-0.024499-0.18980.425065
330.1116920.86520.195198
340.085290.66070.255682
350.0874520.67740.250377
36-0.053962-0.4180.338725
37-0.026225-0.20310.419858
38-0.010257-0.07950.468468
390.0075050.05810.476918
400.0406410.31480.377001
41-0.094586-0.73270.233309
42-0.08384-0.64940.259272
43-0.028814-0.22320.412071
440.0442350.34260.366533
450.1090820.84490.200749
460.0192390.1490.441017
47-0.036991-0.28650.38773
48-0.010761-0.08340.466922
49-0.029571-0.22910.409802
500.0236490.18320.427635
51-0.011147-0.08630.465739
52-0.021185-0.16410.435102
53-0.005398-0.04180.483392
54-0.00029-0.00220.499108
550.0125260.0970.461513
560.0061490.04760.481086
570.015780.12220.451563
589e-057e-040.499722
59-0.007393-0.05730.477263
60NANANA

\begin{tabular}{lllllllll}
\hline
Autocorrelation Function \tabularnewline
Time lag k & ACF(k) & T-STAT & P-value \tabularnewline
1 & 0.303252 & 2.349 & 0.011068 \tabularnewline
2 & -0.042672 & -0.3305 & 0.371072 \tabularnewline
3 & -0.190614 & -1.4765 & 0.072521 \tabularnewline
4 & -0.102323 & -0.7926 & 0.21557 \tabularnewline
5 & -0.110362 & -0.8549 & 0.198015 \tabularnewline
6 & -0.094464 & -0.7317 & 0.233595 \tabularnewline
7 & 0.10289 & 0.797 & 0.214302 \tabularnewline
8 & 0.043145 & 0.3342 & 0.369696 \tabularnewline
9 & -0.159265 & -1.2337 & 0.11107 \tabularnewline
10 & -0.070704 & -0.5477 & 0.292975 \tabularnewline
11 & 0.058301 & 0.4516 & 0.326593 \tabularnewline
12 & -0.008636 & -0.0669 & 0.473443 \tabularnewline
13 & -0.061961 & -0.4799 & 0.316506 \tabularnewline
14 & -0.123999 & -0.9605 & 0.170332 \tabularnewline
15 & 0.064478 & 0.4994 & 0.309645 \tabularnewline
16 & -0.117656 & -0.9114 & 0.182877 \tabularnewline
17 & -0.138978 & -1.0765 & 0.143002 \tabularnewline
18 & -0.098996 & -0.7668 & 0.223097 \tabularnewline
19 & -0.069365 & -0.5373 & 0.296524 \tabularnewline
20 & -0.032379 & -0.2508 & 0.401409 \tabularnewline
21 & -0.031486 & -0.2439 & 0.404075 \tabularnewline
22 & 0.121107 & 0.9381 & 0.175979 \tabularnewline
23 & 0.184532 & 1.4294 & 0.07904 \tabularnewline
24 & 0.075896 & 0.5879 & 0.279406 \tabularnewline
25 & 0.027825 & 0.2155 & 0.415042 \tabularnewline
26 & 0.028072 & 0.2174 & 0.414298 \tabularnewline
27 & 0.040783 & 0.3159 & 0.376587 \tabularnewline
28 & -0.056846 & -0.4403 & 0.33064 \tabularnewline
29 & -0.097862 & -0.758 & 0.225699 \tabularnewline
30 & -0.013955 & -0.1081 & 0.45714 \tabularnewline
31 & -0.04617 & -0.3576 & 0.360937 \tabularnewline
32 & -0.024499 & -0.1898 & 0.425065 \tabularnewline
33 & 0.111692 & 0.8652 & 0.195198 \tabularnewline
34 & 0.08529 & 0.6607 & 0.255682 \tabularnewline
35 & 0.087452 & 0.6774 & 0.250377 \tabularnewline
36 & -0.053962 & -0.418 & 0.338725 \tabularnewline
37 & -0.026225 & -0.2031 & 0.419858 \tabularnewline
38 & -0.010257 & -0.0795 & 0.468468 \tabularnewline
39 & 0.007505 & 0.0581 & 0.476918 \tabularnewline
40 & 0.040641 & 0.3148 & 0.377001 \tabularnewline
41 & -0.094586 & -0.7327 & 0.233309 \tabularnewline
42 & -0.08384 & -0.6494 & 0.259272 \tabularnewline
43 & -0.028814 & -0.2232 & 0.412071 \tabularnewline
44 & 0.044235 & 0.3426 & 0.366533 \tabularnewline
45 & 0.109082 & 0.8449 & 0.200749 \tabularnewline
46 & 0.019239 & 0.149 & 0.441017 \tabularnewline
47 & -0.036991 & -0.2865 & 0.38773 \tabularnewline
48 & -0.010761 & -0.0834 & 0.466922 \tabularnewline
49 & -0.029571 & -0.2291 & 0.409802 \tabularnewline
50 & 0.023649 & 0.1832 & 0.427635 \tabularnewline
51 & -0.011147 & -0.0863 & 0.465739 \tabularnewline
52 & -0.021185 & -0.1641 & 0.435102 \tabularnewline
53 & -0.005398 & -0.0418 & 0.483392 \tabularnewline
54 & -0.00029 & -0.0022 & 0.499108 \tabularnewline
55 & 0.012526 & 0.097 & 0.461513 \tabularnewline
56 & 0.006149 & 0.0476 & 0.481086 \tabularnewline
57 & 0.01578 & 0.1222 & 0.451563 \tabularnewline
58 & 9e-05 & 7e-04 & 0.499722 \tabularnewline
59 & -0.007393 & -0.0573 & 0.477263 \tabularnewline
60 & NA & NA & NA \tabularnewline
\hline
\end{tabular}
%Source: https://freestatistics.org/blog/index.php?pk=34534&T=1

[TABLE]
[ROW][C]Autocorrelation Function[/C][/ROW]
[ROW][C]Time lag k[/C][C]ACF(k)[/C][C]T-STAT[/C][C]P-value[/C][/ROW]
[ROW][C]1[/C][C]0.303252[/C][C]2.349[/C][C]0.011068[/C][/ROW]
[ROW][C]2[/C][C]-0.042672[/C][C]-0.3305[/C][C]0.371072[/C][/ROW]
[ROW][C]3[/C][C]-0.190614[/C][C]-1.4765[/C][C]0.072521[/C][/ROW]
[ROW][C]4[/C][C]-0.102323[/C][C]-0.7926[/C][C]0.21557[/C][/ROW]
[ROW][C]5[/C][C]-0.110362[/C][C]-0.8549[/C][C]0.198015[/C][/ROW]
[ROW][C]6[/C][C]-0.094464[/C][C]-0.7317[/C][C]0.233595[/C][/ROW]
[ROW][C]7[/C][C]0.10289[/C][C]0.797[/C][C]0.214302[/C][/ROW]
[ROW][C]8[/C][C]0.043145[/C][C]0.3342[/C][C]0.369696[/C][/ROW]
[ROW][C]9[/C][C]-0.159265[/C][C]-1.2337[/C][C]0.11107[/C][/ROW]
[ROW][C]10[/C][C]-0.070704[/C][C]-0.5477[/C][C]0.292975[/C][/ROW]
[ROW][C]11[/C][C]0.058301[/C][C]0.4516[/C][C]0.326593[/C][/ROW]
[ROW][C]12[/C][C]-0.008636[/C][C]-0.0669[/C][C]0.473443[/C][/ROW]
[ROW][C]13[/C][C]-0.061961[/C][C]-0.4799[/C][C]0.316506[/C][/ROW]
[ROW][C]14[/C][C]-0.123999[/C][C]-0.9605[/C][C]0.170332[/C][/ROW]
[ROW][C]15[/C][C]0.064478[/C][C]0.4994[/C][C]0.309645[/C][/ROW]
[ROW][C]16[/C][C]-0.117656[/C][C]-0.9114[/C][C]0.182877[/C][/ROW]
[ROW][C]17[/C][C]-0.138978[/C][C]-1.0765[/C][C]0.143002[/C][/ROW]
[ROW][C]18[/C][C]-0.098996[/C][C]-0.7668[/C][C]0.223097[/C][/ROW]
[ROW][C]19[/C][C]-0.069365[/C][C]-0.5373[/C][C]0.296524[/C][/ROW]
[ROW][C]20[/C][C]-0.032379[/C][C]-0.2508[/C][C]0.401409[/C][/ROW]
[ROW][C]21[/C][C]-0.031486[/C][C]-0.2439[/C][C]0.404075[/C][/ROW]
[ROW][C]22[/C][C]0.121107[/C][C]0.9381[/C][C]0.175979[/C][/ROW]
[ROW][C]23[/C][C]0.184532[/C][C]1.4294[/C][C]0.07904[/C][/ROW]
[ROW][C]24[/C][C]0.075896[/C][C]0.5879[/C][C]0.279406[/C][/ROW]
[ROW][C]25[/C][C]0.027825[/C][C]0.2155[/C][C]0.415042[/C][/ROW]
[ROW][C]26[/C][C]0.028072[/C][C]0.2174[/C][C]0.414298[/C][/ROW]
[ROW][C]27[/C][C]0.040783[/C][C]0.3159[/C][C]0.376587[/C][/ROW]
[ROW][C]28[/C][C]-0.056846[/C][C]-0.4403[/C][C]0.33064[/C][/ROW]
[ROW][C]29[/C][C]-0.097862[/C][C]-0.758[/C][C]0.225699[/C][/ROW]
[ROW][C]30[/C][C]-0.013955[/C][C]-0.1081[/C][C]0.45714[/C][/ROW]
[ROW][C]31[/C][C]-0.04617[/C][C]-0.3576[/C][C]0.360937[/C][/ROW]
[ROW][C]32[/C][C]-0.024499[/C][C]-0.1898[/C][C]0.425065[/C][/ROW]
[ROW][C]33[/C][C]0.111692[/C][C]0.8652[/C][C]0.195198[/C][/ROW]
[ROW][C]34[/C][C]0.08529[/C][C]0.6607[/C][C]0.255682[/C][/ROW]
[ROW][C]35[/C][C]0.087452[/C][C]0.6774[/C][C]0.250377[/C][/ROW]
[ROW][C]36[/C][C]-0.053962[/C][C]-0.418[/C][C]0.338725[/C][/ROW]
[ROW][C]37[/C][C]-0.026225[/C][C]-0.2031[/C][C]0.419858[/C][/ROW]
[ROW][C]38[/C][C]-0.010257[/C][C]-0.0795[/C][C]0.468468[/C][/ROW]
[ROW][C]39[/C][C]0.007505[/C][C]0.0581[/C][C]0.476918[/C][/ROW]
[ROW][C]40[/C][C]0.040641[/C][C]0.3148[/C][C]0.377001[/C][/ROW]
[ROW][C]41[/C][C]-0.094586[/C][C]-0.7327[/C][C]0.233309[/C][/ROW]
[ROW][C]42[/C][C]-0.08384[/C][C]-0.6494[/C][C]0.259272[/C][/ROW]
[ROW][C]43[/C][C]-0.028814[/C][C]-0.2232[/C][C]0.412071[/C][/ROW]
[ROW][C]44[/C][C]0.044235[/C][C]0.3426[/C][C]0.366533[/C][/ROW]
[ROW][C]45[/C][C]0.109082[/C][C]0.8449[/C][C]0.200749[/C][/ROW]
[ROW][C]46[/C][C]0.019239[/C][C]0.149[/C][C]0.441017[/C][/ROW]
[ROW][C]47[/C][C]-0.036991[/C][C]-0.2865[/C][C]0.38773[/C][/ROW]
[ROW][C]48[/C][C]-0.010761[/C][C]-0.0834[/C][C]0.466922[/C][/ROW]
[ROW][C]49[/C][C]-0.029571[/C][C]-0.2291[/C][C]0.409802[/C][/ROW]
[ROW][C]50[/C][C]0.023649[/C][C]0.1832[/C][C]0.427635[/C][/ROW]
[ROW][C]51[/C][C]-0.011147[/C][C]-0.0863[/C][C]0.465739[/C][/ROW]
[ROW][C]52[/C][C]-0.021185[/C][C]-0.1641[/C][C]0.435102[/C][/ROW]
[ROW][C]53[/C][C]-0.005398[/C][C]-0.0418[/C][C]0.483392[/C][/ROW]
[ROW][C]54[/C][C]-0.00029[/C][C]-0.0022[/C][C]0.499108[/C][/ROW]
[ROW][C]55[/C][C]0.012526[/C][C]0.097[/C][C]0.461513[/C][/ROW]
[ROW][C]56[/C][C]0.006149[/C][C]0.0476[/C][C]0.481086[/C][/ROW]
[ROW][C]57[/C][C]0.01578[/C][C]0.1222[/C][C]0.451563[/C][/ROW]
[ROW][C]58[/C][C]9e-05[/C][C]7e-04[/C][C]0.499722[/C][/ROW]
[ROW][C]59[/C][C]-0.007393[/C][C]-0.0573[/C][C]0.477263[/C][/ROW]
[ROW][C]60[/C][C]NA[/C][C]NA[/C][C]NA[/C][/ROW]
[/TABLE]
Source: https://freestatistics.org/blog/index.php?pk=34534&T=1

Globally Unique Identifier (entire table): ba.freestatistics.org/blog/index.php?pk=34534&T=1

As an alternative you can also use a QR Code:  

The GUIDs for individual cells are displayed in the table below:

Autocorrelation Function
Time lag kACF(k)T-STATP-value
10.3032522.3490.011068
2-0.042672-0.33050.371072
3-0.190614-1.47650.072521
4-0.102323-0.79260.21557
5-0.110362-0.85490.198015
6-0.094464-0.73170.233595
70.102890.7970.214302
80.0431450.33420.369696
9-0.159265-1.23370.11107
10-0.070704-0.54770.292975
110.0583010.45160.326593
12-0.008636-0.06690.473443
13-0.061961-0.47990.316506
14-0.123999-0.96050.170332
150.0644780.49940.309645
16-0.117656-0.91140.182877
17-0.138978-1.07650.143002
18-0.098996-0.76680.223097
19-0.069365-0.53730.296524
20-0.032379-0.25080.401409
21-0.031486-0.24390.404075
220.1211070.93810.175979
230.1845321.42940.07904
240.0758960.58790.279406
250.0278250.21550.415042
260.0280720.21740.414298
270.0407830.31590.376587
28-0.056846-0.44030.33064
29-0.097862-0.7580.225699
30-0.013955-0.10810.45714
31-0.04617-0.35760.360937
32-0.024499-0.18980.425065
330.1116920.86520.195198
340.085290.66070.255682
350.0874520.67740.250377
36-0.053962-0.4180.338725
37-0.026225-0.20310.419858
38-0.010257-0.07950.468468
390.0075050.05810.476918
400.0406410.31480.377001
41-0.094586-0.73270.233309
42-0.08384-0.64940.259272
43-0.028814-0.22320.412071
440.0442350.34260.366533
450.1090820.84490.200749
460.0192390.1490.441017
47-0.036991-0.28650.38773
48-0.010761-0.08340.466922
49-0.029571-0.22910.409802
500.0236490.18320.427635
51-0.011147-0.08630.465739
52-0.021185-0.16410.435102
53-0.005398-0.04180.483392
54-0.00029-0.00220.499108
550.0125260.0970.461513
560.0061490.04760.481086
570.015780.12220.451563
589e-057e-040.499722
59-0.007393-0.05730.477263
60NANANA


Partial Autocorrelation Function
Time lag kPACF(k)T-STATP-value
10.3032522.3490.011068
2-0.148269-1.14850.127663
3-0.147275-1.14080.129245
40.0004750.00370.49854
5-0.117254-0.90820.183691
6-0.073729-0.57110.285031
70.1494261.15740.125838
8-0.094314-0.73060.233947
9-0.207582-1.60790.056551
100.095330.73840.231567
110.032440.25130.401229
12-0.143978-1.11520.134595
130.0066710.05170.479479
14-0.149193-1.15560.126204
150.0818370.63390.264276
16-0.17825-1.38070.086244
17-0.117944-0.91360.182295
18-0.111318-0.86230.195988
19-0.136706-1.05890.146941
20-0.056997-0.44150.33022
21-0.095559-0.74020.231034
22-0.012615-0.09770.461243
230.0511490.39620.346683
24-0.017006-0.13170.447819
25-0.024509-0.18980.425034
26-0.003408-0.02640.489514
270.0400680.31040.378679
28-0.135772-1.05170.148581
29-0.047237-0.36590.357864
30-0.091262-0.70690.241179
31-0.124341-0.96310.169672
32-0.03149-0.24390.404063
330.0488130.37810.353345
34-0.132576-1.02690.154288
350.0422660.32740.372256
36-0.062503-0.48410.315023
37-0.068648-0.53170.298433
38-0.016643-0.12890.448928
390.0555710.43050.334205
40-0.018287-0.14170.443915
41-0.148862-1.15310.126726
42-0.011534-0.08930.464554
430.0215010.16650.434145
44-0.017631-0.13660.445913
450.038530.29850.383195
46-0.124846-0.96710.1687
47-0.087041-0.67420.251381
480.016020.12410.450829
49-0.016761-0.12980.448569
50-0.111336-0.86240.19595
510.0011880.00920.496345
52-0.023189-0.17960.429028
530.0024470.0190.492469
540.0512670.39710.346347
55-0.083473-0.64660.260186
56-0.008668-0.06710.473346
570.0088860.06880.472678
58-0.064518-0.49980.309539
59-0.015596-0.12080.452125
60NANANA

\begin{tabular}{lllllllll}
\hline
Partial Autocorrelation Function \tabularnewline
Time lag k & PACF(k) & T-STAT & P-value \tabularnewline
1 & 0.303252 & 2.349 & 0.011068 \tabularnewline
2 & -0.148269 & -1.1485 & 0.127663 \tabularnewline
3 & -0.147275 & -1.1408 & 0.129245 \tabularnewline
4 & 0.000475 & 0.0037 & 0.49854 \tabularnewline
5 & -0.117254 & -0.9082 & 0.183691 \tabularnewline
6 & -0.073729 & -0.5711 & 0.285031 \tabularnewline
7 & 0.149426 & 1.1574 & 0.125838 \tabularnewline
8 & -0.094314 & -0.7306 & 0.233947 \tabularnewline
9 & -0.207582 & -1.6079 & 0.056551 \tabularnewline
10 & 0.09533 & 0.7384 & 0.231567 \tabularnewline
11 & 0.03244 & 0.2513 & 0.401229 \tabularnewline
12 & -0.143978 & -1.1152 & 0.134595 \tabularnewline
13 & 0.006671 & 0.0517 & 0.479479 \tabularnewline
14 & -0.149193 & -1.1556 & 0.126204 \tabularnewline
15 & 0.081837 & 0.6339 & 0.264276 \tabularnewline
16 & -0.17825 & -1.3807 & 0.086244 \tabularnewline
17 & -0.117944 & -0.9136 & 0.182295 \tabularnewline
18 & -0.111318 & -0.8623 & 0.195988 \tabularnewline
19 & -0.136706 & -1.0589 & 0.146941 \tabularnewline
20 & -0.056997 & -0.4415 & 0.33022 \tabularnewline
21 & -0.095559 & -0.7402 & 0.231034 \tabularnewline
22 & -0.012615 & -0.0977 & 0.461243 \tabularnewline
23 & 0.051149 & 0.3962 & 0.346683 \tabularnewline
24 & -0.017006 & -0.1317 & 0.447819 \tabularnewline
25 & -0.024509 & -0.1898 & 0.425034 \tabularnewline
26 & -0.003408 & -0.0264 & 0.489514 \tabularnewline
27 & 0.040068 & 0.3104 & 0.378679 \tabularnewline
28 & -0.135772 & -1.0517 & 0.148581 \tabularnewline
29 & -0.047237 & -0.3659 & 0.357864 \tabularnewline
30 & -0.091262 & -0.7069 & 0.241179 \tabularnewline
31 & -0.124341 & -0.9631 & 0.169672 \tabularnewline
32 & -0.03149 & -0.2439 & 0.404063 \tabularnewline
33 & 0.048813 & 0.3781 & 0.353345 \tabularnewline
34 & -0.132576 & -1.0269 & 0.154288 \tabularnewline
35 & 0.042266 & 0.3274 & 0.372256 \tabularnewline
36 & -0.062503 & -0.4841 & 0.315023 \tabularnewline
37 & -0.068648 & -0.5317 & 0.298433 \tabularnewline
38 & -0.016643 & -0.1289 & 0.448928 \tabularnewline
39 & 0.055571 & 0.4305 & 0.334205 \tabularnewline
40 & -0.018287 & -0.1417 & 0.443915 \tabularnewline
41 & -0.148862 & -1.1531 & 0.126726 \tabularnewline
42 & -0.011534 & -0.0893 & 0.464554 \tabularnewline
43 & 0.021501 & 0.1665 & 0.434145 \tabularnewline
44 & -0.017631 & -0.1366 & 0.445913 \tabularnewline
45 & 0.03853 & 0.2985 & 0.383195 \tabularnewline
46 & -0.124846 & -0.9671 & 0.1687 \tabularnewline
47 & -0.087041 & -0.6742 & 0.251381 \tabularnewline
48 & 0.01602 & 0.1241 & 0.450829 \tabularnewline
49 & -0.016761 & -0.1298 & 0.448569 \tabularnewline
50 & -0.111336 & -0.8624 & 0.19595 \tabularnewline
51 & 0.001188 & 0.0092 & 0.496345 \tabularnewline
52 & -0.023189 & -0.1796 & 0.429028 \tabularnewline
53 & 0.002447 & 0.019 & 0.492469 \tabularnewline
54 & 0.051267 & 0.3971 & 0.346347 \tabularnewline
55 & -0.083473 & -0.6466 & 0.260186 \tabularnewline
56 & -0.008668 & -0.0671 & 0.473346 \tabularnewline
57 & 0.008886 & 0.0688 & 0.472678 \tabularnewline
58 & -0.064518 & -0.4998 & 0.309539 \tabularnewline
59 & -0.015596 & -0.1208 & 0.452125 \tabularnewline
60 & NA & NA & NA \tabularnewline
\hline
\end{tabular}
%Source: https://freestatistics.org/blog/index.php?pk=34534&T=2

[TABLE]
[ROW][C]Partial Autocorrelation Function[/C][/ROW]
[ROW][C]Time lag k[/C][C]PACF(k)[/C][C]T-STAT[/C][C]P-value[/C][/ROW]
[ROW][C]1[/C][C]0.303252[/C][C]2.349[/C][C]0.011068[/C][/ROW]
[ROW][C]2[/C][C]-0.148269[/C][C]-1.1485[/C][C]0.127663[/C][/ROW]
[ROW][C]3[/C][C]-0.147275[/C][C]-1.1408[/C][C]0.129245[/C][/ROW]
[ROW][C]4[/C][C]0.000475[/C][C]0.0037[/C][C]0.49854[/C][/ROW]
[ROW][C]5[/C][C]-0.117254[/C][C]-0.9082[/C][C]0.183691[/C][/ROW]
[ROW][C]6[/C][C]-0.073729[/C][C]-0.5711[/C][C]0.285031[/C][/ROW]
[ROW][C]7[/C][C]0.149426[/C][C]1.1574[/C][C]0.125838[/C][/ROW]
[ROW][C]8[/C][C]-0.094314[/C][C]-0.7306[/C][C]0.233947[/C][/ROW]
[ROW][C]9[/C][C]-0.207582[/C][C]-1.6079[/C][C]0.056551[/C][/ROW]
[ROW][C]10[/C][C]0.09533[/C][C]0.7384[/C][C]0.231567[/C][/ROW]
[ROW][C]11[/C][C]0.03244[/C][C]0.2513[/C][C]0.401229[/C][/ROW]
[ROW][C]12[/C][C]-0.143978[/C][C]-1.1152[/C][C]0.134595[/C][/ROW]
[ROW][C]13[/C][C]0.006671[/C][C]0.0517[/C][C]0.479479[/C][/ROW]
[ROW][C]14[/C][C]-0.149193[/C][C]-1.1556[/C][C]0.126204[/C][/ROW]
[ROW][C]15[/C][C]0.081837[/C][C]0.6339[/C][C]0.264276[/C][/ROW]
[ROW][C]16[/C][C]-0.17825[/C][C]-1.3807[/C][C]0.086244[/C][/ROW]
[ROW][C]17[/C][C]-0.117944[/C][C]-0.9136[/C][C]0.182295[/C][/ROW]
[ROW][C]18[/C][C]-0.111318[/C][C]-0.8623[/C][C]0.195988[/C][/ROW]
[ROW][C]19[/C][C]-0.136706[/C][C]-1.0589[/C][C]0.146941[/C][/ROW]
[ROW][C]20[/C][C]-0.056997[/C][C]-0.4415[/C][C]0.33022[/C][/ROW]
[ROW][C]21[/C][C]-0.095559[/C][C]-0.7402[/C][C]0.231034[/C][/ROW]
[ROW][C]22[/C][C]-0.012615[/C][C]-0.0977[/C][C]0.461243[/C][/ROW]
[ROW][C]23[/C][C]0.051149[/C][C]0.3962[/C][C]0.346683[/C][/ROW]
[ROW][C]24[/C][C]-0.017006[/C][C]-0.1317[/C][C]0.447819[/C][/ROW]
[ROW][C]25[/C][C]-0.024509[/C][C]-0.1898[/C][C]0.425034[/C][/ROW]
[ROW][C]26[/C][C]-0.003408[/C][C]-0.0264[/C][C]0.489514[/C][/ROW]
[ROW][C]27[/C][C]0.040068[/C][C]0.3104[/C][C]0.378679[/C][/ROW]
[ROW][C]28[/C][C]-0.135772[/C][C]-1.0517[/C][C]0.148581[/C][/ROW]
[ROW][C]29[/C][C]-0.047237[/C][C]-0.3659[/C][C]0.357864[/C][/ROW]
[ROW][C]30[/C][C]-0.091262[/C][C]-0.7069[/C][C]0.241179[/C][/ROW]
[ROW][C]31[/C][C]-0.124341[/C][C]-0.9631[/C][C]0.169672[/C][/ROW]
[ROW][C]32[/C][C]-0.03149[/C][C]-0.2439[/C][C]0.404063[/C][/ROW]
[ROW][C]33[/C][C]0.048813[/C][C]0.3781[/C][C]0.353345[/C][/ROW]
[ROW][C]34[/C][C]-0.132576[/C][C]-1.0269[/C][C]0.154288[/C][/ROW]
[ROW][C]35[/C][C]0.042266[/C][C]0.3274[/C][C]0.372256[/C][/ROW]
[ROW][C]36[/C][C]-0.062503[/C][C]-0.4841[/C][C]0.315023[/C][/ROW]
[ROW][C]37[/C][C]-0.068648[/C][C]-0.5317[/C][C]0.298433[/C][/ROW]
[ROW][C]38[/C][C]-0.016643[/C][C]-0.1289[/C][C]0.448928[/C][/ROW]
[ROW][C]39[/C][C]0.055571[/C][C]0.4305[/C][C]0.334205[/C][/ROW]
[ROW][C]40[/C][C]-0.018287[/C][C]-0.1417[/C][C]0.443915[/C][/ROW]
[ROW][C]41[/C][C]-0.148862[/C][C]-1.1531[/C][C]0.126726[/C][/ROW]
[ROW][C]42[/C][C]-0.011534[/C][C]-0.0893[/C][C]0.464554[/C][/ROW]
[ROW][C]43[/C][C]0.021501[/C][C]0.1665[/C][C]0.434145[/C][/ROW]
[ROW][C]44[/C][C]-0.017631[/C][C]-0.1366[/C][C]0.445913[/C][/ROW]
[ROW][C]45[/C][C]0.03853[/C][C]0.2985[/C][C]0.383195[/C][/ROW]
[ROW][C]46[/C][C]-0.124846[/C][C]-0.9671[/C][C]0.1687[/C][/ROW]
[ROW][C]47[/C][C]-0.087041[/C][C]-0.6742[/C][C]0.251381[/C][/ROW]
[ROW][C]48[/C][C]0.01602[/C][C]0.1241[/C][C]0.450829[/C][/ROW]
[ROW][C]49[/C][C]-0.016761[/C][C]-0.1298[/C][C]0.448569[/C][/ROW]
[ROW][C]50[/C][C]-0.111336[/C][C]-0.8624[/C][C]0.19595[/C][/ROW]
[ROW][C]51[/C][C]0.001188[/C][C]0.0092[/C][C]0.496345[/C][/ROW]
[ROW][C]52[/C][C]-0.023189[/C][C]-0.1796[/C][C]0.429028[/C][/ROW]
[ROW][C]53[/C][C]0.002447[/C][C]0.019[/C][C]0.492469[/C][/ROW]
[ROW][C]54[/C][C]0.051267[/C][C]0.3971[/C][C]0.346347[/C][/ROW]
[ROW][C]55[/C][C]-0.083473[/C][C]-0.6466[/C][C]0.260186[/C][/ROW]
[ROW][C]56[/C][C]-0.008668[/C][C]-0.0671[/C][C]0.473346[/C][/ROW]
[ROW][C]57[/C][C]0.008886[/C][C]0.0688[/C][C]0.472678[/C][/ROW]
[ROW][C]58[/C][C]-0.064518[/C][C]-0.4998[/C][C]0.309539[/C][/ROW]
[ROW][C]59[/C][C]-0.015596[/C][C]-0.1208[/C][C]0.452125[/C][/ROW]
[ROW][C]60[/C][C]NA[/C][C]NA[/C][C]NA[/C][/ROW]
[/TABLE]
Source: https://freestatistics.org/blog/index.php?pk=34534&T=2

Globally Unique Identifier (entire table): ba.freestatistics.org/blog/index.php?pk=34534&T=2

As an alternative you can also use a QR Code:  

The GUIDs for individual cells are displayed in the table below:

Partial Autocorrelation Function
Time lag kPACF(k)T-STATP-value
10.3032522.3490.011068
2-0.148269-1.14850.127663
3-0.147275-1.14080.129245
40.0004750.00370.49854
5-0.117254-0.90820.183691
6-0.073729-0.57110.285031
70.1494261.15740.125838
8-0.094314-0.73060.233947
9-0.207582-1.60790.056551
100.095330.73840.231567
110.032440.25130.401229
12-0.143978-1.11520.134595
130.0066710.05170.479479
14-0.149193-1.15560.126204
150.0818370.63390.264276
16-0.17825-1.38070.086244
17-0.117944-0.91360.182295
18-0.111318-0.86230.195988
19-0.136706-1.05890.146941
20-0.056997-0.44150.33022
21-0.095559-0.74020.231034
22-0.012615-0.09770.461243
230.0511490.39620.346683
24-0.017006-0.13170.447819
25-0.024509-0.18980.425034
26-0.003408-0.02640.489514
270.0400680.31040.378679
28-0.135772-1.05170.148581
29-0.047237-0.36590.357864
30-0.091262-0.70690.241179
31-0.124341-0.96310.169672
32-0.03149-0.24390.404063
330.0488130.37810.353345
34-0.132576-1.02690.154288
350.0422660.32740.372256
36-0.062503-0.48410.315023
37-0.068648-0.53170.298433
38-0.016643-0.12890.448928
390.0555710.43050.334205
40-0.018287-0.14170.443915
41-0.148862-1.15310.126726
42-0.011534-0.08930.464554
430.0215010.16650.434145
44-0.017631-0.13660.445913
450.038530.29850.383195
46-0.124846-0.96710.1687
47-0.087041-0.67420.251381
480.016020.12410.450829
49-0.016761-0.12980.448569
50-0.111336-0.86240.19595
510.0011880.00920.496345
52-0.023189-0.17960.429028
530.0024470.0190.492469
540.0512670.39710.346347
55-0.083473-0.64660.260186
56-0.008668-0.06710.473346
570.0088860.06880.472678
58-0.064518-0.49980.309539
59-0.015596-0.12080.452125
60NANANA


Parameters (Session):
par1 = 60 ; par2 = 1 ; par3 = 1 ; par4 = 0 ; par5 = 12 ;
Parameters (R input):
par1 = 60 ; par2 = 1 ; par3 = 1 ; par4 = 0 ; par5 = 12 ;
R code (references can be found in the software module):
if (par1 == 'Default') {
par1 = 10*log10(length(x))
} else {
par1 <- as.numeric(par1)
}
par2 <- as.numeric(par2)
par3 <- as.numeric(par3)
par4 <- as.numeric(par4)
par5 <- as.numeric(par5)
if (par2 == 0) {
x <- log(x)
} else {
x <- (x ^ par2 - 1) / par2
}
if (par3 > 0) x <- diff(x,lag=1,difference=par3)
if (par4 > 0) x <- diff(x,lag=par5,difference=par4)
bitmap(file='pic1.png')
racf <- acf(x,par1,main='Autocorrelation',xlab='lags',ylab='ACF')
dev.off()
bitmap(file='pic2.png')
rpacf <- pacf(x,par1,main='Partial Autocorrelation',xlab='lags',ylab='PACF')
dev.off()
(myacf <- c(racf$acf))
(mypacf <- c(rpacf$acf))
lengthx <- length(x)
sqrtn <- sqrt(lengthx)
load(file='createtable')
a<-table.start()
a<-table.row.start(a)
a<-table.element(a,'Autocorrelation Function',4,TRUE)
a<-table.row.end(a)
a<-table.row.start(a)
a<-table.element(a,'Time lag k',header=TRUE)
a<-table.element(a,hyperlink('basics.htm','ACF(k)','click here for more information about the Autocorrelation Function'),header=TRUE)
a<-table.element(a,'T-STAT',header=TRUE)
a<-table.element(a,'P-value',header=TRUE)
a<-table.row.end(a)
for (i in 2:(par1+1)) {
a<-table.row.start(a)
a<-table.element(a,i-1,header=TRUE)
a<-table.element(a,round(myacf[i],6))
mytstat <- myacf[i]*sqrtn
a<-table.element(a,round(mytstat,4))
a<-table.element(a,round(1-pt(abs(mytstat),lengthx),6))
a<-table.row.end(a)
}
a<-table.end(a)
table.save(a,file='mytable.tab')
a<-table.start()
a<-table.row.start(a)
a<-table.element(a,'Partial Autocorrelation Function',4,TRUE)
a<-table.row.end(a)
a<-table.row.start(a)
a<-table.element(a,'Time lag k',header=TRUE)
a<-table.element(a,hyperlink('basics.htm','PACF(k)','click here for more information about the Partial Autocorrelation Function'),header=TRUE)
a<-table.element(a,'T-STAT',header=TRUE)
a<-table.element(a,'P-value',header=TRUE)
a<-table.row.end(a)
for (i in 1:par1) {
a<-table.row.start(a)
a<-table.element(a,i,header=TRUE)
a<-table.element(a,round(mypacf[i],6))
mytstat <- mypacf[i]*sqrtn
a<-table.element(a,round(mytstat,4))
a<-table.element(a,round(1-pt(abs(mytstat),lengthx),6))
a<-table.row.end(a)
}
a<-table.end(a)
table.save(a,file='mytable1.tab')