Free Statistics

of Irreproducible Research!

Author's title

Author*The author of this computation has been verified*
R Software Modulerwasp_autocorrelation.wasp
Title produced by software(Partial) Autocorrelation Function
Date of computationWed, 17 Dec 2008 12:49:08 -0700
Cite this page as followsStatistical Computations at FreeStatistics.org, Office for Research Development and Education, URL https://freestatistics.org/blog/index.php?v=date/2008/Dec/17/t1229543391h0qwahtqcvpcxt1.htm/, Retrieved Mon, 27 May 2024 04:03:47 +0000
Statistical Computations at FreeStatistics.org, Office for Research Development and Education, URL https://freestatistics.org/blog/index.php?pk=34525, Retrieved Mon, 27 May 2024 04:03:47 +0000
QR Codes:

Original text written by user:
IsPrivate?No (this computation is public)
User-defined keywords
Estimated Impact145
Family? (F = Feedback message, R = changed R code, M = changed R Module, P = changed Parameters, D = changed Data)
-       [(Partial) Autocorrelation Function] [Paper ACF compone...] [2008-12-17 19:49:08] [0da3c04827d8ef68db874351a2e09488] [Current]
-   P     [(Partial) Autocorrelation Function] [Paper Stap 3 ACF] [2008-12-17 19:51:37] [f9b9e85820b2a54b20380c3265aca831]
-   P       [(Partial) Autocorrelation Function] [Paper ACF model m...] [2008-12-17 19:57:12] [f9b9e85820b2a54b20380c3265aca831]
Feedback Forum

Post a new message
Dataseries X:
94.7
101.8
102.5
105.3
110.3
109.8
117.3
118.8
131.3
125.9
133.1
147
145.8
164.4
149.8
137.7
151.7
156.8
180
180.4
170.4
191.6
199.5
218.2
217.5
205
194
199.3
219.3
211.1
215.2
240.2
242.2
240.7
255.4
253
218.2
203.7
205.6
215.6
188.5
202.9
214
230.3
230
241
259.6
247.8
270.3
289.7
322.7
315
320.2
329.5
360.6
382.2
435.4
464
468.8
403
351.6


Summary of computational transaction
Raw Inputview raw input (R code)
Raw Outputview raw output of R engine
Computing time1 seconds
R Server'George Udny Yule' @ 72.249.76.132

\begin{tabular}{lllllllll}
\hline
Summary of computational transaction \tabularnewline
Raw Input & view raw input (R code)  \tabularnewline
Raw Output & view raw output of R engine  \tabularnewline
Computing time & 1 seconds \tabularnewline
R Server & 'George Udny Yule' @ 72.249.76.132 \tabularnewline
\hline
\end{tabular}
%Source: https://freestatistics.org/blog/index.php?pk=34525&T=0

[TABLE]
[ROW][C]Summary of computational transaction[/C][/ROW]
[ROW][C]Raw Input[/C][C]view raw input (R code) [/C][/ROW]
[ROW][C]Raw Output[/C][C]view raw output of R engine [/C][/ROW]
[ROW][C]Computing time[/C][C]1 seconds[/C][/ROW]
[ROW][C]R Server[/C][C]'George Udny Yule' @ 72.249.76.132[/C][/ROW]
[/TABLE]
Source: https://freestatistics.org/blog/index.php?pk=34525&T=0

Globally Unique Identifier (entire table): ba.freestatistics.org/blog/index.php?pk=34525&T=0

As an alternative you can also use a QR Code:  

The GUIDs for individual cells are displayed in the table below:

Summary of computational transaction
Raw Inputview raw input (R code)
Raw Outputview raw output of R engine
Computing time1 seconds
R Server'George Udny Yule' @ 72.249.76.132


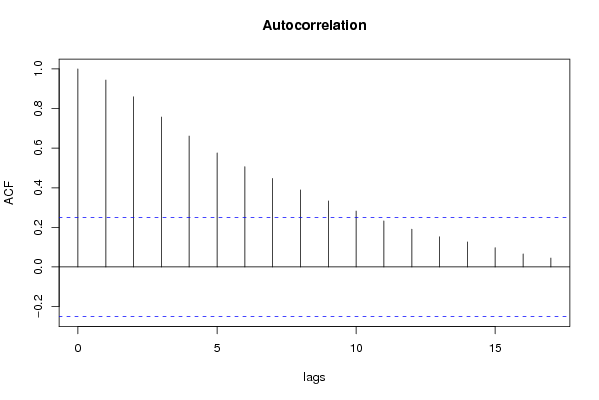
Autocorrelation Function
Time lag kACF(k)T-STATP-value
10.9435987.36970
20.85966.71370
30.7568965.91150
40.6611955.16411e-06
50.5758174.49731.6e-05
60.5066383.9571e-04
70.446873.49020.000451
80.3891883.03970.001743
90.3333892.60390.00578
100.282482.20620.015571
110.2324191.81530.037201
120.1905271.48810.070943
130.1523121.18960.119408
140.126340.98670.163832
150.0973490.76030.224995
160.0659160.51480.30427
170.0448290.35010.363726

\begin{tabular}{lllllllll}
\hline
Autocorrelation Function \tabularnewline
Time lag k & ACF(k) & T-STAT & P-value \tabularnewline
1 & 0.943598 & 7.3697 & 0 \tabularnewline
2 & 0.8596 & 6.7137 & 0 \tabularnewline
3 & 0.756896 & 5.9115 & 0 \tabularnewline
4 & 0.661195 & 5.1641 & 1e-06 \tabularnewline
5 & 0.575817 & 4.4973 & 1.6e-05 \tabularnewline
6 & 0.506638 & 3.957 & 1e-04 \tabularnewline
7 & 0.44687 & 3.4902 & 0.000451 \tabularnewline
8 & 0.389188 & 3.0397 & 0.001743 \tabularnewline
9 & 0.333389 & 2.6039 & 0.00578 \tabularnewline
10 & 0.28248 & 2.2062 & 0.015571 \tabularnewline
11 & 0.232419 & 1.8153 & 0.037201 \tabularnewline
12 & 0.190527 & 1.4881 & 0.070943 \tabularnewline
13 & 0.152312 & 1.1896 & 0.119408 \tabularnewline
14 & 0.12634 & 0.9867 & 0.163832 \tabularnewline
15 & 0.097349 & 0.7603 & 0.224995 \tabularnewline
16 & 0.065916 & 0.5148 & 0.30427 \tabularnewline
17 & 0.044829 & 0.3501 & 0.363726 \tabularnewline
\hline
\end{tabular}
%Source: https://freestatistics.org/blog/index.php?pk=34525&T=1

[TABLE]
[ROW][C]Autocorrelation Function[/C][/ROW]
[ROW][C]Time lag k[/C][C]ACF(k)[/C][C]T-STAT[/C][C]P-value[/C][/ROW]
[ROW][C]1[/C][C]0.943598[/C][C]7.3697[/C][C]0[/C][/ROW]
[ROW][C]2[/C][C]0.8596[/C][C]6.7137[/C][C]0[/C][/ROW]
[ROW][C]3[/C][C]0.756896[/C][C]5.9115[/C][C]0[/C][/ROW]
[ROW][C]4[/C][C]0.661195[/C][C]5.1641[/C][C]1e-06[/C][/ROW]
[ROW][C]5[/C][C]0.575817[/C][C]4.4973[/C][C]1.6e-05[/C][/ROW]
[ROW][C]6[/C][C]0.506638[/C][C]3.957[/C][C]1e-04[/C][/ROW]
[ROW][C]7[/C][C]0.44687[/C][C]3.4902[/C][C]0.000451[/C][/ROW]
[ROW][C]8[/C][C]0.389188[/C][C]3.0397[/C][C]0.001743[/C][/ROW]
[ROW][C]9[/C][C]0.333389[/C][C]2.6039[/C][C]0.00578[/C][/ROW]
[ROW][C]10[/C][C]0.28248[/C][C]2.2062[/C][C]0.015571[/C][/ROW]
[ROW][C]11[/C][C]0.232419[/C][C]1.8153[/C][C]0.037201[/C][/ROW]
[ROW][C]12[/C][C]0.190527[/C][C]1.4881[/C][C]0.070943[/C][/ROW]
[ROW][C]13[/C][C]0.152312[/C][C]1.1896[/C][C]0.119408[/C][/ROW]
[ROW][C]14[/C][C]0.12634[/C][C]0.9867[/C][C]0.163832[/C][/ROW]
[ROW][C]15[/C][C]0.097349[/C][C]0.7603[/C][C]0.224995[/C][/ROW]
[ROW][C]16[/C][C]0.065916[/C][C]0.5148[/C][C]0.30427[/C][/ROW]
[ROW][C]17[/C][C]0.044829[/C][C]0.3501[/C][C]0.363726[/C][/ROW]
[/TABLE]
Source: https://freestatistics.org/blog/index.php?pk=34525&T=1

Globally Unique Identifier (entire table): ba.freestatistics.org/blog/index.php?pk=34525&T=1

As an alternative you can also use a QR Code:  

The GUIDs for individual cells are displayed in the table below:

Autocorrelation Function
Time lag kACF(k)T-STATP-value
10.9435987.36970
20.85966.71370
30.7568965.91150
40.6611955.16411e-06
50.5758174.49731.6e-05
60.5066383.9571e-04
70.446873.49020.000451
80.3891883.03970.001743
90.3333892.60390.00578
100.282482.20620.015571
110.2324191.81530.037201
120.1905271.48810.070943
130.1523121.18960.119408
140.126340.98670.163832
150.0973490.76030.224995
160.0659160.51480.30427
170.0448290.35010.363726


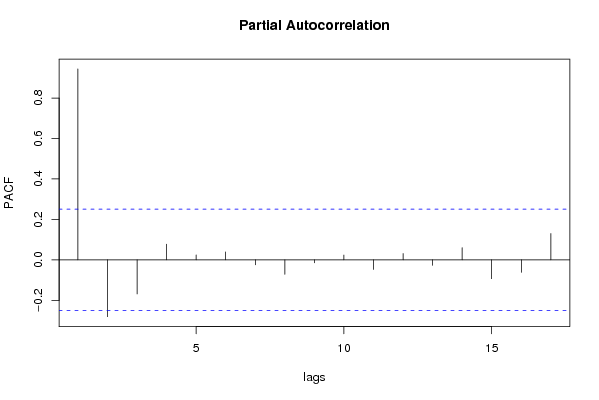
Partial Autocorrelation Function
Time lag kPACF(k)T-STATP-value
10.9435987.36970
2-0.280755-2.19280.016074
3-0.168606-1.31690.096406
40.0772610.60340.274231
50.0241690.18880.425451
60.0392720.30670.380048
7-0.024283-0.18970.425104
8-0.07147-0.55820.289376
9-0.014792-0.11550.454202
100.023640.18460.427065
11-0.047435-0.37050.356155
120.03140.24520.403547
13-0.026766-0.2090.417553
140.0600960.46940.320241
15-0.093407-0.72950.234235
16-0.061377-0.47940.316695
170.1300051.01540.15697

\begin{tabular}{lllllllll}
\hline
Partial Autocorrelation Function \tabularnewline
Time lag k & PACF(k) & T-STAT & P-value \tabularnewline
1 & 0.943598 & 7.3697 & 0 \tabularnewline
2 & -0.280755 & -2.1928 & 0.016074 \tabularnewline
3 & -0.168606 & -1.3169 & 0.096406 \tabularnewline
4 & 0.077261 & 0.6034 & 0.274231 \tabularnewline
5 & 0.024169 & 0.1888 & 0.425451 \tabularnewline
6 & 0.039272 & 0.3067 & 0.380048 \tabularnewline
7 & -0.024283 & -0.1897 & 0.425104 \tabularnewline
8 & -0.07147 & -0.5582 & 0.289376 \tabularnewline
9 & -0.014792 & -0.1155 & 0.454202 \tabularnewline
10 & 0.02364 & 0.1846 & 0.427065 \tabularnewline
11 & -0.047435 & -0.3705 & 0.356155 \tabularnewline
12 & 0.0314 & 0.2452 & 0.403547 \tabularnewline
13 & -0.026766 & -0.209 & 0.417553 \tabularnewline
14 & 0.060096 & 0.4694 & 0.320241 \tabularnewline
15 & -0.093407 & -0.7295 & 0.234235 \tabularnewline
16 & -0.061377 & -0.4794 & 0.316695 \tabularnewline
17 & 0.130005 & 1.0154 & 0.15697 \tabularnewline
\hline
\end{tabular}
%Source: https://freestatistics.org/blog/index.php?pk=34525&T=2

[TABLE]
[ROW][C]Partial Autocorrelation Function[/C][/ROW]
[ROW][C]Time lag k[/C][C]PACF(k)[/C][C]T-STAT[/C][C]P-value[/C][/ROW]
[ROW][C]1[/C][C]0.943598[/C][C]7.3697[/C][C]0[/C][/ROW]
[ROW][C]2[/C][C]-0.280755[/C][C]-2.1928[/C][C]0.016074[/C][/ROW]
[ROW][C]3[/C][C]-0.168606[/C][C]-1.3169[/C][C]0.096406[/C][/ROW]
[ROW][C]4[/C][C]0.077261[/C][C]0.6034[/C][C]0.274231[/C][/ROW]
[ROW][C]5[/C][C]0.024169[/C][C]0.1888[/C][C]0.425451[/C][/ROW]
[ROW][C]6[/C][C]0.039272[/C][C]0.3067[/C][C]0.380048[/C][/ROW]
[ROW][C]7[/C][C]-0.024283[/C][C]-0.1897[/C][C]0.425104[/C][/ROW]
[ROW][C]8[/C][C]-0.07147[/C][C]-0.5582[/C][C]0.289376[/C][/ROW]
[ROW][C]9[/C][C]-0.014792[/C][C]-0.1155[/C][C]0.454202[/C][/ROW]
[ROW][C]10[/C][C]0.02364[/C][C]0.1846[/C][C]0.427065[/C][/ROW]
[ROW][C]11[/C][C]-0.047435[/C][C]-0.3705[/C][C]0.356155[/C][/ROW]
[ROW][C]12[/C][C]0.0314[/C][C]0.2452[/C][C]0.403547[/C][/ROW]
[ROW][C]13[/C][C]-0.026766[/C][C]-0.209[/C][C]0.417553[/C][/ROW]
[ROW][C]14[/C][C]0.060096[/C][C]0.4694[/C][C]0.320241[/C][/ROW]
[ROW][C]15[/C][C]-0.093407[/C][C]-0.7295[/C][C]0.234235[/C][/ROW]
[ROW][C]16[/C][C]-0.061377[/C][C]-0.4794[/C][C]0.316695[/C][/ROW]
[ROW][C]17[/C][C]0.130005[/C][C]1.0154[/C][C]0.15697[/C][/ROW]
[/TABLE]
Source: https://freestatistics.org/blog/index.php?pk=34525&T=2

Globally Unique Identifier (entire table): ba.freestatistics.org/blog/index.php?pk=34525&T=2

As an alternative you can also use a QR Code:  

The GUIDs for individual cells are displayed in the table below:

Partial Autocorrelation Function
Time lag kPACF(k)T-STATP-value
10.9435987.36970
2-0.280755-2.19280.016074
3-0.168606-1.31690.096406
40.0772610.60340.274231
50.0241690.18880.425451
60.0392720.30670.380048
7-0.024283-0.18970.425104
8-0.07147-0.55820.289376
9-0.014792-0.11550.454202
100.023640.18460.427065
11-0.047435-0.37050.356155
120.03140.24520.403547
13-0.026766-0.2090.417553
140.0600960.46940.320241
15-0.093407-0.72950.234235
16-0.061377-0.47940.316695
170.1300051.01540.15697


Parameters (Session):
par1 = Default ; par2 = 1 ; par3 = 0 ; par4 = 0 ; par5 = 12 ;
Parameters (R input):
par1 = Default ; par2 = 1 ; par3 = 0 ; par4 = 0 ; par5 = 12 ;
R code (references can be found in the software module):
if (par1 == 'Default') {
par1 = 10*log10(length(x))
} else {
par1 <- as.numeric(par1)
}
par2 <- as.numeric(par2)
par3 <- as.numeric(par3)
par4 <- as.numeric(par4)
par5 <- as.numeric(par5)
if (par2 == 0) {
x <- log(x)
} else {
x <- (x ^ par2 - 1) / par2
}
if (par3 > 0) x <- diff(x,lag=1,difference=par3)
if (par4 > 0) x <- diff(x,lag=par5,difference=par4)
bitmap(file='pic1.png')
racf <- acf(x,par1,main='Autocorrelation',xlab='lags',ylab='ACF')
dev.off()
bitmap(file='pic2.png')
rpacf <- pacf(x,par1,main='Partial Autocorrelation',xlab='lags',ylab='PACF')
dev.off()
(myacf <- c(racf$acf))
(mypacf <- c(rpacf$acf))
lengthx <- length(x)
sqrtn <- sqrt(lengthx)
load(file='createtable')
a<-table.start()
a<-table.row.start(a)
a<-table.element(a,'Autocorrelation Function',4,TRUE)
a<-table.row.end(a)
a<-table.row.start(a)
a<-table.element(a,'Time lag k',header=TRUE)
a<-table.element(a,hyperlink('basics.htm','ACF(k)','click here for more information about the Autocorrelation Function'),header=TRUE)
a<-table.element(a,'T-STAT',header=TRUE)
a<-table.element(a,'P-value',header=TRUE)
a<-table.row.end(a)
for (i in 2:(par1+1)) {
a<-table.row.start(a)
a<-table.element(a,i-1,header=TRUE)
a<-table.element(a,round(myacf[i],6))
mytstat <- myacf[i]*sqrtn
a<-table.element(a,round(mytstat,4))
a<-table.element(a,round(1-pt(abs(mytstat),lengthx),6))
a<-table.row.end(a)
}
a<-table.end(a)
table.save(a,file='mytable.tab')
a<-table.start()
a<-table.row.start(a)
a<-table.element(a,'Partial Autocorrelation Function',4,TRUE)
a<-table.row.end(a)
a<-table.row.start(a)
a<-table.element(a,'Time lag k',header=TRUE)
a<-table.element(a,hyperlink('basics.htm','PACF(k)','click here for more information about the Partial Autocorrelation Function'),header=TRUE)
a<-table.element(a,'T-STAT',header=TRUE)
a<-table.element(a,'P-value',header=TRUE)
a<-table.row.end(a)
for (i in 1:par1) {
a<-table.row.start(a)
a<-table.element(a,i,header=TRUE)
a<-table.element(a,round(mypacf[i],6))
mytstat <- mypacf[i]*sqrtn
a<-table.element(a,round(mytstat,4))
a<-table.element(a,round(1-pt(abs(mytstat),lengthx),6))
a<-table.row.end(a)
}
a<-table.end(a)
table.save(a,file='mytable1.tab')