Free Statistics

of Irreproducible Research!

Author's title

Author*The author of this computation has been verified*
R Software Modulerwasp_arimabackwardselection.wasp
Title produced by softwareARIMA Backward Selection
Date of computationWed, 17 Dec 2008 12:36:16 -0700
Cite this page as followsStatistical Computations at FreeStatistics.org, Office for Research Development and Education, URL https://freestatistics.org/blog/index.php?v=date/2008/Dec/17/t12295426644niiv0jdri7be5z.htm/, Retrieved Sun, 19 May 2024 05:59:13 +0000
Statistical Computations at FreeStatistics.org, Office for Research Development and Education, URL https://freestatistics.org/blog/index.php?pk=34516, Retrieved Sun, 19 May 2024 05:59:13 +0000
QR Codes:

Original text written by user:In samenwerking met Kevin Engels, Stéphanie Claes, Katrien Bourdiaudhy
IsPrivate?No (this computation is public)
User-defined keywords
Estimated Impact193
Family? (F = Feedback message, R = changed R code, M = changed R Module, P = changed Parameters, D = changed Data)
F     [Univariate Data Series] [blog 1e tijdreeks...] [2008-10-13 19:23:31] [7173087adebe3e3a714c80ea2417b3eb]
-   PD  [Univariate Data Series] [tijdreeksen opnie...] [2008-10-19 17:18:46] [7173087adebe3e3a714c80ea2417b3eb]
- RMP     [Central Tendency] [tijdreeks 2 centr...] [2008-10-19 17:39:42] [7173087adebe3e3a714c80ea2417b3eb]
- RMP       [(Partial) Autocorrelation Function] [ACF aanvragen hyp...] [2008-12-16 14:51:47] [7d3039e6253bb5fb3b26df1537d500b4]
- RMP         [ARIMA Backward Selection] [Arima backward aa...] [2008-12-16 15:38:56] [7d3039e6253bb5fb3b26df1537d500b4]
- RMP           [(Partial) Autocorrelation Function] [acf hypothecair k...] [2008-12-17 15:13:05] [7173087adebe3e3a714c80ea2417b3eb]
- RMP               [ARIMA Backward Selection] [Arima backward se...] [2008-12-17 19:36:16] [35348cd8592af0baf5f138bd59921307] [Current]
-   P                 [ARIMA Backward Selection] [Arima aanvragen h...] [2008-12-18 11:08:22] [7d3039e6253bb5fb3b26df1537d500b4]
- RMPD                  [Cross Correlation Function] [cross correlation] [2008-12-18 13:15:14] [7173087adebe3e3a714c80ea2417b3eb]
- RMPD                  [Cross Correlation Function] [cross correlation] [2008-12-18 13:27:32] [7173087adebe3e3a714c80ea2417b3eb]
- RMP                   [ARIMA Forecasting] [Arima Forecast hy...] [2008-12-22 12:55:27] [7d3039e6253bb5fb3b26df1537d500b4]
- RMP                   [ARIMA Forecasting] [forecast aantal a...] [2008-12-22 13:06:40] [7173087adebe3e3a714c80ea2417b3eb]
- RMP                   [ARIMA Forecasting] [Arima forecasting...] [2008-12-22 13:16:21] [c993f605b206b366f754f7f8c1fcc291]
Feedback Forum

Post a new message
Dataseries X:
2400
4700
3700
2900
2800
3000
3100
3700
3000
2000
1900
1900
1800
3400
3800
2800
3100
2100
2000
2500
2400
2500
3300
3100
3700
5600
3700
2900
4000
2900
2400
3300
3800
4400
4000
3100
2700
5200
4600
3700
3200
2400
2200
3200
3100
2300
2500
2900
2700
5000
3500
3000
3800
2800
2400
2700
2800
2700
2600
3100


Summary of computational transaction
Raw Inputview raw input (R code)
Raw Outputview raw output of R engine
Computing time3 seconds
R Server'Gwilym Jenkins' @ 72.249.127.135

\begin{tabular}{lllllllll}
\hline
Summary of computational transaction \tabularnewline
Raw Input & view raw input (R code)  \tabularnewline
Raw Output & view raw output of R engine  \tabularnewline
Computing time & 3 seconds \tabularnewline
R Server & 'Gwilym Jenkins' @ 72.249.127.135 \tabularnewline
\hline
\end{tabular}
%Source: https://freestatistics.org/blog/index.php?pk=34516&T=0

[TABLE]
[ROW][C]Summary of computational transaction[/C][/ROW]
[ROW][C]Raw Input[/C][C]view raw input (R code) [/C][/ROW]
[ROW][C]Raw Output[/C][C]view raw output of R engine [/C][/ROW]
[ROW][C]Computing time[/C][C]3 seconds[/C][/ROW]
[ROW][C]R Server[/C][C]'Gwilym Jenkins' @ 72.249.127.135[/C][/ROW]
[/TABLE]
Source: https://freestatistics.org/blog/index.php?pk=34516&T=0

Globally Unique Identifier (entire table): ba.freestatistics.org/blog/index.php?pk=34516&T=0

As an alternative you can also use a QR Code:  

The GUIDs for individual cells are displayed in the table below:

Summary of computational transaction
Raw Inputview raw input (R code)
Raw Outputview raw output of R engine
Computing time3 seconds
R Server'Gwilym Jenkins' @ 72.249.127.135


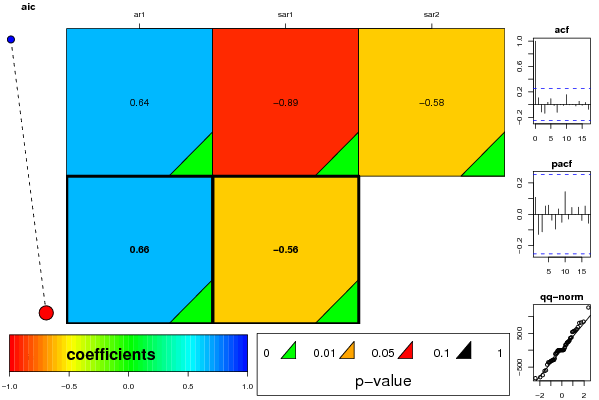
ARIMA Parameter Estimation and Backward Selection
Iterationar1sar1sar2
Estimates ( 1 )0.6421-0.8882-0.5848
(p-val)(0 )(0 )(2e-04 )
Estimates ( 2 )0.664-0.5650
(p-val)(0 )(0 )(NA )
Estimates ( 3 )NANANA
(p-val)(NA )(NA )(NA )
Estimates ( 4 )NANANA
(p-val)(NA )(NA )(NA )
Estimates ( 5 )NANANA
(p-val)(NA )(NA )(NA )

\begin{tabular}{lllllllll}
\hline
ARIMA Parameter Estimation and Backward Selection \tabularnewline
Iteration & ar1 & sar1 & sar2 \tabularnewline
Estimates ( 1 ) & 0.6421 & -0.8882 & -0.5848 \tabularnewline
(p-val) & (0 ) & (0 ) & (2e-04 ) \tabularnewline
Estimates ( 2 ) & 0.664 & -0.565 & 0 \tabularnewline
(p-val) & (0 ) & (0 ) & (NA ) \tabularnewline
Estimates ( 3 ) & NA & NA & NA \tabularnewline
(p-val) & (NA ) & (NA ) & (NA ) \tabularnewline
Estimates ( 4 ) & NA & NA & NA \tabularnewline
(p-val) & (NA ) & (NA ) & (NA ) \tabularnewline
Estimates ( 5 ) & NA & NA & NA \tabularnewline
(p-val) & (NA ) & (NA ) & (NA ) \tabularnewline
\hline
\end{tabular}
%Source: https://freestatistics.org/blog/index.php?pk=34516&T=1

[TABLE]
[ROW][C]ARIMA Parameter Estimation and Backward Selection[/C][/ROW]
[ROW][C]Iteration[/C][C]ar1[/C][C]sar1[/C][C]sar2[/C][/ROW]
[ROW][C]Estimates ( 1 )[/C][C]0.6421[/C][C]-0.8882[/C][C]-0.5848[/C][/ROW]
[ROW][C](p-val)[/C][C](0 )[/C][C](0 )[/C][C](2e-04 )[/C][/ROW]
[ROW][C]Estimates ( 2 )[/C][C]0.664[/C][C]-0.565[/C][C]0[/C][/ROW]
[ROW][C](p-val)[/C][C](0 )[/C][C](0 )[/C][C](NA )[/C][/ROW]
[ROW][C]Estimates ( 3 )[/C][C]NA[/C][C]NA[/C][C]NA[/C][/ROW]
[ROW][C](p-val)[/C][C](NA )[/C][C](NA )[/C][C](NA )[/C][/ROW]
[ROW][C]Estimates ( 4 )[/C][C]NA[/C][C]NA[/C][C]NA[/C][/ROW]
[ROW][C](p-val)[/C][C](NA )[/C][C](NA )[/C][C](NA )[/C][/ROW]
[ROW][C]Estimates ( 5 )[/C][C]NA[/C][C]NA[/C][C]NA[/C][/ROW]
[ROW][C](p-val)[/C][C](NA )[/C][C](NA )[/C][C](NA )[/C][/ROW]
[/TABLE]
Source: https://freestatistics.org/blog/index.php?pk=34516&T=1

Globally Unique Identifier (entire table): ba.freestatistics.org/blog/index.php?pk=34516&T=1

As an alternative you can also use a QR Code:  

The GUIDs for individual cells are displayed in the table below:

ARIMA Parameter Estimation and Backward Selection
Iterationar1sar1sar2
Estimates ( 1 )0.6421-0.8882-0.5848
(p-val)(0 )(0 )(2e-04 )
Estimates ( 2 )0.664-0.5650
(p-val)(0 )(0 )(NA )
Estimates ( 3 )NANANA
(p-val)(NA )(NA )(NA )
Estimates ( 4 )NANANA
(p-val)(NA )(NA )(NA )
Estimates ( 5 )NANANA
(p-val)(NA )(NA )(NA )


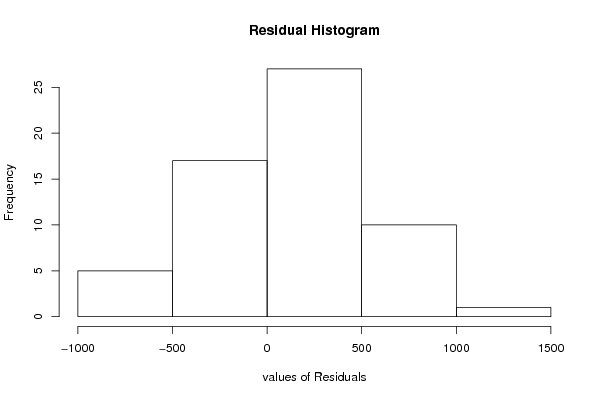
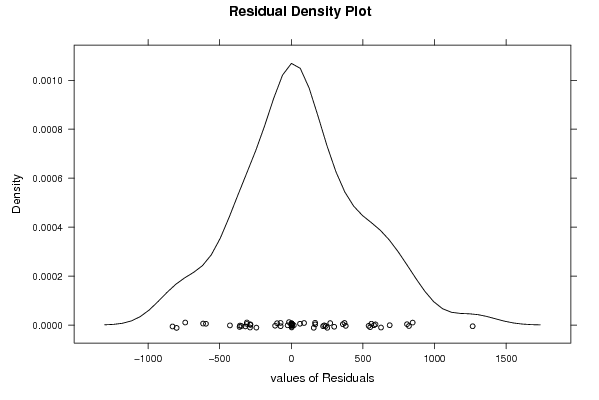
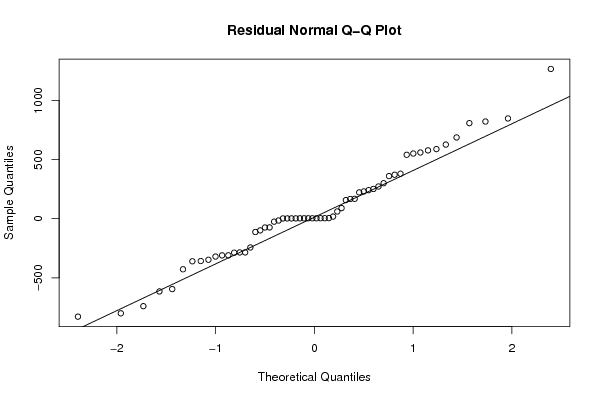
Estimated ARIMA Residuals
Value
1.89999229115757
-309.864113634165
-615.542450674288
626.370381394561
-112.783130649340
240.846625003674
-740.114549070113
-360.610849983851
-347.658021353723
89.2800808950106
559.417930762815
686.830280473148
167.696163451062
807.747789999748
380.11733758798
-800.492167826026
60.9620864711762
847.345822195503
-310.531685012155
-320.471013395675
230.339590046917
821.366704292627
1266.01607918718
166.113026111646
-74.7126414729161
-74.1323592445164
577.549994309031
360.027950779316
271.920189874614
-358.352448427222
-428.053005042587
-285.263780789298
222.116080129385
251.142655705348
-243.685824100836
17.5729481594792
540.011840453492
-99.1993697694502
588.167971926338
-828.734285422771
299.618434796813
371.489510729088
156.786490585328
-15.8109986341860
-285.521154027949
-25.2938806488210
-287.876563834997
-595.584561919956
550.737531023477

\begin{tabular}{lllllllll}
\hline
Estimated ARIMA Residuals \tabularnewline
Value \tabularnewline
1.89999229115757 \tabularnewline
-309.864113634165 \tabularnewline
-615.542450674288 \tabularnewline
626.370381394561 \tabularnewline
-112.783130649340 \tabularnewline
240.846625003674 \tabularnewline
-740.114549070113 \tabularnewline
-360.610849983851 \tabularnewline
-347.658021353723 \tabularnewline
89.2800808950106 \tabularnewline
559.417930762815 \tabularnewline
686.830280473148 \tabularnewline
167.696163451062 \tabularnewline
807.747789999748 \tabularnewline
380.11733758798 \tabularnewline
-800.492167826026 \tabularnewline
60.9620864711762 \tabularnewline
847.345822195503 \tabularnewline
-310.531685012155 \tabularnewline
-320.471013395675 \tabularnewline
230.339590046917 \tabularnewline
821.366704292627 \tabularnewline
1266.01607918718 \tabularnewline
166.113026111646 \tabularnewline
-74.7126414729161 \tabularnewline
-74.1323592445164 \tabularnewline
577.549994309031 \tabularnewline
360.027950779316 \tabularnewline
271.920189874614 \tabularnewline
-358.352448427222 \tabularnewline
-428.053005042587 \tabularnewline
-285.263780789298 \tabularnewline
222.116080129385 \tabularnewline
251.142655705348 \tabularnewline
-243.685824100836 \tabularnewline
17.5729481594792 \tabularnewline
540.011840453492 \tabularnewline
-99.1993697694502 \tabularnewline
588.167971926338 \tabularnewline
-828.734285422771 \tabularnewline
299.618434796813 \tabularnewline
371.489510729088 \tabularnewline
156.786490585328 \tabularnewline
-15.8109986341860 \tabularnewline
-285.521154027949 \tabularnewline
-25.2938806488210 \tabularnewline
-287.876563834997 \tabularnewline
-595.584561919956 \tabularnewline
550.737531023477 \tabularnewline
\hline
\end{tabular}
%Source: https://freestatistics.org/blog/index.php?pk=34516&T=2

[TABLE]
[ROW][C]Estimated ARIMA Residuals[/C][/ROW]
[ROW][C]Value[/C][/ROW]
[ROW][C]1.89999229115757[/C][/ROW]
[ROW][C]-309.864113634165[/C][/ROW]
[ROW][C]-615.542450674288[/C][/ROW]
[ROW][C]626.370381394561[/C][/ROW]
[ROW][C]-112.783130649340[/C][/ROW]
[ROW][C]240.846625003674[/C][/ROW]
[ROW][C]-740.114549070113[/C][/ROW]
[ROW][C]-360.610849983851[/C][/ROW]
[ROW][C]-347.658021353723[/C][/ROW]
[ROW][C]89.2800808950106[/C][/ROW]
[ROW][C]559.417930762815[/C][/ROW]
[ROW][C]686.830280473148[/C][/ROW]
[ROW][C]167.696163451062[/C][/ROW]
[ROW][C]807.747789999748[/C][/ROW]
[ROW][C]380.11733758798[/C][/ROW]
[ROW][C]-800.492167826026[/C][/ROW]
[ROW][C]60.9620864711762[/C][/ROW]
[ROW][C]847.345822195503[/C][/ROW]
[ROW][C]-310.531685012155[/C][/ROW]
[ROW][C]-320.471013395675[/C][/ROW]
[ROW][C]230.339590046917[/C][/ROW]
[ROW][C]821.366704292627[/C][/ROW]
[ROW][C]1266.01607918718[/C][/ROW]
[ROW][C]166.113026111646[/C][/ROW]
[ROW][C]-74.7126414729161[/C][/ROW]
[ROW][C]-74.1323592445164[/C][/ROW]
[ROW][C]577.549994309031[/C][/ROW]
[ROW][C]360.027950779316[/C][/ROW]
[ROW][C]271.920189874614[/C][/ROW]
[ROW][C]-358.352448427222[/C][/ROW]
[ROW][C]-428.053005042587[/C][/ROW]
[ROW][C]-285.263780789298[/C][/ROW]
[ROW][C]222.116080129385[/C][/ROW]
[ROW][C]251.142655705348[/C][/ROW]
[ROW][C]-243.685824100836[/C][/ROW]
[ROW][C]17.5729481594792[/C][/ROW]
[ROW][C]540.011840453492[/C][/ROW]
[ROW][C]-99.1993697694502[/C][/ROW]
[ROW][C]588.167971926338[/C][/ROW]
[ROW][C]-828.734285422771[/C][/ROW]
[ROW][C]299.618434796813[/C][/ROW]
[ROW][C]371.489510729088[/C][/ROW]
[ROW][C]156.786490585328[/C][/ROW]
[ROW][C]-15.8109986341860[/C][/ROW]
[ROW][C]-285.521154027949[/C][/ROW]
[ROW][C]-25.2938806488210[/C][/ROW]
[ROW][C]-287.876563834997[/C][/ROW]
[ROW][C]-595.584561919956[/C][/ROW]
[ROW][C]550.737531023477[/C][/ROW]
[/TABLE]
Source: https://freestatistics.org/blog/index.php?pk=34516&T=2

Globally Unique Identifier (entire table): ba.freestatistics.org/blog/index.php?pk=34516&T=2

As an alternative you can also use a QR Code:  

The GUIDs for individual cells are displayed in the table below:

Estimated ARIMA Residuals
Value
1.89999229115757
-309.864113634165
-615.542450674288
626.370381394561
-112.783130649340
240.846625003674
-740.114549070113
-360.610849983851
-347.658021353723
89.2800808950106
559.417930762815
686.830280473148
167.696163451062
807.747789999748
380.11733758798
-800.492167826026
60.9620864711762
847.345822195503
-310.531685012155
-320.471013395675
230.339590046917
821.366704292627
1266.01607918718
166.113026111646
-74.7126414729161
-74.1323592445164
577.549994309031
360.027950779316
271.920189874614
-358.352448427222
-428.053005042587
-285.263780789298
222.116080129385
251.142655705348
-243.685824100836
17.5729481594792
540.011840453492
-99.1993697694502
588.167971926338
-828.734285422771
299.618434796813
371.489510729088
156.786490585328
-15.8109986341860
-285.521154027949
-25.2938806488210
-287.876563834997
-595.584561919956
550.737531023477


Parameters (Session):
par1 = FALSE ; par2 = 1 ; par3 = 0 ; par4 = 1 ; par5 = 12 ; par6 = 1 ; par7 = 0 ; par8 = 2 ; par9 = 0 ;
Parameters (R input):
par1 = FALSE ; par2 = 1 ; par3 = 0 ; par4 = 1 ; par5 = 12 ; par6 = 1 ; par7 = 0 ; par8 = 2 ; par9 = 0 ;
R code (references can be found in the software module):
library(lattice)
if (par1 == 'TRUE') par1 <- TRUE
if (par1 == 'FALSE') par1 <- FALSE
par2 <- as.numeric(par2) #Box-Cox lambda transformation parameter
par3 <- as.numeric(par3) #degree of non-seasonal differencing
par4 <- as.numeric(par4) #degree of seasonal differencing
par5 <- as.numeric(par5) #seasonal period
par6 <- as.numeric(par6) #degree (p) of the non-seasonal AR(p) polynomial
par7 <- as.numeric(par7) #degree (q) of the non-seasonal MA(q) polynomial
par8 <- as.numeric(par8) #degree (P) of the seasonal AR(P) polynomial
par9 <- as.numeric(par9) #degree (Q) of the seasonal MA(Q) polynomial
armaGR <- function(arima.out, names, n){
try1 <- arima.out$coef
try2 <- sqrt(diag(arima.out$var.coef))
try.data.frame <- data.frame(matrix(NA,ncol=4,nrow=length(names)))
dimnames(try.data.frame) <- list(names,c('coef','std','tstat','pv'))
try.data.frame[,1] <- try1
for(i in 1:length(try2)) try.data.frame[which(rownames(try.data.frame)==names(try2)[i]),2] <- try2[i]
try.data.frame[,3] <- try.data.frame[,1] / try.data.frame[,2]
try.data.frame[,4] <- round((1-pt(abs(try.data.frame[,3]),df=n-(length(try2)+1)))*2,5)
vector <- rep(NA,length(names))
vector[is.na(try.data.frame[,4])] <- 0
maxi <- which.max(try.data.frame[,4])
continue <- max(try.data.frame[,4],na.rm=TRUE) > .05
vector[maxi] <- 0
list(summary=try.data.frame,next.vector=vector,continue=continue)
}
arimaSelect <- function(series, order=c(13,0,0), seasonal=list(order=c(2,0,0),period=12), include.mean=F){
nrc <- order[1]+order[3]+seasonal$order[1]+seasonal$order[3]
coeff <- matrix(NA, nrow=nrc*2, ncol=nrc)
pval <- matrix(NA, nrow=nrc*2, ncol=nrc)
mylist <- rep(list(NULL), nrc)
names <- NULL
if(order[1] > 0) names <- paste('ar',1:order[1],sep='')
if(order[3] > 0) names <- c( names , paste('ma',1:order[3],sep='') )
if(seasonal$order[1] > 0) names <- c(names, paste('sar',1:seasonal$order[1],sep=''))
if(seasonal$order[3] > 0) names <- c(names, paste('sma',1:seasonal$order[3],sep=''))
arima.out <- arima(series, order=order, seasonal=seasonal, include.mean=include.mean, method='ML')
mylist[[1]] <- arima.out
last.arma <- armaGR(arima.out, names, length(series))
mystop <- FALSE
i <- 1
coeff[i,] <- last.arma[[1]][,1]
pval [i,] <- last.arma[[1]][,4]
i <- 2
aic <- arima.out$aic
while(!mystop){
mylist[[i]] <- arima.out
arima.out <- arima(series, order=order, seasonal=seasonal, include.mean=include.mean, method='ML', fixed=last.arma$next.vector)
aic <- c(aic, arima.out$aic)
last.arma <- armaGR(arima.out, names, length(series))
mystop <- !last.arma$continue
coeff[i,] <- last.arma[[1]][,1]
pval [i,] <- last.arma[[1]][,4]
i <- i+1
}
list(coeff, pval, mylist, aic=aic)
}
arimaSelectplot <- function(arimaSelect.out,noms,choix){
noms <- names(arimaSelect.out[[3]][[1]]$coef)
coeff <- arimaSelect.out[[1]]
k <- min(which(is.na(coeff[,1])))-1
coeff <- coeff[1:k,]
pval <- arimaSelect.out[[2]][1:k,]
aic <- arimaSelect.out$aic[1:k]
coeff[coeff==0] <- NA
n <- ncol(coeff)
if(missing(choix)) choix <- k
layout(matrix(c(1,1,1,2,
3,3,3,2,
3,3,3,4,
5,6,7,7),nr=4),
widths=c(10,35,45,15),
heights=c(30,30,15,15))
couleurs <- rainbow(75)[1:50]#(50)
ticks <- pretty(coeff)
par(mar=c(1,1,3,1))
plot(aic,k:1-.5,type='o',pch=21,bg='blue',cex=2,axes=F,lty=2,xpd=NA)
points(aic[choix],k-choix+.5,pch=21,cex=4,bg=2,xpd=NA)
title('aic',line=2)
par(mar=c(3,0,0,0))
plot(0,axes=F,xlab='',ylab='',xlim=range(ticks),ylim=c(.1,1))
rect(xleft = min(ticks) + (0:49)/50*(max(ticks)-min(ticks)),
xright = min(ticks) + (1:50)/50*(max(ticks)-min(ticks)),
ytop = rep(1,50),
ybottom= rep(0,50),col=couleurs,border=NA)
axis(1,ticks)
rect(xleft=min(ticks),xright=max(ticks),ytop=1,ybottom=0)
text(mean(coeff,na.rm=T),.5,'coefficients',cex=2,font=2)
par(mar=c(1,1,3,1))
image(1:n,1:k,t(coeff[k:1,]),axes=F,col=couleurs,zlim=range(ticks))
for(i in 1:n) for(j in 1:k) if(!is.na(coeff[j,i])) {
if(pval[j,i]<.01) symb = 'green'
else if( (pval[j,i]<.05) & (pval[j,i]>=.01)) symb = 'orange'
else if( (pval[j,i]<.1) & (pval[j,i]>=.05)) symb = 'red'
else symb = 'black'
polygon(c(i+.5 ,i+.2 ,i+.5 ,i+.5),
c(k-j+0.5,k-j+0.5,k-j+0.8,k-j+0.5),
col=symb)
if(j==choix) {
rect(xleft=i-.5,
xright=i+.5,
ybottom=k-j+1.5,
ytop=k-j+.5,
lwd=4)
text(i,
k-j+1,
round(coeff[j,i],2),
cex=1.2,
font=2)
}
else{
rect(xleft=i-.5,xright=i+.5,ybottom=k-j+1.5,ytop=k-j+.5)
text(i,k-j+1,round(coeff[j,i],2),cex=1.2,font=1)
}
}
axis(3,1:n,noms)
par(mar=c(0.5,0,0,0.5))
plot(0,axes=F,xlab='',ylab='',type='n',xlim=c(0,8),ylim=c(-.2,.8))
cols <- c('green','orange','red','black')
niv <- c('0','0.01','0.05','0.1')
for(i in 0:3){
polygon(c(1+2*i ,1+2*i ,1+2*i-.5 ,1+2*i),
c(.4 ,.7 , .4 , .4),
col=cols[i+1])
text(2*i,0.5,niv[i+1],cex=1.5)
}
text(8,.5,1,cex=1.5)
text(4,0,'p-value',cex=2)
box()
residus <- arimaSelect.out[[3]][[choix]]$res
par(mar=c(1,2,4,1))
acf(residus,main='')
title('acf',line=.5)
par(mar=c(1,2,4,1))
pacf(residus,main='')
title('pacf',line=.5)
par(mar=c(2,2,4,1))
qqnorm(residus,main='')
title('qq-norm',line=.5)
qqline(residus)
residus
}
if (par2 == 0) x <- log(x)
if (par2 != 0) x <- x^par2
(selection <- arimaSelect(x, order=c(par6,par3,par7), seasonal=list(order=c(par8,par4,par9), period=par5)))
bitmap(file='test1.png')
resid <- arimaSelectplot(selection)
dev.off()
resid
bitmap(file='test2.png')
acf(resid,length(resid)/2, main='Residual Autocorrelation Function')
dev.off()
bitmap(file='test3.png')
pacf(resid,length(resid)/2, main='Residual Partial Autocorrelation Function')
dev.off()
bitmap(file='test4.png')
cpgram(resid, main='Residual Cumulative Periodogram')
dev.off()
bitmap(file='test5.png')
hist(resid, main='Residual Histogram', xlab='values of Residuals')
dev.off()
bitmap(file='test6.png')
densityplot(~resid,col='black',main='Residual Density Plot', xlab='values of Residuals')
dev.off()
bitmap(file='test7.png')
qqnorm(resid, main='Residual Normal Q-Q Plot')
qqline(resid)
dev.off()
ncols <- length(selection[[1]][1,])
nrows <- length(selection[[2]][,1])-1
load(file='createtable')
a<-table.start()
a<-table.row.start(a)
a<-table.element(a,'ARIMA Parameter Estimation and Backward Selection', ncols+1,TRUE)
a<-table.row.end(a)
a<-table.row.start(a)
a<-table.element(a,'Iteration', header=TRUE)
for (i in 1:ncols) {
a<-table.element(a,names(selection[[3]][[1]]$coef)[i],header=TRUE)
}
a<-table.row.end(a)
for (j in 1:nrows) {
a<-table.row.start(a)
mydum <- 'Estimates ('
mydum <- paste(mydum,j)
mydum <- paste(mydum,')')
a<-table.element(a,mydum, header=TRUE)
for (i in 1:ncols) {
a<-table.element(a,round(selection[[1]][j,i],4))
}
a<-table.row.end(a)
a<-table.row.start(a)
a<-table.element(a,'(p-val)', header=TRUE)
for (i in 1:ncols) {
mydum <- '('
mydum <- paste(mydum,round(selection[[2]][j,i],4),sep='')
mydum <- paste(mydum,')')
a<-table.element(a,mydum)
}
a<-table.row.end(a)
}
a<-table.end(a)
table.save(a,file='mytable.tab')
a<-table.start()
a<-table.row.start(a)
a<-table.element(a,'Estimated ARIMA Residuals', 1,TRUE)
a<-table.row.end(a)
a<-table.row.start(a)
a<-table.element(a,'Value', 1,TRUE)
a<-table.row.end(a)
for (i in (par4*par5+par3):length(resid)) {
a<-table.row.start(a)
a<-table.element(a,resid[i])
a<-table.row.end(a)
}
a<-table.end(a)
table.save(a,file='mytable1.tab')