Free Statistics

of Irreproducible Research!

Author's title

Multiple Lineair Regression Totaal niet-werkende werkzoekende vrouwen Vlaam...

Author*The author of this computation has been verified*
R Software Modulerwasp_multipleregression.wasp
Title produced by softwareMultiple Regression
Date of computationWed, 17 Dec 2008 11:20:55 -0700
Cite this page as followsStatistical Computations at FreeStatistics.org, Office for Research Development and Education, URL https://freestatistics.org/blog/index.php?v=date/2008/Dec/17/t1229538229kqoelqw9nxhdzfq.htm/, Retrieved Mon, 27 May 2024 07:57:41 +0000
Statistical Computations at FreeStatistics.org, Office for Research Development and Education, URL https://freestatistics.org/blog/index.php?pk=34473, Retrieved Mon, 27 May 2024 07:57:41 +0000
QR Codes:

Original text written by user:Endogenous time series: 1 Seasonal effects: ja Linear trend: ja
IsPrivate?No (this computation is public)
User-defined keywordsMultiple Lineair Regression Totaal niet-werkende werkzoekende vrouwen Vlaams gewest
Estimated Impact166
Family? (F = Feedback message, R = changed R code, M = changed R Module, P = changed Parameters, D = changed Data)
-     [Multiple Regression] [Multiple Lineair ...] [2008-12-16 21:55:43] [b635de6fc42b001d22cbe6e730fec936]
-   PD    [Multiple Regression] [Multiple Lineair ...] [2008-12-17 18:20:55] [f4b2017b314c03698059f43b95818e67] [Current]
-   P       [Multiple Regression] [Multiple Lineair ...] [2008-12-21 19:07:05] [b635de6fc42b001d22cbe6e730fec936]
Feedback Forum

Post a new message
Dataseries X:
121148	0
114624	0
109822	0
112081	0
113534	0
112110	0
109826	0
107423	0
105540	0
108573	0
128591	0
139145	0
129700	0
132828	0
126868	0
128390	0
126830	0
124105	0
122323	0
119296	0
116822	0
119224	0
139357	0
144322	0
133676	0
128283	0
121640	0
122877	1
117284	1
116463	1
112685	1
113235	1
111692	1
113152	1
129889	1
131153	1
123770	1
112516	1
105940	1
104320	1
103582	1
99064	1
94989	1
92241	1
89752	1
90610	1
109456	1
110213	1
97694	1
91844	1
87572	1
89812	1
89050	1
85990	1
85070	1
83277	1
79586	1
84215	1
99708	1
100698	1
90861	1
86700	1


Summary of computational transaction
Raw Inputview raw input (R code)
Raw Outputview raw output of R engine
Computing time6 seconds
R Server'George Udny Yule' @ 72.249.76.132

\begin{tabular}{lllllllll}
\hline
Summary of computational transaction \tabularnewline
Raw Input & view raw input (R code)  \tabularnewline
Raw Output & view raw output of R engine  \tabularnewline
Computing time & 6 seconds \tabularnewline
R Server & 'George Udny Yule' @ 72.249.76.132 \tabularnewline
\hline
\end{tabular}
%Source: https://freestatistics.org/blog/index.php?pk=34473&T=0

[TABLE]
[ROW][C]Summary of computational transaction[/C][/ROW]
[ROW][C]Raw Input[/C][C]view raw input (R code) [/C][/ROW]
[ROW][C]Raw Output[/C][C]view raw output of R engine [/C][/ROW]
[ROW][C]Computing time[/C][C]6 seconds[/C][/ROW]
[ROW][C]R Server[/C][C]'George Udny Yule' @ 72.249.76.132[/C][/ROW]
[/TABLE]
Source: https://freestatistics.org/blog/index.php?pk=34473&T=0

Globally Unique Identifier (entire table): ba.freestatistics.org/blog/index.php?pk=34473&T=0

As an alternative you can also use a QR Code:  

The GUIDs for individual cells are displayed in the table below:

Summary of computational transaction
Raw Inputview raw input (R code)
Raw Outputview raw output of R engine
Computing time6 seconds
R Server'George Udny Yule' @ 72.249.76.132


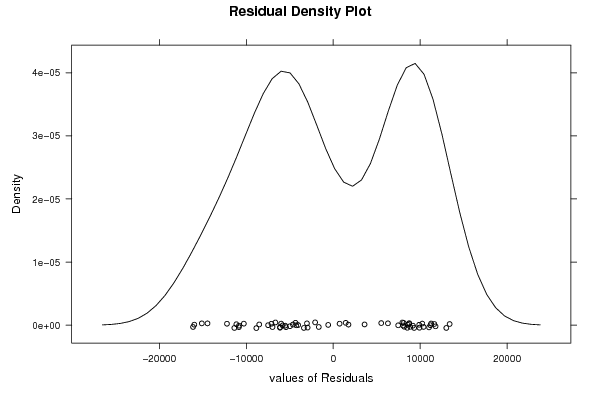
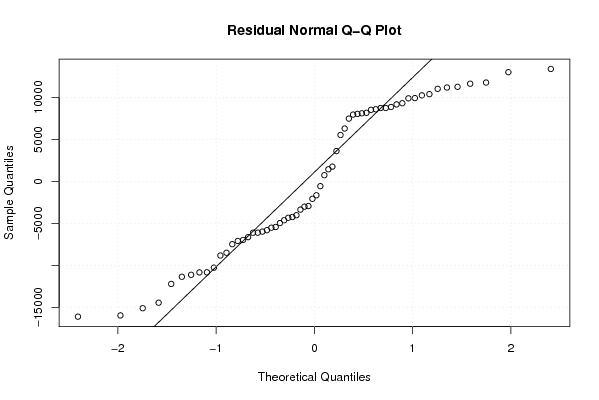
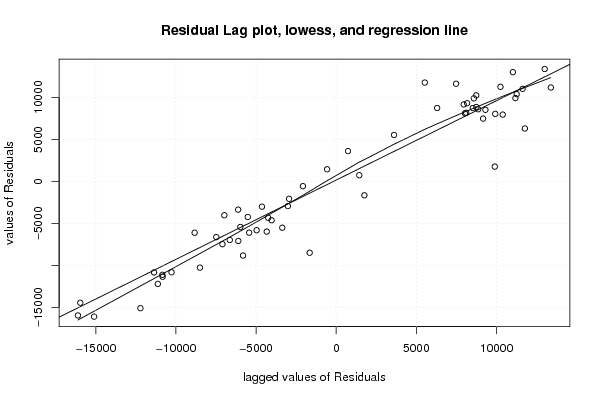
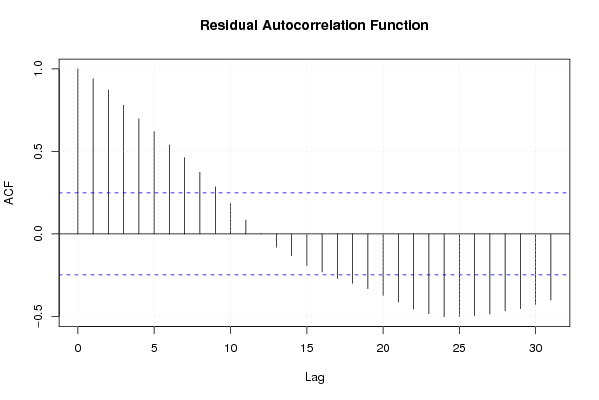
Multiple Linear Regression - Estimated Regression Equation
werkl.vrouwen[t] = + 148463.342857143 -623.464285714327Wetswijziging[t] -12219.1386904762M1[t] -16589.7202380952M2[t] -20608.2589285714M3[t] -18717.5476190476M4[t] -19519.1291666667M5[t] -21390.3107142857M6[t] -23319.6922619048M7[t] -24565.4738095238M8[t] -26343.0553571428M9[t] -23228.2369047619M10[t] -4344.41845238095M11[t] -638.418452380952t + e[t]

\begin{tabular}{lllllllll}
\hline
Multiple Linear Regression - Estimated Regression Equation \tabularnewline
werkl.vrouwen[t] =  +  148463.342857143 -623.464285714327Wetswijziging[t] -12219.1386904762M1[t] -16589.7202380952M2[t] -20608.2589285714M3[t] -18717.5476190476M4[t] -19519.1291666667M5[t] -21390.3107142857M6[t] -23319.6922619048M7[t] -24565.4738095238M8[t] -26343.0553571428M9[t] -23228.2369047619M10[t] -4344.41845238095M11[t] -638.418452380952t  + e[t] \tabularnewline
\hline
\end{tabular}
%Source: https://freestatistics.org/blog/index.php?pk=34473&T=1

[TABLE]
[ROW][C]Multiple Linear Regression - Estimated Regression Equation[/C][/ROW]
[ROW][C]werkl.vrouwen[t] =  +  148463.342857143 -623.464285714327Wetswijziging[t] -12219.1386904762M1[t] -16589.7202380952M2[t] -20608.2589285714M3[t] -18717.5476190476M4[t] -19519.1291666667M5[t] -21390.3107142857M6[t] -23319.6922619048M7[t] -24565.4738095238M8[t] -26343.0553571428M9[t] -23228.2369047619M10[t] -4344.41845238095M11[t] -638.418452380952t  + e[t][/C][/ROW]
[/TABLE]
Source: https://freestatistics.org/blog/index.php?pk=34473&T=1

Globally Unique Identifier (entire table): ba.freestatistics.org/blog/index.php?pk=34473&T=1

As an alternative you can also use a QR Code:  

The GUIDs for individual cells are displayed in the table below:

Multiple Linear Regression - Estimated Regression Equation
werkl.vrouwen[t] = + 148463.342857143 -623.464285714327Wetswijziging[t] -12219.1386904762M1[t] -16589.7202380952M2[t] -20608.2589285714M3[t] -18717.5476190476M4[t] -19519.1291666667M5[t] -21390.3107142857M6[t] -23319.6922619048M7[t] -24565.4738095238M8[t] -26343.0553571428M9[t] -23228.2369047619M10[t] -4344.41845238095M11[t] -638.418452380952t + e[t]


Multiple Linear Regression - Ordinary Least Squares
VariableParameterS.D.T-STATH0: parameter = 02-tail p-value1-tail p-value
(Intercept)148463.3428571435313.85454527.938900
Wetswijziging-623.4642857143275145.117539-0.12120.9040580.452029
M1-12219.13869047626031.221115-2.0260.0483440.024172
M2-16589.72023809526026.545618-2.75280.0083170.004158
M3-20608.25892857146320.681441-3.26040.0020490.001025
M4-18717.54761904766390.550916-2.92890.005190.002595
M5-19519.12916666676366.533547-3.06590.0035580.001779
M6-21390.31071428576345.644965-3.37090.0014870.000744
M7-23319.69226190486327.916153-3.68520.000580.00029
M8-24565.47380952386313.373732-3.8910.0003070.000154
M9-26343.05535714286302.03976-4.18010.0001236.1e-05
M10-23228.23690476196293.931569-3.69060.0005710.000285
M11-4344.418452380956289.061637-0.69080.4930250.246512
t-638.418452380952142.919932-4.4674.8e-052.4e-05

\begin{tabular}{lllllllll}
\hline
Multiple Linear Regression - Ordinary Least Squares \tabularnewline
Variable & Parameter & S.D. & T-STATH0: parameter = 0 & 2-tail p-value & 1-tail p-value \tabularnewline
(Intercept) & 148463.342857143 & 5313.854545 & 27.9389 & 0 & 0 \tabularnewline
Wetswijziging & -623.464285714327 & 5145.117539 & -0.1212 & 0.904058 & 0.452029 \tabularnewline
M1 & -12219.1386904762 & 6031.221115 & -2.026 & 0.048344 & 0.024172 \tabularnewline
M2 & -16589.7202380952 & 6026.545618 & -2.7528 & 0.008317 & 0.004158 \tabularnewline
M3 & -20608.2589285714 & 6320.681441 & -3.2604 & 0.002049 & 0.001025 \tabularnewline
M4 & -18717.5476190476 & 6390.550916 & -2.9289 & 0.00519 & 0.002595 \tabularnewline
M5 & -19519.1291666667 & 6366.533547 & -3.0659 & 0.003558 & 0.001779 \tabularnewline
M6 & -21390.3107142857 & 6345.644965 & -3.3709 & 0.001487 & 0.000744 \tabularnewline
M7 & -23319.6922619048 & 6327.916153 & -3.6852 & 0.00058 & 0.00029 \tabularnewline
M8 & -24565.4738095238 & 6313.373732 & -3.891 & 0.000307 & 0.000154 \tabularnewline
M9 & -26343.0553571428 & 6302.03976 & -4.1801 & 0.000123 & 6.1e-05 \tabularnewline
M10 & -23228.2369047619 & 6293.931569 & -3.6906 & 0.000571 & 0.000285 \tabularnewline
M11 & -4344.41845238095 & 6289.061637 & -0.6908 & 0.493025 & 0.246512 \tabularnewline
t & -638.418452380952 & 142.919932 & -4.467 & 4.8e-05 & 2.4e-05 \tabularnewline
\hline
\end{tabular}
%Source: https://freestatistics.org/blog/index.php?pk=34473&T=2

[TABLE]
[ROW][C]Multiple Linear Regression - Ordinary Least Squares[/C][/ROW]
[ROW][C]Variable[/C][C]Parameter[/C][C]S.D.[/C][C]T-STATH0: parameter = 0[/C][C]2-tail p-value[/C][C]1-tail p-value[/C][/ROW]
[ROW][C](Intercept)[/C][C]148463.342857143[/C][C]5313.854545[/C][C]27.9389[/C][C]0[/C][C]0[/C][/ROW]
[ROW][C]Wetswijziging[/C][C]-623.464285714327[/C][C]5145.117539[/C][C]-0.1212[/C][C]0.904058[/C][C]0.452029[/C][/ROW]
[ROW][C]M1[/C][C]-12219.1386904762[/C][C]6031.221115[/C][C]-2.026[/C][C]0.048344[/C][C]0.024172[/C][/ROW]
[ROW][C]M2[/C][C]-16589.7202380952[/C][C]6026.545618[/C][C]-2.7528[/C][C]0.008317[/C][C]0.004158[/C][/ROW]
[ROW][C]M3[/C][C]-20608.2589285714[/C][C]6320.681441[/C][C]-3.2604[/C][C]0.002049[/C][C]0.001025[/C][/ROW]
[ROW][C]M4[/C][C]-18717.5476190476[/C][C]6390.550916[/C][C]-2.9289[/C][C]0.00519[/C][C]0.002595[/C][/ROW]
[ROW][C]M5[/C][C]-19519.1291666667[/C][C]6366.533547[/C][C]-3.0659[/C][C]0.003558[/C][C]0.001779[/C][/ROW]
[ROW][C]M6[/C][C]-21390.3107142857[/C][C]6345.644965[/C][C]-3.3709[/C][C]0.001487[/C][C]0.000744[/C][/ROW]
[ROW][C]M7[/C][C]-23319.6922619048[/C][C]6327.916153[/C][C]-3.6852[/C][C]0.00058[/C][C]0.00029[/C][/ROW]
[ROW][C]M8[/C][C]-24565.4738095238[/C][C]6313.373732[/C][C]-3.891[/C][C]0.000307[/C][C]0.000154[/C][/ROW]
[ROW][C]M9[/C][C]-26343.0553571428[/C][C]6302.03976[/C][C]-4.1801[/C][C]0.000123[/C][C]6.1e-05[/C][/ROW]
[ROW][C]M10[/C][C]-23228.2369047619[/C][C]6293.931569[/C][C]-3.6906[/C][C]0.000571[/C][C]0.000285[/C][/ROW]
[ROW][C]M11[/C][C]-4344.41845238095[/C][C]6289.061637[/C][C]-0.6908[/C][C]0.493025[/C][C]0.246512[/C][/ROW]
[ROW][C]t[/C][C]-638.418452380952[/C][C]142.919932[/C][C]-4.467[/C][C]4.8e-05[/C][C]2.4e-05[/C][/ROW]
[/TABLE]
Source: https://freestatistics.org/blog/index.php?pk=34473&T=2

Globally Unique Identifier (entire table): ba.freestatistics.org/blog/index.php?pk=34473&T=2

As an alternative you can also use a QR Code:  

The GUIDs for individual cells are displayed in the table below:

Multiple Linear Regression - Ordinary Least Squares
VariableParameterS.D.T-STATH0: parameter = 02-tail p-value1-tail p-value
(Intercept)148463.3428571435313.85454527.938900
Wetswijziging-623.4642857143275145.117539-0.12120.9040580.452029
M1-12219.13869047626031.221115-2.0260.0483440.024172
M2-16589.72023809526026.545618-2.75280.0083170.004158
M3-20608.25892857146320.681441-3.26040.0020490.001025
M4-18717.54761904766390.550916-2.92890.005190.002595
M5-19519.12916666676366.533547-3.06590.0035580.001779
M6-21390.31071428576345.644965-3.37090.0014870.000744
M7-23319.69226190486327.916153-3.68520.000580.00029
M8-24565.47380952386313.373732-3.8910.0003070.000154
M9-26343.05535714286302.03976-4.18010.0001236.1e-05
M10-23228.23690476196293.931569-3.69060.0005710.000285
M11-4344.418452380956289.061637-0.69080.4930250.246512
t-638.418452380952142.919932-4.4674.8e-052.4e-05


Multiple Linear Regression - Regression Statistics
Multiple R0.840156884536671
R-squared0.705863590634366
Adjusted R-squared0.626201646431173
F-TEST (value)8.86073767963696
F-TEST (DF numerator)13
F-TEST (DF denominator)48
p-value7.68001950923747e-09
Multiple Linear Regression - Residual Statistics
Residual Standard Deviation9941.31155470337
Sum Squared Residuals4743824420.52858

\begin{tabular}{lllllllll}
\hline
Multiple Linear Regression - Regression Statistics \tabularnewline
Multiple R & 0.840156884536671 \tabularnewline
R-squared & 0.705863590634366 \tabularnewline
Adjusted R-squared & 0.626201646431173 \tabularnewline
F-TEST (value) & 8.86073767963696 \tabularnewline
F-TEST (DF numerator) & 13 \tabularnewline
F-TEST (DF denominator) & 48 \tabularnewline
p-value & 7.68001950923747e-09 \tabularnewline
Multiple Linear Regression - Residual Statistics \tabularnewline
Residual Standard Deviation & 9941.31155470337 \tabularnewline
Sum Squared Residuals & 4743824420.52858 \tabularnewline
\hline
\end{tabular}
%Source: https://freestatistics.org/blog/index.php?pk=34473&T=3

[TABLE]
[ROW][C]Multiple Linear Regression - Regression Statistics[/C][/ROW]
[ROW][C]Multiple R[/C][C]0.840156884536671[/C][/ROW]
[ROW][C]R-squared[/C][C]0.705863590634366[/C][/ROW]
[ROW][C]Adjusted R-squared[/C][C]0.626201646431173[/C][/ROW]
[ROW][C]F-TEST (value)[/C][C]8.86073767963696[/C][/ROW]
[ROW][C]F-TEST (DF numerator)[/C][C]13[/C][/ROW]
[ROW][C]F-TEST (DF denominator)[/C][C]48[/C][/ROW]
[ROW][C]p-value[/C][C]7.68001950923747e-09[/C][/ROW]
[ROW][C]Multiple Linear Regression - Residual Statistics[/C][/ROW]
[ROW][C]Residual Standard Deviation[/C][C]9941.31155470337[/C][/ROW]
[ROW][C]Sum Squared Residuals[/C][C]4743824420.52858[/C][/ROW]
[/TABLE]
Source: https://freestatistics.org/blog/index.php?pk=34473&T=3

Globally Unique Identifier (entire table): ba.freestatistics.org/blog/index.php?pk=34473&T=3

As an alternative you can also use a QR Code:  

The GUIDs for individual cells are displayed in the table below:

Multiple Linear Regression - Regression Statistics
Multiple R0.840156884536671
R-squared0.705863590634366
Adjusted R-squared0.626201646431173
F-TEST (value)8.86073767963696
F-TEST (DF numerator)13
F-TEST (DF denominator)48
p-value7.68001950923747e-09
Multiple Linear Regression - Residual Statistics
Residual Standard Deviation9941.31155470337
Sum Squared Residuals4743824420.52858


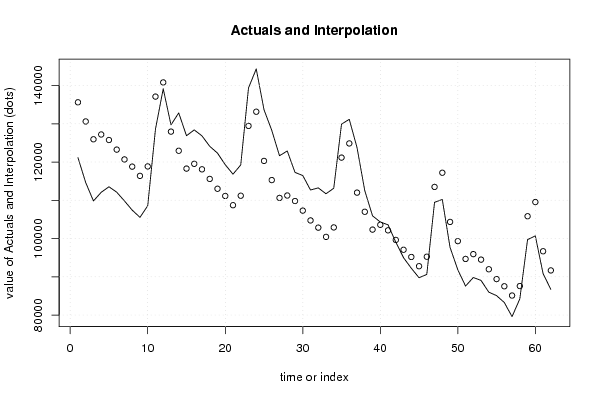
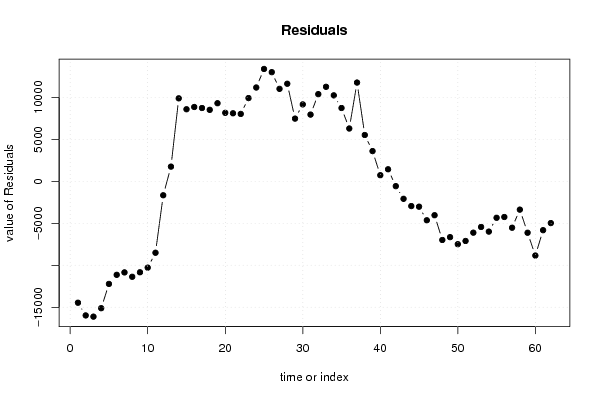
Multiple Linear Regression - Actuals, Interpolation, and Residuals
Time or IndexActualsInterpolationForecastResidualsPrediction Error
1121148135605.785714286-14457.7857142858
2114624130596.785714286-15972.7857142856
3109822125939.828571429-16117.8285714286
4112081127192.121428571-15111.1214285715
5113534125752.121428571-12218.1214285714
6112110123242.521428571-11132.5214285714
7109826120674.721428571-10848.7214285714
8107423118790.521428571-11367.5214285714
9105540116374.521428571-10834.5214285714
10108573118850.921428571-10277.9214285714
11128591137096.321428571-8505.32142857143
12139145140802.321428571-1657.32142857142
13129700127944.7642857141755.23571428574
14132828122935.7642857149892.2357142857
15126868118278.8071428578589.19285714286
16128390119531.18858.9
17126830118091.18738.9
18124105115581.58523.5
19122323113013.79309.3
20119296111129.58166.5
21116822108713.58108.5
22119224111189.98034.1
23139357129435.39921.7
24144322133141.311180.7
25133676120283.74285714313392.2571428572
26128283115274.74285714313008.2571428571
27121640110617.78571428611022.2142857143
28122877111246.61428571411630.3857142857
29117284109806.6142857147477.38571428573
30116463107297.0142857149165.98571428573
31112685104729.2142857147955.78571428571
32113235102845.01428571410389.9857142857
33111692100429.01428571411262.9857142857
34113152102905.41428571410246.5857142857
35129889121150.8142857148738.18571428572
36131153124856.8142857146296.18571428573
37123770111999.25714285711770.7428571429
38112516106990.2571428575525.74285714286
39105940102333.33606.7
40104320103585.592857143734.407142857149
41103582102145.5928571431436.40714285715
429906499635.9928571429-571.992857142858
439498997068.1928571429-2079.19285714287
449224195183.9928571429-2942.99285714286
458975292767.9928571429-3015.99285714286
469061095244.3928571429-4634.39285714286
47109456113489.792857143-4033.79285714285
48110213117195.792857143-6982.79285714285
4997694104338.235714286-6644.23571428569
509184499329.2357142857-7485.23571428572
518757294672.2785714286-7100.27857142858
528981295924.5714285714-6112.57142857143
538905094484.5714285714-5434.57142857143
548599091974.9714285714-5984.97142857144
558507089407.1714285714-4337.17142857144
568327787522.9714285714-4245.97142857144
577958685106.9714285714-5520.97142857144
588421587583.3714285714-3368.37142857143
5999708105828.771428571-6120.77142857143
60100698109534.771428571-8836.77142857143
619086196677.2142857143-5816.21428571426
628670091668.2142857143-4968.2142857143

\begin{tabular}{lllllllll}
\hline
Multiple Linear Regression - Actuals, Interpolation, and Residuals \tabularnewline
Time or Index & Actuals & InterpolationForecast & ResidualsPrediction Error \tabularnewline
1 & 121148 & 135605.785714286 & -14457.7857142858 \tabularnewline
2 & 114624 & 130596.785714286 & -15972.7857142856 \tabularnewline
3 & 109822 & 125939.828571429 & -16117.8285714286 \tabularnewline
4 & 112081 & 127192.121428571 & -15111.1214285715 \tabularnewline
5 & 113534 & 125752.121428571 & -12218.1214285714 \tabularnewline
6 & 112110 & 123242.521428571 & -11132.5214285714 \tabularnewline
7 & 109826 & 120674.721428571 & -10848.7214285714 \tabularnewline
8 & 107423 & 118790.521428571 & -11367.5214285714 \tabularnewline
9 & 105540 & 116374.521428571 & -10834.5214285714 \tabularnewline
10 & 108573 & 118850.921428571 & -10277.9214285714 \tabularnewline
11 & 128591 & 137096.321428571 & -8505.32142857143 \tabularnewline
12 & 139145 & 140802.321428571 & -1657.32142857142 \tabularnewline
13 & 129700 & 127944.764285714 & 1755.23571428574 \tabularnewline
14 & 132828 & 122935.764285714 & 9892.2357142857 \tabularnewline
15 & 126868 & 118278.807142857 & 8589.19285714286 \tabularnewline
16 & 128390 & 119531.1 & 8858.9 \tabularnewline
17 & 126830 & 118091.1 & 8738.9 \tabularnewline
18 & 124105 & 115581.5 & 8523.5 \tabularnewline
19 & 122323 & 113013.7 & 9309.3 \tabularnewline
20 & 119296 & 111129.5 & 8166.5 \tabularnewline
21 & 116822 & 108713.5 & 8108.5 \tabularnewline
22 & 119224 & 111189.9 & 8034.1 \tabularnewline
23 & 139357 & 129435.3 & 9921.7 \tabularnewline
24 & 144322 & 133141.3 & 11180.7 \tabularnewline
25 & 133676 & 120283.742857143 & 13392.2571428572 \tabularnewline
26 & 128283 & 115274.742857143 & 13008.2571428571 \tabularnewline
27 & 121640 & 110617.785714286 & 11022.2142857143 \tabularnewline
28 & 122877 & 111246.614285714 & 11630.3857142857 \tabularnewline
29 & 117284 & 109806.614285714 & 7477.38571428573 \tabularnewline
30 & 116463 & 107297.014285714 & 9165.98571428573 \tabularnewline
31 & 112685 & 104729.214285714 & 7955.78571428571 \tabularnewline
32 & 113235 & 102845.014285714 & 10389.9857142857 \tabularnewline
33 & 111692 & 100429.014285714 & 11262.9857142857 \tabularnewline
34 & 113152 & 102905.414285714 & 10246.5857142857 \tabularnewline
35 & 129889 & 121150.814285714 & 8738.18571428572 \tabularnewline
36 & 131153 & 124856.814285714 & 6296.18571428573 \tabularnewline
37 & 123770 & 111999.257142857 & 11770.7428571429 \tabularnewline
38 & 112516 & 106990.257142857 & 5525.74285714286 \tabularnewline
39 & 105940 & 102333.3 & 3606.7 \tabularnewline
40 & 104320 & 103585.592857143 & 734.407142857149 \tabularnewline
41 & 103582 & 102145.592857143 & 1436.40714285715 \tabularnewline
42 & 99064 & 99635.9928571429 & -571.992857142858 \tabularnewline
43 & 94989 & 97068.1928571429 & -2079.19285714287 \tabularnewline
44 & 92241 & 95183.9928571429 & -2942.99285714286 \tabularnewline
45 & 89752 & 92767.9928571429 & -3015.99285714286 \tabularnewline
46 & 90610 & 95244.3928571429 & -4634.39285714286 \tabularnewline
47 & 109456 & 113489.792857143 & -4033.79285714285 \tabularnewline
48 & 110213 & 117195.792857143 & -6982.79285714285 \tabularnewline
49 & 97694 & 104338.235714286 & -6644.23571428569 \tabularnewline
50 & 91844 & 99329.2357142857 & -7485.23571428572 \tabularnewline
51 & 87572 & 94672.2785714286 & -7100.27857142858 \tabularnewline
52 & 89812 & 95924.5714285714 & -6112.57142857143 \tabularnewline
53 & 89050 & 94484.5714285714 & -5434.57142857143 \tabularnewline
54 & 85990 & 91974.9714285714 & -5984.97142857144 \tabularnewline
55 & 85070 & 89407.1714285714 & -4337.17142857144 \tabularnewline
56 & 83277 & 87522.9714285714 & -4245.97142857144 \tabularnewline
57 & 79586 & 85106.9714285714 & -5520.97142857144 \tabularnewline
58 & 84215 & 87583.3714285714 & -3368.37142857143 \tabularnewline
59 & 99708 & 105828.771428571 & -6120.77142857143 \tabularnewline
60 & 100698 & 109534.771428571 & -8836.77142857143 \tabularnewline
61 & 90861 & 96677.2142857143 & -5816.21428571426 \tabularnewline
62 & 86700 & 91668.2142857143 & -4968.2142857143 \tabularnewline
\hline
\end{tabular}
%Source: https://freestatistics.org/blog/index.php?pk=34473&T=4

[TABLE]
[ROW][C]Multiple Linear Regression - Actuals, Interpolation, and Residuals[/C][/ROW]
[ROW][C]Time or Index[/C][C]Actuals[/C][C]InterpolationForecast[/C][C]ResidualsPrediction Error[/C][/ROW]
[ROW][C]1[/C][C]121148[/C][C]135605.785714286[/C][C]-14457.7857142858[/C][/ROW]
[ROW][C]2[/C][C]114624[/C][C]130596.785714286[/C][C]-15972.7857142856[/C][/ROW]
[ROW][C]3[/C][C]109822[/C][C]125939.828571429[/C][C]-16117.8285714286[/C][/ROW]
[ROW][C]4[/C][C]112081[/C][C]127192.121428571[/C][C]-15111.1214285715[/C][/ROW]
[ROW][C]5[/C][C]113534[/C][C]125752.121428571[/C][C]-12218.1214285714[/C][/ROW]
[ROW][C]6[/C][C]112110[/C][C]123242.521428571[/C][C]-11132.5214285714[/C][/ROW]
[ROW][C]7[/C][C]109826[/C][C]120674.721428571[/C][C]-10848.7214285714[/C][/ROW]
[ROW][C]8[/C][C]107423[/C][C]118790.521428571[/C][C]-11367.5214285714[/C][/ROW]
[ROW][C]9[/C][C]105540[/C][C]116374.521428571[/C][C]-10834.5214285714[/C][/ROW]
[ROW][C]10[/C][C]108573[/C][C]118850.921428571[/C][C]-10277.9214285714[/C][/ROW]
[ROW][C]11[/C][C]128591[/C][C]137096.321428571[/C][C]-8505.32142857143[/C][/ROW]
[ROW][C]12[/C][C]139145[/C][C]140802.321428571[/C][C]-1657.32142857142[/C][/ROW]
[ROW][C]13[/C][C]129700[/C][C]127944.764285714[/C][C]1755.23571428574[/C][/ROW]
[ROW][C]14[/C][C]132828[/C][C]122935.764285714[/C][C]9892.2357142857[/C][/ROW]
[ROW][C]15[/C][C]126868[/C][C]118278.807142857[/C][C]8589.19285714286[/C][/ROW]
[ROW][C]16[/C][C]128390[/C][C]119531.1[/C][C]8858.9[/C][/ROW]
[ROW][C]17[/C][C]126830[/C][C]118091.1[/C][C]8738.9[/C][/ROW]
[ROW][C]18[/C][C]124105[/C][C]115581.5[/C][C]8523.5[/C][/ROW]
[ROW][C]19[/C][C]122323[/C][C]113013.7[/C][C]9309.3[/C][/ROW]
[ROW][C]20[/C][C]119296[/C][C]111129.5[/C][C]8166.5[/C][/ROW]
[ROW][C]21[/C][C]116822[/C][C]108713.5[/C][C]8108.5[/C][/ROW]
[ROW][C]22[/C][C]119224[/C][C]111189.9[/C][C]8034.1[/C][/ROW]
[ROW][C]23[/C][C]139357[/C][C]129435.3[/C][C]9921.7[/C][/ROW]
[ROW][C]24[/C][C]144322[/C][C]133141.3[/C][C]11180.7[/C][/ROW]
[ROW][C]25[/C][C]133676[/C][C]120283.742857143[/C][C]13392.2571428572[/C][/ROW]
[ROW][C]26[/C][C]128283[/C][C]115274.742857143[/C][C]13008.2571428571[/C][/ROW]
[ROW][C]27[/C][C]121640[/C][C]110617.785714286[/C][C]11022.2142857143[/C][/ROW]
[ROW][C]28[/C][C]122877[/C][C]111246.614285714[/C][C]11630.3857142857[/C][/ROW]
[ROW][C]29[/C][C]117284[/C][C]109806.614285714[/C][C]7477.38571428573[/C][/ROW]
[ROW][C]30[/C][C]116463[/C][C]107297.014285714[/C][C]9165.98571428573[/C][/ROW]
[ROW][C]31[/C][C]112685[/C][C]104729.214285714[/C][C]7955.78571428571[/C][/ROW]
[ROW][C]32[/C][C]113235[/C][C]102845.014285714[/C][C]10389.9857142857[/C][/ROW]
[ROW][C]33[/C][C]111692[/C][C]100429.014285714[/C][C]11262.9857142857[/C][/ROW]
[ROW][C]34[/C][C]113152[/C][C]102905.414285714[/C][C]10246.5857142857[/C][/ROW]
[ROW][C]35[/C][C]129889[/C][C]121150.814285714[/C][C]8738.18571428572[/C][/ROW]
[ROW][C]36[/C][C]131153[/C][C]124856.814285714[/C][C]6296.18571428573[/C][/ROW]
[ROW][C]37[/C][C]123770[/C][C]111999.257142857[/C][C]11770.7428571429[/C][/ROW]
[ROW][C]38[/C][C]112516[/C][C]106990.257142857[/C][C]5525.74285714286[/C][/ROW]
[ROW][C]39[/C][C]105940[/C][C]102333.3[/C][C]3606.7[/C][/ROW]
[ROW][C]40[/C][C]104320[/C][C]103585.592857143[/C][C]734.407142857149[/C][/ROW]
[ROW][C]41[/C][C]103582[/C][C]102145.592857143[/C][C]1436.40714285715[/C][/ROW]
[ROW][C]42[/C][C]99064[/C][C]99635.9928571429[/C][C]-571.992857142858[/C][/ROW]
[ROW][C]43[/C][C]94989[/C][C]97068.1928571429[/C][C]-2079.19285714287[/C][/ROW]
[ROW][C]44[/C][C]92241[/C][C]95183.9928571429[/C][C]-2942.99285714286[/C][/ROW]
[ROW][C]45[/C][C]89752[/C][C]92767.9928571429[/C][C]-3015.99285714286[/C][/ROW]
[ROW][C]46[/C][C]90610[/C][C]95244.3928571429[/C][C]-4634.39285714286[/C][/ROW]
[ROW][C]47[/C][C]109456[/C][C]113489.792857143[/C][C]-4033.79285714285[/C][/ROW]
[ROW][C]48[/C][C]110213[/C][C]117195.792857143[/C][C]-6982.79285714285[/C][/ROW]
[ROW][C]49[/C][C]97694[/C][C]104338.235714286[/C][C]-6644.23571428569[/C][/ROW]
[ROW][C]50[/C][C]91844[/C][C]99329.2357142857[/C][C]-7485.23571428572[/C][/ROW]
[ROW][C]51[/C][C]87572[/C][C]94672.2785714286[/C][C]-7100.27857142858[/C][/ROW]
[ROW][C]52[/C][C]89812[/C][C]95924.5714285714[/C][C]-6112.57142857143[/C][/ROW]
[ROW][C]53[/C][C]89050[/C][C]94484.5714285714[/C][C]-5434.57142857143[/C][/ROW]
[ROW][C]54[/C][C]85990[/C][C]91974.9714285714[/C][C]-5984.97142857144[/C][/ROW]
[ROW][C]55[/C][C]85070[/C][C]89407.1714285714[/C][C]-4337.17142857144[/C][/ROW]
[ROW][C]56[/C][C]83277[/C][C]87522.9714285714[/C][C]-4245.97142857144[/C][/ROW]
[ROW][C]57[/C][C]79586[/C][C]85106.9714285714[/C][C]-5520.97142857144[/C][/ROW]
[ROW][C]58[/C][C]84215[/C][C]87583.3714285714[/C][C]-3368.37142857143[/C][/ROW]
[ROW][C]59[/C][C]99708[/C][C]105828.771428571[/C][C]-6120.77142857143[/C][/ROW]
[ROW][C]60[/C][C]100698[/C][C]109534.771428571[/C][C]-8836.77142857143[/C][/ROW]
[ROW][C]61[/C][C]90861[/C][C]96677.2142857143[/C][C]-5816.21428571426[/C][/ROW]
[ROW][C]62[/C][C]86700[/C][C]91668.2142857143[/C][C]-4968.2142857143[/C][/ROW]
[/TABLE]
Source: https://freestatistics.org/blog/index.php?pk=34473&T=4

Globally Unique Identifier (entire table): ba.freestatistics.org/blog/index.php?pk=34473&T=4

As an alternative you can also use a QR Code:  

The GUIDs for individual cells are displayed in the table below:

Multiple Linear Regression - Actuals, Interpolation, and Residuals
Time or IndexActualsInterpolationForecastResidualsPrediction Error
1121148135605.785714286-14457.7857142858
2114624130596.785714286-15972.7857142856
3109822125939.828571429-16117.8285714286
4112081127192.121428571-15111.1214285715
5113534125752.121428571-12218.1214285714
6112110123242.521428571-11132.5214285714
7109826120674.721428571-10848.7214285714
8107423118790.521428571-11367.5214285714
9105540116374.521428571-10834.5214285714
10108573118850.921428571-10277.9214285714
11128591137096.321428571-8505.32142857143
12139145140802.321428571-1657.32142857142
13129700127944.7642857141755.23571428574
14132828122935.7642857149892.2357142857
15126868118278.8071428578589.19285714286
16128390119531.18858.9
17126830118091.18738.9
18124105115581.58523.5
19122323113013.79309.3
20119296111129.58166.5
21116822108713.58108.5
22119224111189.98034.1
23139357129435.39921.7
24144322133141.311180.7
25133676120283.74285714313392.2571428572
26128283115274.74285714313008.2571428571
27121640110617.78571428611022.2142857143
28122877111246.61428571411630.3857142857
29117284109806.6142857147477.38571428573
30116463107297.0142857149165.98571428573
31112685104729.2142857147955.78571428571
32113235102845.01428571410389.9857142857
33111692100429.01428571411262.9857142857
34113152102905.41428571410246.5857142857
35129889121150.8142857148738.18571428572
36131153124856.8142857146296.18571428573
37123770111999.25714285711770.7428571429
38112516106990.2571428575525.74285714286
39105940102333.33606.7
40104320103585.592857143734.407142857149
41103582102145.5928571431436.40714285715
429906499635.9928571429-571.992857142858
439498997068.1928571429-2079.19285714287
449224195183.9928571429-2942.99285714286
458975292767.9928571429-3015.99285714286
469061095244.3928571429-4634.39285714286
47109456113489.792857143-4033.79285714285
48110213117195.792857143-6982.79285714285
4997694104338.235714286-6644.23571428569
509184499329.2357142857-7485.23571428572
518757294672.2785714286-7100.27857142858
528981295924.5714285714-6112.57142857143
538905094484.5714285714-5434.57142857143
548599091974.9714285714-5984.97142857144
558507089407.1714285714-4337.17142857144
568327787522.9714285714-4245.97142857144
577958685106.9714285714-5520.97142857144
588421587583.3714285714-3368.37142857143
5999708105828.771428571-6120.77142857143
60100698109534.771428571-8836.77142857143
619086196677.2142857143-5816.21428571426
628670091668.2142857143-4968.2142857143


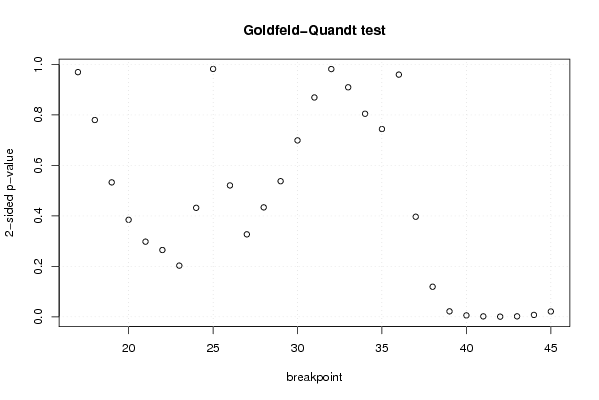
Goldfeld-Quandt test for Heteroskedasticity
p-valuesAlternative Hypothesis
breakpoint indexgreater2-sidedless
170.5152811002250190.9694377995499610.484718899774981
180.3898748098229490.7797496196458980.610125190177051
190.2663990374494750.5327980748989490.733600962550526
200.1922279011459100.3844558022918210.80777209885409
210.1489378559110380.2978757118220760.851062144088962
220.1323566405463670.2647132810927340.867643359453633
230.1014551262590100.2029102525180200.89854487374099
240.2159596829955160.4319193659910320.784040317004484
250.4910315458883030.9820630917766070.508968454111697
260.7396780057997860.5206439884004280.260321994200214
270.8365462054207620.3269075891584770.163453794579238
280.7831353886514750.433729222697050.216864611348525
290.731283892309140.5374322153817210.268716107690860
300.6504175919313120.6991648161373760.349582408068688
310.5654673454109260.8690653091781470.434532654589074
320.4908104693572920.9816209387145850.509189530642708
330.4546958742330240.9093917484660480.545304125766976
340.4022686581839320.8045373163678640.597731341816068
350.3720115874122610.7440231748245230.627988412587739
360.4797928593365670.9595857186731340.520207140663433
370.8017130795323240.3965738409353510.198286920467676
380.9403643220958320.1192713558083350.0596356779041675
390.9890803610384760.02183927792304790.0109196389615239
400.997131734049210.005736531901579080.00286826595078954
410.9990712280803690.001857543839262270.000928771919631133
420.9996051056434190.0007897887131628150.000394894356581408
430.9989914262862370.002017147427525550.00100857371376277
440.9962154384459250.007569123108150530.00378456155407526
450.9893611687623570.02127766247528560.0106388312376428

\begin{tabular}{lllllllll}
\hline
Goldfeld-Quandt test for Heteroskedasticity \tabularnewline
p-values & Alternative Hypothesis \tabularnewline
breakpoint index & greater & 2-sided & less \tabularnewline
17 & 0.515281100225019 & 0.969437799549961 & 0.484718899774981 \tabularnewline
18 & 0.389874809822949 & 0.779749619645898 & 0.610125190177051 \tabularnewline
19 & 0.266399037449475 & 0.532798074898949 & 0.733600962550526 \tabularnewline
20 & 0.192227901145910 & 0.384455802291821 & 0.80777209885409 \tabularnewline
21 & 0.148937855911038 & 0.297875711822076 & 0.851062144088962 \tabularnewline
22 & 0.132356640546367 & 0.264713281092734 & 0.867643359453633 \tabularnewline
23 & 0.101455126259010 & 0.202910252518020 & 0.89854487374099 \tabularnewline
24 & 0.215959682995516 & 0.431919365991032 & 0.784040317004484 \tabularnewline
25 & 0.491031545888303 & 0.982063091776607 & 0.508968454111697 \tabularnewline
26 & 0.739678005799786 & 0.520643988400428 & 0.260321994200214 \tabularnewline
27 & 0.836546205420762 & 0.326907589158477 & 0.163453794579238 \tabularnewline
28 & 0.783135388651475 & 0.43372922269705 & 0.216864611348525 \tabularnewline
29 & 0.73128389230914 & 0.537432215381721 & 0.268716107690860 \tabularnewline
30 & 0.650417591931312 & 0.699164816137376 & 0.349582408068688 \tabularnewline
31 & 0.565467345410926 & 0.869065309178147 & 0.434532654589074 \tabularnewline
32 & 0.490810469357292 & 0.981620938714585 & 0.509189530642708 \tabularnewline
33 & 0.454695874233024 & 0.909391748466048 & 0.545304125766976 \tabularnewline
34 & 0.402268658183932 & 0.804537316367864 & 0.597731341816068 \tabularnewline
35 & 0.372011587412261 & 0.744023174824523 & 0.627988412587739 \tabularnewline
36 & 0.479792859336567 & 0.959585718673134 & 0.520207140663433 \tabularnewline
37 & 0.801713079532324 & 0.396573840935351 & 0.198286920467676 \tabularnewline
38 & 0.940364322095832 & 0.119271355808335 & 0.0596356779041675 \tabularnewline
39 & 0.989080361038476 & 0.0218392779230479 & 0.0109196389615239 \tabularnewline
40 & 0.99713173404921 & 0.00573653190157908 & 0.00286826595078954 \tabularnewline
41 & 0.999071228080369 & 0.00185754383926227 & 0.000928771919631133 \tabularnewline
42 & 0.999605105643419 & 0.000789788713162815 & 0.000394894356581408 \tabularnewline
43 & 0.998991426286237 & 0.00201714742752555 & 0.00100857371376277 \tabularnewline
44 & 0.996215438445925 & 0.00756912310815053 & 0.00378456155407526 \tabularnewline
45 & 0.989361168762357 & 0.0212776624752856 & 0.0106388312376428 \tabularnewline
\hline
\end{tabular}
%Source: https://freestatistics.org/blog/index.php?pk=34473&T=5

[TABLE]
[ROW][C]Goldfeld-Quandt test for Heteroskedasticity[/C][/ROW]
[ROW][C]p-values[/C][C]Alternative Hypothesis[/C][/ROW]
[ROW][C]breakpoint index[/C][C]greater[/C][C]2-sided[/C][C]less[/C][/ROW]
[ROW][C]17[/C][C]0.515281100225019[/C][C]0.969437799549961[/C][C]0.484718899774981[/C][/ROW]
[ROW][C]18[/C][C]0.389874809822949[/C][C]0.779749619645898[/C][C]0.610125190177051[/C][/ROW]
[ROW][C]19[/C][C]0.266399037449475[/C][C]0.532798074898949[/C][C]0.733600962550526[/C][/ROW]
[ROW][C]20[/C][C]0.192227901145910[/C][C]0.384455802291821[/C][C]0.80777209885409[/C][/ROW]
[ROW][C]21[/C][C]0.148937855911038[/C][C]0.297875711822076[/C][C]0.851062144088962[/C][/ROW]
[ROW][C]22[/C][C]0.132356640546367[/C][C]0.264713281092734[/C][C]0.867643359453633[/C][/ROW]
[ROW][C]23[/C][C]0.101455126259010[/C][C]0.202910252518020[/C][C]0.89854487374099[/C][/ROW]
[ROW][C]24[/C][C]0.215959682995516[/C][C]0.431919365991032[/C][C]0.784040317004484[/C][/ROW]
[ROW][C]25[/C][C]0.491031545888303[/C][C]0.982063091776607[/C][C]0.508968454111697[/C][/ROW]
[ROW][C]26[/C][C]0.739678005799786[/C][C]0.520643988400428[/C][C]0.260321994200214[/C][/ROW]
[ROW][C]27[/C][C]0.836546205420762[/C][C]0.326907589158477[/C][C]0.163453794579238[/C][/ROW]
[ROW][C]28[/C][C]0.783135388651475[/C][C]0.43372922269705[/C][C]0.216864611348525[/C][/ROW]
[ROW][C]29[/C][C]0.73128389230914[/C][C]0.537432215381721[/C][C]0.268716107690860[/C][/ROW]
[ROW][C]30[/C][C]0.650417591931312[/C][C]0.699164816137376[/C][C]0.349582408068688[/C][/ROW]
[ROW][C]31[/C][C]0.565467345410926[/C][C]0.869065309178147[/C][C]0.434532654589074[/C][/ROW]
[ROW][C]32[/C][C]0.490810469357292[/C][C]0.981620938714585[/C][C]0.509189530642708[/C][/ROW]
[ROW][C]33[/C][C]0.454695874233024[/C][C]0.909391748466048[/C][C]0.545304125766976[/C][/ROW]
[ROW][C]34[/C][C]0.402268658183932[/C][C]0.804537316367864[/C][C]0.597731341816068[/C][/ROW]
[ROW][C]35[/C][C]0.372011587412261[/C][C]0.744023174824523[/C][C]0.627988412587739[/C][/ROW]
[ROW][C]36[/C][C]0.479792859336567[/C][C]0.959585718673134[/C][C]0.520207140663433[/C][/ROW]
[ROW][C]37[/C][C]0.801713079532324[/C][C]0.396573840935351[/C][C]0.198286920467676[/C][/ROW]
[ROW][C]38[/C][C]0.940364322095832[/C][C]0.119271355808335[/C][C]0.0596356779041675[/C][/ROW]
[ROW][C]39[/C][C]0.989080361038476[/C][C]0.0218392779230479[/C][C]0.0109196389615239[/C][/ROW]
[ROW][C]40[/C][C]0.99713173404921[/C][C]0.00573653190157908[/C][C]0.00286826595078954[/C][/ROW]
[ROW][C]41[/C][C]0.999071228080369[/C][C]0.00185754383926227[/C][C]0.000928771919631133[/C][/ROW]
[ROW][C]42[/C][C]0.999605105643419[/C][C]0.000789788713162815[/C][C]0.000394894356581408[/C][/ROW]
[ROW][C]43[/C][C]0.998991426286237[/C][C]0.00201714742752555[/C][C]0.00100857371376277[/C][/ROW]
[ROW][C]44[/C][C]0.996215438445925[/C][C]0.00756912310815053[/C][C]0.00378456155407526[/C][/ROW]
[ROW][C]45[/C][C]0.989361168762357[/C][C]0.0212776624752856[/C][C]0.0106388312376428[/C][/ROW]
[/TABLE]
Source: https://freestatistics.org/blog/index.php?pk=34473&T=5

Globally Unique Identifier (entire table): ba.freestatistics.org/blog/index.php?pk=34473&T=5

As an alternative you can also use a QR Code:  

The GUIDs for individual cells are displayed in the table below:

Goldfeld-Quandt test for Heteroskedasticity
p-valuesAlternative Hypothesis
breakpoint indexgreater2-sidedless
170.5152811002250190.9694377995499610.484718899774981
180.3898748098229490.7797496196458980.610125190177051
190.2663990374494750.5327980748989490.733600962550526
200.1922279011459100.3844558022918210.80777209885409
210.1489378559110380.2978757118220760.851062144088962
220.1323566405463670.2647132810927340.867643359453633
230.1014551262590100.2029102525180200.89854487374099
240.2159596829955160.4319193659910320.784040317004484
250.4910315458883030.9820630917766070.508968454111697
260.7396780057997860.5206439884004280.260321994200214
270.8365462054207620.3269075891584770.163453794579238
280.7831353886514750.433729222697050.216864611348525
290.731283892309140.5374322153817210.268716107690860
300.6504175919313120.6991648161373760.349582408068688
310.5654673454109260.8690653091781470.434532654589074
320.4908104693572920.9816209387145850.509189530642708
330.4546958742330240.9093917484660480.545304125766976
340.4022686581839320.8045373163678640.597731341816068
350.3720115874122610.7440231748245230.627988412587739
360.4797928593365670.9595857186731340.520207140663433
370.8017130795323240.3965738409353510.198286920467676
380.9403643220958320.1192713558083350.0596356779041675
390.9890803610384760.02183927792304790.0109196389615239
400.997131734049210.005736531901579080.00286826595078954
410.9990712280803690.001857543839262270.000928771919631133
420.9996051056434190.0007897887131628150.000394894356581408
430.9989914262862370.002017147427525550.00100857371376277
440.9962154384459250.007569123108150530.00378456155407526
450.9893611687623570.02127766247528560.0106388312376428


Meta Analysis of Goldfeld-Quandt test for Heteroskedasticity
Description# significant tests% significant testsOK/NOK
1% type I error level50.172413793103448NOK
5% type I error level70.241379310344828NOK
10% type I error level70.241379310344828NOK

\begin{tabular}{lllllllll}
\hline
Meta Analysis of Goldfeld-Quandt test for Heteroskedasticity \tabularnewline
Description & # significant tests & % significant tests & OK/NOK \tabularnewline
1% type I error level & 5 & 0.172413793103448 & NOK \tabularnewline
5% type I error level & 7 & 0.241379310344828 & NOK \tabularnewline
10% type I error level & 7 & 0.241379310344828 & NOK \tabularnewline
\hline
\end{tabular}
%Source: https://freestatistics.org/blog/index.php?pk=34473&T=6

[TABLE]
[ROW][C]Meta Analysis of Goldfeld-Quandt test for Heteroskedasticity[/C][/ROW]
[ROW][C]Description[/C][C]# significant tests[/C][C]% significant tests[/C][C]OK/NOK[/C][/ROW]
[ROW][C]1% type I error level[/C][C]5[/C][C]0.172413793103448[/C][C]NOK[/C][/ROW]
[ROW][C]5% type I error level[/C][C]7[/C][C]0.241379310344828[/C][C]NOK[/C][/ROW]
[ROW][C]10% type I error level[/C][C]7[/C][C]0.241379310344828[/C][C]NOK[/C][/ROW]
[/TABLE]
Source: https://freestatistics.org/blog/index.php?pk=34473&T=6

Globally Unique Identifier (entire table): ba.freestatistics.org/blog/index.php?pk=34473&T=6

As an alternative you can also use a QR Code:  

The GUIDs for individual cells are displayed in the table below:

Meta Analysis of Goldfeld-Quandt test for Heteroskedasticity
Description# significant tests% significant testsOK/NOK
1% type I error level50.172413793103448NOK
5% type I error level70.241379310344828NOK
10% type I error level70.241379310344828NOK


Parameters (Session):
par1 = 60 ; par2 = 1 ; par3 = 1 ; par4 = 0 ; par5 = 12 ;
Parameters (R input):
par1 = 1 ; par2 = Include Monthly Dummies ; par3 = Linear Trend ;
R code (references can be found in the software module):
library(lattice)
library(lmtest)
n25 <- 25 #minimum number of obs. for Goldfeld-Quandt test
par1 <- as.numeric(par1)
x <- t(y)
k <- length(x[1,])
n <- length(x[,1])
x1 <- cbind(x[,par1], x[,1:k!=par1])
mycolnames <- c(colnames(x)[par1], colnames(x)[1:k!=par1])
colnames(x1) <- mycolnames #colnames(x)[par1]
x <- x1
if (par3 == 'First Differences'){
x2 <- array(0, dim=c(n-1,k), dimnames=list(1:(n-1), paste('(1-B)',colnames(x),sep='')))
for (i in 1:n-1) {
for (j in 1:k) {
x2[i,j] <- x[i+1,j] - x[i,j]
}
}
x <- x2
}
if (par2 == 'Include Monthly Dummies'){
x2 <- array(0, dim=c(n,11), dimnames=list(1:n, paste('M', seq(1:11), sep ='')))
for (i in 1:11){
x2[seq(i,n,12),i] <- 1
}
x <- cbind(x, x2)
}
if (par2 == 'Include Quarterly Dummies'){
x2 <- array(0, dim=c(n,3), dimnames=list(1:n, paste('Q', seq(1:3), sep ='')))
for (i in 1:3){
x2[seq(i,n,4),i] <- 1
}
x <- cbind(x, x2)
}
k <- length(x[1,])
if (par3 == 'Linear Trend'){
x <- cbind(x, c(1:n))
colnames(x)[k+1] <- 't'
}
x
k <- length(x[1,])
df <- as.data.frame(x)
(mylm <- lm(df))
(mysum <- summary(mylm))
if (n > n25) {
kp3 <- k + 3
nmkm3 <- n - k - 3
gqarr <- array(NA, dim=c(nmkm3-kp3+1,3))
numgqtests <- 0
numsignificant1 <- 0
numsignificant5 <- 0
numsignificant10 <- 0
for (mypoint in kp3:nmkm3) {
j <- 0
numgqtests <- numgqtests + 1
for (myalt in c('greater', 'two.sided', 'less')) {
j <- j + 1
gqarr[mypoint-kp3+1,j] <- gqtest(mylm, point=mypoint, alternative=myalt)$p.value
}
if (gqarr[mypoint-kp3+1,2] < 0.01) numsignificant1 <- numsignificant1 + 1
if (gqarr[mypoint-kp3+1,2] < 0.05) numsignificant5 <- numsignificant5 + 1
if (gqarr[mypoint-kp3+1,2] < 0.10) numsignificant10 <- numsignificant10 + 1
}
gqarr
}
bitmap(file='test0.png')
plot(x[,1], type='l', main='Actuals and Interpolation', ylab='value of Actuals and Interpolation (dots)', xlab='time or index')
points(x[,1]-mysum$resid)
grid()
dev.off()
bitmap(file='test1.png')
plot(mysum$resid, type='b', pch=19, main='Residuals', ylab='value of Residuals', xlab='time or index')
grid()
dev.off()
bitmap(file='test2.png')
hist(mysum$resid, main='Residual Histogram', xlab='values of Residuals')
grid()
dev.off()
bitmap(file='test3.png')
densityplot(~mysum$resid,col='black',main='Residual Density Plot', xlab='values of Residuals')
dev.off()
bitmap(file='test4.png')
qqnorm(mysum$resid, main='Residual Normal Q-Q Plot')
qqline(mysum$resid)
grid()
dev.off()
(myerror <- as.ts(mysum$resid))
bitmap(file='test5.png')
dum <- cbind(lag(myerror,k=1),myerror)
dum
dum1 <- dum[2:length(myerror),]
dum1
z <- as.data.frame(dum1)
z
plot(z,main=paste('Residual Lag plot, lowess, and regression line'), ylab='values of Residuals', xlab='lagged values of Residuals')
lines(lowess(z))
abline(lm(z))
grid()
dev.off()
bitmap(file='test6.png')
acf(mysum$resid, lag.max=length(mysum$resid)/2, main='Residual Autocorrelation Function')
grid()
dev.off()
bitmap(file='test7.png')
pacf(mysum$resid, lag.max=length(mysum$resid)/2, main='Residual Partial Autocorrelation Function')
grid()
dev.off()
bitmap(file='test8.png')
opar <- par(mfrow = c(2,2), oma = c(0, 0, 1.1, 0))
plot(mylm, las = 1, sub='Residual Diagnostics')
par(opar)
dev.off()
if (n > n25) {
bitmap(file='test9.png')
plot(kp3:nmkm3,gqarr[,2], main='Goldfeld-Quandt test',ylab='2-sided p-value',xlab='breakpoint')
grid()
dev.off()
}
load(file='createtable')
a<-table.start()
a<-table.row.start(a)
a<-table.element(a, 'Multiple Linear Regression - Estimated Regression Equation', 1, TRUE)
a<-table.row.end(a)
myeq <- colnames(x)[1]
myeq <- paste(myeq, '[t] = ', sep='')
for (i in 1:k){
if (mysum$coefficients[i,1] > 0) myeq <- paste(myeq, '+', '')
myeq <- paste(myeq, mysum$coefficients[i,1], sep=' ')
if (rownames(mysum$coefficients)[i] != '(Intercept)') {
myeq <- paste(myeq, rownames(mysum$coefficients)[i], sep='')
if (rownames(mysum$coefficients)[i] != 't') myeq <- paste(myeq, '[t]', sep='')
}
}
myeq <- paste(myeq, ' + e[t]')
a<-table.row.start(a)
a<-table.element(a, myeq)
a<-table.row.end(a)
a<-table.end(a)
table.save(a,file='mytable1.tab')
a<-table.start()
a<-table.row.start(a)
a<-table.element(a,hyperlink('ols1.htm','Multiple Linear Regression - Ordinary Least Squares',''), 6, TRUE)
a<-table.row.end(a)
a<-table.row.start(a)
a<-table.element(a,'Variable',header=TRUE)
a<-table.element(a,'Parameter',header=TRUE)
a<-table.element(a,'S.D.',header=TRUE)
a<-table.element(a,'T-STAT
H0: parameter = 0',header=TRUE)
a<-table.element(a,'2-tail p-value',header=TRUE)
a<-table.element(a,'1-tail p-value',header=TRUE)
a<-table.row.end(a)
for (i in 1:k){
a<-table.row.start(a)
a<-table.element(a,rownames(mysum$coefficients)[i],header=TRUE)
a<-table.element(a,mysum$coefficients[i,1])
a<-table.element(a, round(mysum$coefficients[i,2],6))
a<-table.element(a, round(mysum$coefficients[i,3],4))
a<-table.element(a, round(mysum$coefficients[i,4],6))
a<-table.element(a, round(mysum$coefficients[i,4]/2,6))
a<-table.row.end(a)
}
a<-table.end(a)
table.save(a,file='mytable2.tab')
a<-table.start()
a<-table.row.start(a)
a<-table.element(a, 'Multiple Linear Regression - Regression Statistics', 2, TRUE)
a<-table.row.end(a)
a<-table.row.start(a)
a<-table.element(a, 'Multiple R',1,TRUE)
a<-table.element(a, sqrt(mysum$r.squared))
a<-table.row.end(a)
a<-table.row.start(a)
a<-table.element(a, 'R-squared',1,TRUE)
a<-table.element(a, mysum$r.squared)
a<-table.row.end(a)
a<-table.row.start(a)
a<-table.element(a, 'Adjusted R-squared',1,TRUE)
a<-table.element(a, mysum$adj.r.squared)
a<-table.row.end(a)
a<-table.row.start(a)
a<-table.element(a, 'F-TEST (value)',1,TRUE)
a<-table.element(a, mysum$fstatistic[1])
a<-table.row.end(a)
a<-table.row.start(a)
a<-table.element(a, 'F-TEST (DF numerator)',1,TRUE)
a<-table.element(a, mysum$fstatistic[2])
a<-table.row.end(a)
a<-table.row.start(a)
a<-table.element(a, 'F-TEST (DF denominator)',1,TRUE)
a<-table.element(a, mysum$fstatistic[3])
a<-table.row.end(a)
a<-table.row.start(a)
a<-table.element(a, 'p-value',1,TRUE)
a<-table.element(a, 1-pf(mysum$fstatistic[1],mysum$fstatistic[2],mysum$fstatistic[3]))
a<-table.row.end(a)
a<-table.row.start(a)
a<-table.element(a, 'Multiple Linear Regression - Residual Statistics', 2, TRUE)
a<-table.row.end(a)
a<-table.row.start(a)
a<-table.element(a, 'Residual Standard Deviation',1,TRUE)
a<-table.element(a, mysum$sigma)
a<-table.row.end(a)
a<-table.row.start(a)
a<-table.element(a, 'Sum Squared Residuals',1,TRUE)
a<-table.element(a, sum(myerror*myerror))
a<-table.row.end(a)
a<-table.end(a)
table.save(a,file='mytable3.tab')
a<-table.start()
a<-table.row.start(a)
a<-table.element(a, 'Multiple Linear Regression - Actuals, Interpolation, and Residuals', 4, TRUE)
a<-table.row.end(a)
a<-table.row.start(a)
a<-table.element(a, 'Time or Index', 1, TRUE)
a<-table.element(a, 'Actuals', 1, TRUE)
a<-table.element(a, 'Interpolation
Forecast', 1, TRUE)
a<-table.element(a, 'Residuals
Prediction Error', 1, TRUE)
a<-table.row.end(a)
for (i in 1:n) {
a<-table.row.start(a)
a<-table.element(a,i, 1, TRUE)
a<-table.element(a,x[i])
a<-table.element(a,x[i]-mysum$resid[i])
a<-table.element(a,mysum$resid[i])
a<-table.row.end(a)
}
a<-table.end(a)
table.save(a,file='mytable4.tab')
if (n > n25) {
a<-table.start()
a<-table.row.start(a)
a<-table.element(a,'Goldfeld-Quandt test for Heteroskedasticity',4,TRUE)
a<-table.row.end(a)
a<-table.row.start(a)
a<-table.element(a,'p-values',header=TRUE)
a<-table.element(a,'Alternative Hypothesis',3,header=TRUE)
a<-table.row.end(a)
a<-table.row.start(a)
a<-table.element(a,'breakpoint index',header=TRUE)
a<-table.element(a,'greater',header=TRUE)
a<-table.element(a,'2-sided',header=TRUE)
a<-table.element(a,'less',header=TRUE)
a<-table.row.end(a)
for (mypoint in kp3:nmkm3) {
a<-table.row.start(a)
a<-table.element(a,mypoint,header=TRUE)
a<-table.element(a,gqarr[mypoint-kp3+1,1])
a<-table.element(a,gqarr[mypoint-kp3+1,2])
a<-table.element(a,gqarr[mypoint-kp3+1,3])
a<-table.row.end(a)
}
a<-table.end(a)
table.save(a,file='mytable5.tab')
a<-table.start()
a<-table.row.start(a)
a<-table.element(a,'Meta Analysis of Goldfeld-Quandt test for Heteroskedasticity',4,TRUE)
a<-table.row.end(a)
a<-table.row.start(a)
a<-table.element(a,'Description',header=TRUE)
a<-table.element(a,'# significant tests',header=TRUE)
a<-table.element(a,'% significant tests',header=TRUE)
a<-table.element(a,'OK/NOK',header=TRUE)
a<-table.row.end(a)
a<-table.row.start(a)
a<-table.element(a,'1% type I error level',header=TRUE)
a<-table.element(a,numsignificant1)
a<-table.element(a,numsignificant1/numgqtests)
if (numsignificant1/numgqtests < 0.01) dum <- 'OK' else dum <- 'NOK'
a<-table.element(a,dum)
a<-table.row.end(a)
a<-table.row.start(a)
a<-table.element(a,'5% type I error level',header=TRUE)
a<-table.element(a,numsignificant5)
a<-table.element(a,numsignificant5/numgqtests)
if (numsignificant5/numgqtests < 0.05) dum <- 'OK' else dum <- 'NOK'
a<-table.element(a,dum)
a<-table.row.end(a)
a<-table.row.start(a)
a<-table.element(a,'10% type I error level',header=TRUE)
a<-table.element(a,numsignificant10)
a<-table.element(a,numsignificant10/numgqtests)
if (numsignificant10/numgqtests < 0.1) dum <- 'OK' else dum <- 'NOK'
a<-table.element(a,dum)
a<-table.row.end(a)
a<-table.end(a)
table.save(a,file='mytable6.tab')
}