Free Statistics
of Irreproducible Research!
Description of Statistical Computation | |||||||||||||||||||||||||||||||||||||||||
|---|---|---|---|---|---|---|---|---|---|---|---|---|---|---|---|---|---|---|---|---|---|---|---|---|---|---|---|---|---|---|---|---|---|---|---|---|---|---|---|---|---|
| Author's title | |||||||||||||||||||||||||||||||||||||||||
| Author | *The author of this computation has been verified* | ||||||||||||||||||||||||||||||||||||||||
| R Software Module | rwasp_univariatedataseries.wasp | ||||||||||||||||||||||||||||||||||||||||
| Title produced by software | Univariate Data Series | ||||||||||||||||||||||||||||||||||||||||
| Date of computation | Wed, 17 Dec 2008 10:58:54 -0700 | ||||||||||||||||||||||||||||||||||||||||
| Cite this page as follows | Statistical Computations at FreeStatistics.org, Office for Research Development and Education, URL https://freestatistics.org/blog/index.php?v=date/2008/Dec/17/t1229536758czpx4ye15xd94m4.htm/, Retrieved Sun, 19 May 2024 07:45:25 +0000 | ||||||||||||||||||||||||||||||||||||||||
| Statistical Computations at FreeStatistics.org, Office for Research Development and Education, URL https://freestatistics.org/blog/index.php?pk=34457, Retrieved Sun, 19 May 2024 07:45:25 +0000 | |||||||||||||||||||||||||||||||||||||||||
| QR Codes: | |||||||||||||||||||||||||||||||||||||||||
|
| |||||||||||||||||||||||||||||||||||||||||
| Original text written by user: | |||||||||||||||||||||||||||||||||||||||||
| IsPrivate? | No (this computation is public) | ||||||||||||||||||||||||||||||||||||||||
| User-defined keywords | |||||||||||||||||||||||||||||||||||||||||
| Estimated Impact | 289 | ||||||||||||||||||||||||||||||||||||||||
Tree of Dependent Computations | |||||||||||||||||||||||||||||||||||||||||
| Family? (F = Feedback message, R = changed R code, M = changed R Module, P = changed Parameters, D = changed Data) | |||||||||||||||||||||||||||||||||||||||||
| - [Pearson Correlation] [Correlation: inve...] [2008-12-16 19:18:46] [5161246d1ccc1b670cc664d03050f084] - RMPD [Univariate Data Series] [] [2008-12-17 14:56:45] [b98453cac15ba1066b407e146608df68] - PD [Univariate Data Series] [] [2008-12-17 17:58:54] [d76b387543b13b5e3afd8ff9e5fdc89f] [Current] | |||||||||||||||||||||||||||||||||||||||||
| Feedback Forum | |||||||||||||||||||||||||||||||||||||||||
Post a new message | |||||||||||||||||||||||||||||||||||||||||
Dataset | |||||||||||||||||||||||||||||||||||||||||
| Dataseries X: | |||||||||||||||||||||||||||||||||||||||||
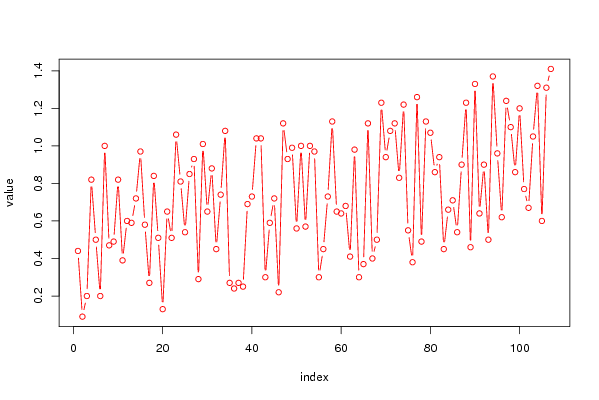
0.44 0.09 0.2 0.82 0.5 0.2 1 0.47 0.49 0.82 0.39 0.6 0.59 0.72 0.97 0.58 0.27 0.84 0.51 0.13 0.65 0.51 1.06 0.81 0.54 0.85 0.93 0.29 1.01 0.65 0.88 0.45 0.74 1.08 0.27 0.24 0.27 0.25 0.69 0.73 1.04 1.04 0.3 0.59 0.72 0.22 1.12 0.93 0.99 0.56 1 0.57 1 0.97 0.3 0.45 0.73 1.13 0.65 0.64 0.68 0.41 0.98 0.3 0.37 1.12 0.4 0.5 1.23 0.94 1.08 1.12 0.83 1.22 0.55 0.38 1.26 0.49 1.13 1.07 0.86 0.94 0.45 0.66 0.71 0.54 0.9 1.23 0.46 1.33 0.64 0.9 0.5 1.37 0.96 0.62 1.24 1.1 0.86 1.2 0.77 0.67 1.05 1.32 0.6 1.31 1.41 | |||||||||||||||||||||||||||||||||||||||||
Tables (Output of Computation) | |||||||||||||||||||||||||||||||||||||||||
| |||||||||||||||||||||||||||||||||||||||||
Figures (Output of Computation) | |||||||||||||||||||||||||||||||||||||||||
Input Parameters & R Code | |||||||||||||||||||||||||||||||||||||||||
| Parameters (Session): | |||||||||||||||||||||||||||||||||||||||||
| par1 = Exogenous variable ; | |||||||||||||||||||||||||||||||||||||||||
| Parameters (R input): | |||||||||||||||||||||||||||||||||||||||||
| par1 = Exogenous variable ; par2 = ; par3 = ; | |||||||||||||||||||||||||||||||||||||||||
| R code (references can be found in the software module): | |||||||||||||||||||||||||||||||||||||||||
bitmap(file='test1.png') | |||||||||||||||||||||||||||||||||||||||||