Free Statistics

of Irreproducible Research!

Author's title

Author*The author of this computation has been verified*
R Software Modulerwasp_arimabackwardselection.wasp
Title produced by softwareARIMA Backward Selection
Date of computationWed, 17 Dec 2008 08:48:37 -0700
Cite this page as followsStatistical Computations at FreeStatistics.org, Office for Research Development and Education, URL https://freestatistics.org/blog/index.php?v=date/2008/Dec/17/t12295291347y4zsnrgoejyg6t.htm/, Retrieved Sun, 19 May 2024 05:10:54 +0000
Statistical Computations at FreeStatistics.org, Office for Research Development and Education, URL https://freestatistics.org/blog/index.php?pk=34421, Retrieved Sun, 19 May 2024 05:10:54 +0000
QR Codes:

Original text written by user:
IsPrivate?No (this computation is public)
User-defined keywords
Estimated Impact228
Family? (F = Feedback message, R = changed R code, M = changed R Module, P = changed Parameters, D = changed Data)
-     [Univariate Data Series] [Totale Invoer naa...] [2008-12-07 13:03:47] [299afd6311e4c20059ea2f05c8dd029d]
- RMP   [Standard Deviation-Mean Plot] [Totale Invoer - SMP] [2008-12-17 15:42:54] [299afd6311e4c20059ea2f05c8dd029d]
- RMP       [ARIMA Backward Selection] [Totale Invoer - ABS] [2008-12-17 15:48:37] [5e2b1e7aa808f9f0d23fd35605d4968f] [Current]
Feedback Forum

Post a new message
Dataseries X:
13429.9
13470.1
14785.8
14292
14308.8
14013
13240.9
12153.4
14289.7
15669.2
14169.5
14569.8
14469.1
14264.9
15320.9
14433.5
13691.5
14194.1
13519.2
11857.9
14616
15643.4
14077.2
14887.5
14159.9
14643
17192.5
15386.1
14287.1
17526.6
14497
14398.3
16629.6
16670.7
16614.8
16869.2
15663.9
16359.9
18447.7
16889
16505
18320.9
15052.1
15699.8
18135.3
16768.7
18883
19021
18101.9
17776.1
21489.9
17065.3
18690
18953.1
16398.9
16895.7
18553
19270
19422.1
17579.4
18637.3
18076.7
20438.6
18075.2
19563
19899.2
19227.5
17789.6
19220.8
21968.9
21131.5
19484.6


Summary of computational transaction
Raw Inputview raw input (R code)
Raw Outputview raw output of R engine
Computing time22 seconds
R Server'Herman Ole Andreas Wold' @ 193.190.124.10:1001

\begin{tabular}{lllllllll}
\hline
Summary of computational transaction \tabularnewline
Raw Input & view raw input (R code)  \tabularnewline
Raw Output & view raw output of R engine  \tabularnewline
Computing time & 22 seconds \tabularnewline
R Server & 'Herman Ole Andreas Wold' @ 193.190.124.10:1001 \tabularnewline
\hline
\end{tabular}
%Source: https://freestatistics.org/blog/index.php?pk=34421&T=0

[TABLE]
[ROW][C]Summary of computational transaction[/C][/ROW]
[ROW][C]Raw Input[/C][C]view raw input (R code) [/C][/ROW]
[ROW][C]Raw Output[/C][C]view raw output of R engine [/C][/ROW]
[ROW][C]Computing time[/C][C]22 seconds[/C][/ROW]
[ROW][C]R Server[/C][C]'Herman Ole Andreas Wold' @ 193.190.124.10:1001[/C][/ROW]
[/TABLE]
Source: https://freestatistics.org/blog/index.php?pk=34421&T=0

Globally Unique Identifier (entire table): ba.freestatistics.org/blog/index.php?pk=34421&T=0

As an alternative you can also use a QR Code:  

The GUIDs for individual cells are displayed in the table below:

Summary of computational transaction
Raw Inputview raw input (R code)
Raw Outputview raw output of R engine
Computing time22 seconds
R Server'Herman Ole Andreas Wold' @ 193.190.124.10:1001


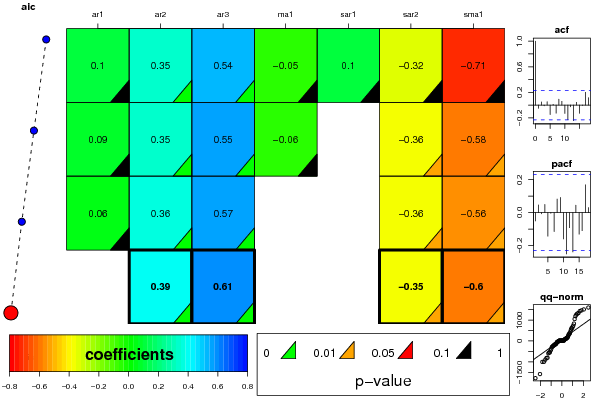
ARIMA Parameter Estimation and Backward Selection
Iterationar1ar2ar3ma1sar1sar2sma1
Estimates ( 1 )0.10460.35020.5417-0.05260.0985-0.3216-0.7119
(p-val)(0.5675 )(0.0032 )(4e-04 )(0.7986 )(0.8266 )(0.1804 )(0.3574 )
Estimates ( 2 )0.09260.34910.5524-0.05690-0.3576-0.5763
(p-val)(0.5832 )(0.0026 )(1e-04 )(0.7763 )(NA )(0.0306 )(0.0247 )
Estimates ( 3 )0.05880.36260.571400-0.3642-0.555
(p-val)(0.6013 )(5e-04 )(0 )(NA )(NA )(0.0245 )(0.0214 )
Estimates ( 4 )00.38840.605800-0.355-0.601
(p-val)(NA )(0 )(0 )(NA )(NA )(0.0288 )(0.0138 )
Estimates ( 5 )NANANANANANANA
(p-val)(NA )(NA )(NA )(NA )(NA )(NA )(NA )
Estimates ( 6 )NANANANANANANA
(p-val)(NA )(NA )(NA )(NA )(NA )(NA )(NA )
Estimates ( 7 )NANANANANANANA
(p-val)(NA )(NA )(NA )(NA )(NA )(NA )(NA )
Estimates ( 8 )NANANANANANANA
(p-val)(NA )(NA )(NA )(NA )(NA )(NA )(NA )
Estimates ( 9 )NANANANANANANA
(p-val)(NA )(NA )(NA )(NA )(NA )(NA )(NA )
Estimates ( 10 )NANANANANANANA
(p-val)(NA )(NA )(NA )(NA )(NA )(NA )(NA )
Estimates ( 11 )NANANANANANANA
(p-val)(NA )(NA )(NA )(NA )(NA )(NA )(NA )
Estimates ( 12 )NANANANANANANA
(p-val)(NA )(NA )(NA )(NA )(NA )(NA )(NA )
Estimates ( 13 )NANANANANANANA
(p-val)(NA )(NA )(NA )(NA )(NA )(NA )(NA )

\begin{tabular}{lllllllll}
\hline
ARIMA Parameter Estimation and Backward Selection \tabularnewline
Iteration & ar1 & ar2 & ar3 & ma1 & sar1 & sar2 & sma1 \tabularnewline
Estimates ( 1 ) & 0.1046 & 0.3502 & 0.5417 & -0.0526 & 0.0985 & -0.3216 & -0.7119 \tabularnewline
(p-val) & (0.5675 ) & (0.0032 ) & (4e-04 ) & (0.7986 ) & (0.8266 ) & (0.1804 ) & (0.3574 ) \tabularnewline
Estimates ( 2 ) & 0.0926 & 0.3491 & 0.5524 & -0.0569 & 0 & -0.3576 & -0.5763 \tabularnewline
(p-val) & (0.5832 ) & (0.0026 ) & (1e-04 ) & (0.7763 ) & (NA ) & (0.0306 ) & (0.0247 ) \tabularnewline
Estimates ( 3 ) & 0.0588 & 0.3626 & 0.5714 & 0 & 0 & -0.3642 & -0.555 \tabularnewline
(p-val) & (0.6013 ) & (5e-04 ) & (0 ) & (NA ) & (NA ) & (0.0245 ) & (0.0214 ) \tabularnewline
Estimates ( 4 ) & 0 & 0.3884 & 0.6058 & 0 & 0 & -0.355 & -0.601 \tabularnewline
(p-val) & (NA ) & (0 ) & (0 ) & (NA ) & (NA ) & (0.0288 ) & (0.0138 ) \tabularnewline
Estimates ( 5 ) & NA & NA & NA & NA & NA & NA & NA \tabularnewline
(p-val) & (NA ) & (NA ) & (NA ) & (NA ) & (NA ) & (NA ) & (NA ) \tabularnewline
Estimates ( 6 ) & NA & NA & NA & NA & NA & NA & NA \tabularnewline
(p-val) & (NA ) & (NA ) & (NA ) & (NA ) & (NA ) & (NA ) & (NA ) \tabularnewline
Estimates ( 7 ) & NA & NA & NA & NA & NA & NA & NA \tabularnewline
(p-val) & (NA ) & (NA ) & (NA ) & (NA ) & (NA ) & (NA ) & (NA ) \tabularnewline
Estimates ( 8 ) & NA & NA & NA & NA & NA & NA & NA \tabularnewline
(p-val) & (NA ) & (NA ) & (NA ) & (NA ) & (NA ) & (NA ) & (NA ) \tabularnewline
Estimates ( 9 ) & NA & NA & NA & NA & NA & NA & NA \tabularnewline
(p-val) & (NA ) & (NA ) & (NA ) & (NA ) & (NA ) & (NA ) & (NA ) \tabularnewline
Estimates ( 10 ) & NA & NA & NA & NA & NA & NA & NA \tabularnewline
(p-val) & (NA ) & (NA ) & (NA ) & (NA ) & (NA ) & (NA ) & (NA ) \tabularnewline
Estimates ( 11 ) & NA & NA & NA & NA & NA & NA & NA \tabularnewline
(p-val) & (NA ) & (NA ) & (NA ) & (NA ) & (NA ) & (NA ) & (NA ) \tabularnewline
Estimates ( 12 ) & NA & NA & NA & NA & NA & NA & NA \tabularnewline
(p-val) & (NA ) & (NA ) & (NA ) & (NA ) & (NA ) & (NA ) & (NA ) \tabularnewline
Estimates ( 13 ) & NA & NA & NA & NA & NA & NA & NA \tabularnewline
(p-val) & (NA ) & (NA ) & (NA ) & (NA ) & (NA ) & (NA ) & (NA ) \tabularnewline
\hline
\end{tabular}
%Source: https://freestatistics.org/blog/index.php?pk=34421&T=1

[TABLE]
[ROW][C]ARIMA Parameter Estimation and Backward Selection[/C][/ROW]
[ROW][C]Iteration[/C][C]ar1[/C][C]ar2[/C][C]ar3[/C][C]ma1[/C][C]sar1[/C][C]sar2[/C][C]sma1[/C][/ROW]
[ROW][C]Estimates ( 1 )[/C][C]0.1046[/C][C]0.3502[/C][C]0.5417[/C][C]-0.0526[/C][C]0.0985[/C][C]-0.3216[/C][C]-0.7119[/C][/ROW]
[ROW][C](p-val)[/C][C](0.5675 )[/C][C](0.0032 )[/C][C](4e-04 )[/C][C](0.7986 )[/C][C](0.8266 )[/C][C](0.1804 )[/C][C](0.3574 )[/C][/ROW]
[ROW][C]Estimates ( 2 )[/C][C]0.0926[/C][C]0.3491[/C][C]0.5524[/C][C]-0.0569[/C][C]0[/C][C]-0.3576[/C][C]-0.5763[/C][/ROW]
[ROW][C](p-val)[/C][C](0.5832 )[/C][C](0.0026 )[/C][C](1e-04 )[/C][C](0.7763 )[/C][C](NA )[/C][C](0.0306 )[/C][C](0.0247 )[/C][/ROW]
[ROW][C]Estimates ( 3 )[/C][C]0.0588[/C][C]0.3626[/C][C]0.5714[/C][C]0[/C][C]0[/C][C]-0.3642[/C][C]-0.555[/C][/ROW]
[ROW][C](p-val)[/C][C](0.6013 )[/C][C](5e-04 )[/C][C](0 )[/C][C](NA )[/C][C](NA )[/C][C](0.0245 )[/C][C](0.0214 )[/C][/ROW]
[ROW][C]Estimates ( 4 )[/C][C]0[/C][C]0.3884[/C][C]0.6058[/C][C]0[/C][C]0[/C][C]-0.355[/C][C]-0.601[/C][/ROW]
[ROW][C](p-val)[/C][C](NA )[/C][C](0 )[/C][C](0 )[/C][C](NA )[/C][C](NA )[/C][C](0.0288 )[/C][C](0.0138 )[/C][/ROW]
[ROW][C]Estimates ( 5 )[/C][C]NA[/C][C]NA[/C][C]NA[/C][C]NA[/C][C]NA[/C][C]NA[/C][C]NA[/C][/ROW]
[ROW][C](p-val)[/C][C](NA )[/C][C](NA )[/C][C](NA )[/C][C](NA )[/C][C](NA )[/C][C](NA )[/C][C](NA )[/C][/ROW]
[ROW][C]Estimates ( 6 )[/C][C]NA[/C][C]NA[/C][C]NA[/C][C]NA[/C][C]NA[/C][C]NA[/C][C]NA[/C][/ROW]
[ROW][C](p-val)[/C][C](NA )[/C][C](NA )[/C][C](NA )[/C][C](NA )[/C][C](NA )[/C][C](NA )[/C][C](NA )[/C][/ROW]
[ROW][C]Estimates ( 7 )[/C][C]NA[/C][C]NA[/C][C]NA[/C][C]NA[/C][C]NA[/C][C]NA[/C][C]NA[/C][/ROW]
[ROW][C](p-val)[/C][C](NA )[/C][C](NA )[/C][C](NA )[/C][C](NA )[/C][C](NA )[/C][C](NA )[/C][C](NA )[/C][/ROW]
[ROW][C]Estimates ( 8 )[/C][C]NA[/C][C]NA[/C][C]NA[/C][C]NA[/C][C]NA[/C][C]NA[/C][C]NA[/C][/ROW]
[ROW][C](p-val)[/C][C](NA )[/C][C](NA )[/C][C](NA )[/C][C](NA )[/C][C](NA )[/C][C](NA )[/C][C](NA )[/C][/ROW]
[ROW][C]Estimates ( 9 )[/C][C]NA[/C][C]NA[/C][C]NA[/C][C]NA[/C][C]NA[/C][C]NA[/C][C]NA[/C][/ROW]
[ROW][C](p-val)[/C][C](NA )[/C][C](NA )[/C][C](NA )[/C][C](NA )[/C][C](NA )[/C][C](NA )[/C][C](NA )[/C][/ROW]
[ROW][C]Estimates ( 10 )[/C][C]NA[/C][C]NA[/C][C]NA[/C][C]NA[/C][C]NA[/C][C]NA[/C][C]NA[/C][/ROW]
[ROW][C](p-val)[/C][C](NA )[/C][C](NA )[/C][C](NA )[/C][C](NA )[/C][C](NA )[/C][C](NA )[/C][C](NA )[/C][/ROW]
[ROW][C]Estimates ( 11 )[/C][C]NA[/C][C]NA[/C][C]NA[/C][C]NA[/C][C]NA[/C][C]NA[/C][C]NA[/C][/ROW]
[ROW][C](p-val)[/C][C](NA )[/C][C](NA )[/C][C](NA )[/C][C](NA )[/C][C](NA )[/C][C](NA )[/C][C](NA )[/C][/ROW]
[ROW][C]Estimates ( 12 )[/C][C]NA[/C][C]NA[/C][C]NA[/C][C]NA[/C][C]NA[/C][C]NA[/C][C]NA[/C][/ROW]
[ROW][C](p-val)[/C][C](NA )[/C][C](NA )[/C][C](NA )[/C][C](NA )[/C][C](NA )[/C][C](NA )[/C][C](NA )[/C][/ROW]
[ROW][C]Estimates ( 13 )[/C][C]NA[/C][C]NA[/C][C]NA[/C][C]NA[/C][C]NA[/C][C]NA[/C][C]NA[/C][/ROW]
[ROW][C](p-val)[/C][C](NA )[/C][C](NA )[/C][C](NA )[/C][C](NA )[/C][C](NA )[/C][C](NA )[/C][C](NA )[/C][/ROW]
[/TABLE]
Source: https://freestatistics.org/blog/index.php?pk=34421&T=1

Globally Unique Identifier (entire table): ba.freestatistics.org/blog/index.php?pk=34421&T=1

As an alternative you can also use a QR Code:  

The GUIDs for individual cells are displayed in the table below:

ARIMA Parameter Estimation and Backward Selection
Iterationar1ar2ar3ma1sar1sar2sma1
Estimates ( 1 )0.10460.35020.5417-0.05260.0985-0.3216-0.7119
(p-val)(0.5675 )(0.0032 )(4e-04 )(0.7986 )(0.8266 )(0.1804 )(0.3574 )
Estimates ( 2 )0.09260.34910.5524-0.05690-0.3576-0.5763
(p-val)(0.5832 )(0.0026 )(1e-04 )(0.7763 )(NA )(0.0306 )(0.0247 )
Estimates ( 3 )0.05880.36260.571400-0.3642-0.555
(p-val)(0.6013 )(5e-04 )(0 )(NA )(NA )(0.0245 )(0.0214 )
Estimates ( 4 )00.38840.605800-0.355-0.601
(p-val)(NA )(0 )(0 )(NA )(NA )(0.0288 )(0.0138 )
Estimates ( 5 )NANANANANANANA
(p-val)(NA )(NA )(NA )(NA )(NA )(NA )(NA )
Estimates ( 6 )NANANANANANANA
(p-val)(NA )(NA )(NA )(NA )(NA )(NA )(NA )
Estimates ( 7 )NANANANANANANA
(p-val)(NA )(NA )(NA )(NA )(NA )(NA )(NA )
Estimates ( 8 )NANANANANANANA
(p-val)(NA )(NA )(NA )(NA )(NA )(NA )(NA )
Estimates ( 9 )NANANANANANANA
(p-val)(NA )(NA )(NA )(NA )(NA )(NA )(NA )
Estimates ( 10 )NANANANANANANA
(p-val)(NA )(NA )(NA )(NA )(NA )(NA )(NA )
Estimates ( 11 )NANANANANANANA
(p-val)(NA )(NA )(NA )(NA )(NA )(NA )(NA )
Estimates ( 12 )NANANANANANANA
(p-val)(NA )(NA )(NA )(NA )(NA )(NA )(NA )
Estimates ( 13 )NANANANANANANA
(p-val)(NA )(NA )(NA )(NA )(NA )(NA )(NA )


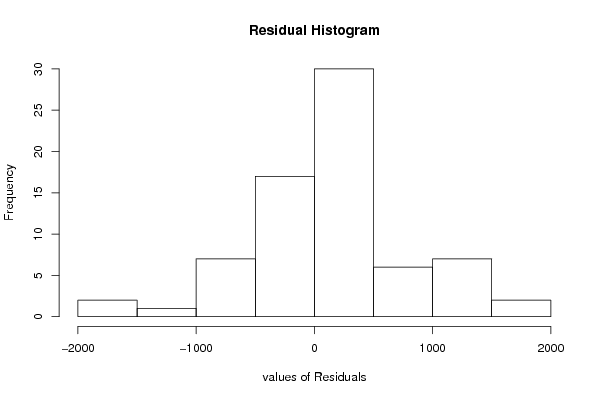
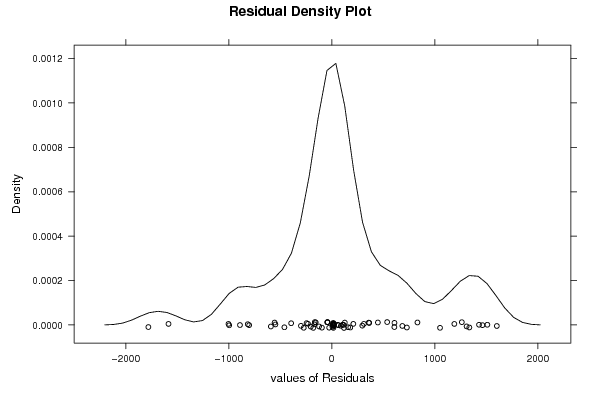
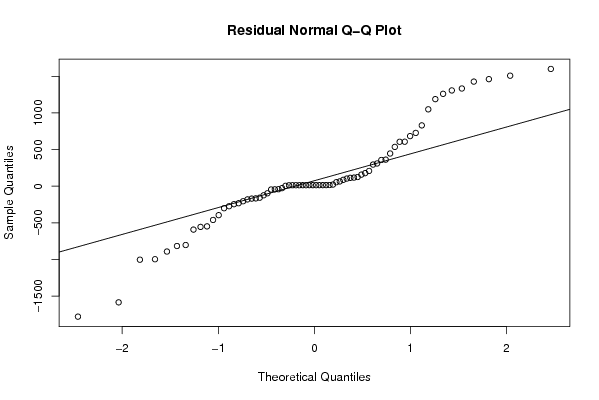
Estimated ARIMA Residuals
Value
14.5692089577446
446.583505390228
54.6794197684727
-180.462662803515
-592.962243168658
-1004.19446645087
-96.9564501725516
358.074515603965
14.1877772832864
125.361258534040
-42.9242391869645
5.24588162465908
114.326421018904
-169.719402031420
310.735873240266
1462.32424264962
606.703160730394
-556.035624587768
1601.71311839331
157.64216677199
830.837313434202
-245.540101479315
-461.176280931299
295.505922922234
362.808769267779
-166.386914231188
-300.679857506436
65.4383260924567
-41.4698530459524
-26.2187749903875
104.174870691245
-892.699652510858
87.0936441895191
684.478231807493
-997.43100913406
1050.23760697876
1308.14412342000
1189.33659227270
-803.429219496715
1509.66000141754
-1586.73068324852
117.378876489404
-548.577340422552
-45.2127264636842
21.9880660825776
-273.384697498406
536.643111712453
208.227388388746
-1782.19162917553
-395.531666475656
-157.25320564969
178.343466782302
-232.21033045338
1334.78503225511
607.598748375727
1428.90950089017
-205.405962573723
-817.147034527263
727.92630574489
1261.86425673996
-124.352534113192

\begin{tabular}{lllllllll}
\hline
Estimated ARIMA Residuals \tabularnewline
Value \tabularnewline
14.5692089577446 \tabularnewline
446.583505390228 \tabularnewline
54.6794197684727 \tabularnewline
-180.462662803515 \tabularnewline
-592.962243168658 \tabularnewline
-1004.19446645087 \tabularnewline
-96.9564501725516 \tabularnewline
358.074515603965 \tabularnewline
14.1877772832864 \tabularnewline
125.361258534040 \tabularnewline
-42.9242391869645 \tabularnewline
5.24588162465908 \tabularnewline
114.326421018904 \tabularnewline
-169.719402031420 \tabularnewline
310.735873240266 \tabularnewline
1462.32424264962 \tabularnewline
606.703160730394 \tabularnewline
-556.035624587768 \tabularnewline
1601.71311839331 \tabularnewline
157.64216677199 \tabularnewline
830.837313434202 \tabularnewline
-245.540101479315 \tabularnewline
-461.176280931299 \tabularnewline
295.505922922234 \tabularnewline
362.808769267779 \tabularnewline
-166.386914231188 \tabularnewline
-300.679857506436 \tabularnewline
65.4383260924567 \tabularnewline
-41.4698530459524 \tabularnewline
-26.2187749903875 \tabularnewline
104.174870691245 \tabularnewline
-892.699652510858 \tabularnewline
87.0936441895191 \tabularnewline
684.478231807493 \tabularnewline
-997.43100913406 \tabularnewline
1050.23760697876 \tabularnewline
1308.14412342000 \tabularnewline
1189.33659227270 \tabularnewline
-803.429219496715 \tabularnewline
1509.66000141754 \tabularnewline
-1586.73068324852 \tabularnewline
117.378876489404 \tabularnewline
-548.577340422552 \tabularnewline
-45.2127264636842 \tabularnewline
21.9880660825776 \tabularnewline
-273.384697498406 \tabularnewline
536.643111712453 \tabularnewline
208.227388388746 \tabularnewline
-1782.19162917553 \tabularnewline
-395.531666475656 \tabularnewline
-157.25320564969 \tabularnewline
178.343466782302 \tabularnewline
-232.21033045338 \tabularnewline
1334.78503225511 \tabularnewline
607.598748375727 \tabularnewline
1428.90950089017 \tabularnewline
-205.405962573723 \tabularnewline
-817.147034527263 \tabularnewline
727.92630574489 \tabularnewline
1261.86425673996 \tabularnewline
-124.352534113192 \tabularnewline
\hline
\end{tabular}
%Source: https://freestatistics.org/blog/index.php?pk=34421&T=2

[TABLE]
[ROW][C]Estimated ARIMA Residuals[/C][/ROW]
[ROW][C]Value[/C][/ROW]
[ROW][C]14.5692089577446[/C][/ROW]
[ROW][C]446.583505390228[/C][/ROW]
[ROW][C]54.6794197684727[/C][/ROW]
[ROW][C]-180.462662803515[/C][/ROW]
[ROW][C]-592.962243168658[/C][/ROW]
[ROW][C]-1004.19446645087[/C][/ROW]
[ROW][C]-96.9564501725516[/C][/ROW]
[ROW][C]358.074515603965[/C][/ROW]
[ROW][C]14.1877772832864[/C][/ROW]
[ROW][C]125.361258534040[/C][/ROW]
[ROW][C]-42.9242391869645[/C][/ROW]
[ROW][C]5.24588162465908[/C][/ROW]
[ROW][C]114.326421018904[/C][/ROW]
[ROW][C]-169.719402031420[/C][/ROW]
[ROW][C]310.735873240266[/C][/ROW]
[ROW][C]1462.32424264962[/C][/ROW]
[ROW][C]606.703160730394[/C][/ROW]
[ROW][C]-556.035624587768[/C][/ROW]
[ROW][C]1601.71311839331[/C][/ROW]
[ROW][C]157.64216677199[/C][/ROW]
[ROW][C]830.837313434202[/C][/ROW]
[ROW][C]-245.540101479315[/C][/ROW]
[ROW][C]-461.176280931299[/C][/ROW]
[ROW][C]295.505922922234[/C][/ROW]
[ROW][C]362.808769267779[/C][/ROW]
[ROW][C]-166.386914231188[/C][/ROW]
[ROW][C]-300.679857506436[/C][/ROW]
[ROW][C]65.4383260924567[/C][/ROW]
[ROW][C]-41.4698530459524[/C][/ROW]
[ROW][C]-26.2187749903875[/C][/ROW]
[ROW][C]104.174870691245[/C][/ROW]
[ROW][C]-892.699652510858[/C][/ROW]
[ROW][C]87.0936441895191[/C][/ROW]
[ROW][C]684.478231807493[/C][/ROW]
[ROW][C]-997.43100913406[/C][/ROW]
[ROW][C]1050.23760697876[/C][/ROW]
[ROW][C]1308.14412342000[/C][/ROW]
[ROW][C]1189.33659227270[/C][/ROW]
[ROW][C]-803.429219496715[/C][/ROW]
[ROW][C]1509.66000141754[/C][/ROW]
[ROW][C]-1586.73068324852[/C][/ROW]
[ROW][C]117.378876489404[/C][/ROW]
[ROW][C]-548.577340422552[/C][/ROW]
[ROW][C]-45.2127264636842[/C][/ROW]
[ROW][C]21.9880660825776[/C][/ROW]
[ROW][C]-273.384697498406[/C][/ROW]
[ROW][C]536.643111712453[/C][/ROW]
[ROW][C]208.227388388746[/C][/ROW]
[ROW][C]-1782.19162917553[/C][/ROW]
[ROW][C]-395.531666475656[/C][/ROW]
[ROW][C]-157.25320564969[/C][/ROW]
[ROW][C]178.343466782302[/C][/ROW]
[ROW][C]-232.21033045338[/C][/ROW]
[ROW][C]1334.78503225511[/C][/ROW]
[ROW][C]607.598748375727[/C][/ROW]
[ROW][C]1428.90950089017[/C][/ROW]
[ROW][C]-205.405962573723[/C][/ROW]
[ROW][C]-817.147034527263[/C][/ROW]
[ROW][C]727.92630574489[/C][/ROW]
[ROW][C]1261.86425673996[/C][/ROW]
[ROW][C]-124.352534113192[/C][/ROW]
[/TABLE]
Source: https://freestatistics.org/blog/index.php?pk=34421&T=2

Globally Unique Identifier (entire table): ba.freestatistics.org/blog/index.php?pk=34421&T=2

As an alternative you can also use a QR Code:  

The GUIDs for individual cells are displayed in the table below:

Estimated ARIMA Residuals
Value
14.5692089577446
446.583505390228
54.6794197684727
-180.462662803515
-592.962243168658
-1004.19446645087
-96.9564501725516
358.074515603965
14.1877772832864
125.361258534040
-42.9242391869645
5.24588162465908
114.326421018904
-169.719402031420
310.735873240266
1462.32424264962
606.703160730394
-556.035624587768
1601.71311839331
157.64216677199
830.837313434202
-245.540101479315
-461.176280931299
295.505922922234
362.808769267779
-166.386914231188
-300.679857506436
65.4383260924567
-41.4698530459524
-26.2187749903875
104.174870691245
-892.699652510858
87.0936441895191
684.478231807493
-997.43100913406
1050.23760697876
1308.14412342000
1189.33659227270
-803.429219496715
1509.66000141754
-1586.73068324852
117.378876489404
-548.577340422552
-45.2127264636842
21.9880660825776
-273.384697498406
536.643111712453
208.227388388746
-1782.19162917553
-395.531666475656
-157.25320564969
178.343466782302
-232.21033045338
1334.78503225511
607.598748375727
1428.90950089017
-205.405962573723
-817.147034527263
727.92630574489
1261.86425673996
-124.352534113192


Parameters (Session):
par1 = FALSE ; par2 = 1 ; par3 = 0 ; par4 = 1 ; par5 = 12 ; par6 = 3 ; par7 = 1 ; par8 = 2 ; par9 = 1 ;
Parameters (R input):
par1 = FALSE ; par2 = 1 ; par3 = 0 ; par4 = 1 ; par5 = 12 ; par6 = 3 ; par7 = 1 ; par8 = 2 ; par9 = 1 ;
R code (references can be found in the software module):
library(lattice)
if (par1 == 'TRUE') par1 <- TRUE
if (par1 == 'FALSE') par1 <- FALSE
par2 <- as.numeric(par2) #Box-Cox lambda transformation parameter
par3 <- as.numeric(par3) #degree of non-seasonal differencing
par4 <- as.numeric(par4) #degree of seasonal differencing
par5 <- as.numeric(par5) #seasonal period
par6 <- as.numeric(par6) #degree (p) of the non-seasonal AR(p) polynomial
par7 <- as.numeric(par7) #degree (q) of the non-seasonal MA(q) polynomial
par8 <- as.numeric(par8) #degree (P) of the seasonal AR(P) polynomial
par9 <- as.numeric(par9) #degree (Q) of the seasonal MA(Q) polynomial
armaGR <- function(arima.out, names, n){
try1 <- arima.out$coef
try2 <- sqrt(diag(arima.out$var.coef))
try.data.frame <- data.frame(matrix(NA,ncol=4,nrow=length(names)))
dimnames(try.data.frame) <- list(names,c('coef','std','tstat','pv'))
try.data.frame[,1] <- try1
for(i in 1:length(try2)) try.data.frame[which(rownames(try.data.frame)==names(try2)[i]),2] <- try2[i]
try.data.frame[,3] <- try.data.frame[,1] / try.data.frame[,2]
try.data.frame[,4] <- round((1-pt(abs(try.data.frame[,3]),df=n-(length(try2)+1)))*2,5)
vector <- rep(NA,length(names))
vector[is.na(try.data.frame[,4])] <- 0
maxi <- which.max(try.data.frame[,4])
continue <- max(try.data.frame[,4],na.rm=TRUE) > .05
vector[maxi] <- 0
list(summary=try.data.frame,next.vector=vector,continue=continue)
}
arimaSelect <- function(series, order=c(13,0,0), seasonal=list(order=c(2,0,0),period=12), include.mean=F){
nrc <- order[1]+order[3]+seasonal$order[1]+seasonal$order[3]
coeff <- matrix(NA, nrow=nrc*2, ncol=nrc)
pval <- matrix(NA, nrow=nrc*2, ncol=nrc)
mylist <- rep(list(NULL), nrc)
names <- NULL
if(order[1] > 0) names <- paste('ar',1:order[1],sep='')
if(order[3] > 0) names <- c( names , paste('ma',1:order[3],sep='') )
if(seasonal$order[1] > 0) names <- c(names, paste('sar',1:seasonal$order[1],sep=''))
if(seasonal$order[3] > 0) names <- c(names, paste('sma',1:seasonal$order[3],sep=''))
arima.out <- arima(series, order=order, seasonal=seasonal, include.mean=include.mean, method='ML')
mylist[[1]] <- arima.out
last.arma <- armaGR(arima.out, names, length(series))
mystop <- FALSE
i <- 1
coeff[i,] <- last.arma[[1]][,1]
pval [i,] <- last.arma[[1]][,4]
i <- 2
aic <- arima.out$aic
while(!mystop){
mylist[[i]] <- arima.out
arima.out <- arima(series, order=order, seasonal=seasonal, include.mean=include.mean, method='ML', fixed=last.arma$next.vector)
aic <- c(aic, arima.out$aic)
last.arma <- armaGR(arima.out, names, length(series))
mystop <- !last.arma$continue
coeff[i,] <- last.arma[[1]][,1]
pval [i,] <- last.arma[[1]][,4]
i <- i+1
}
list(coeff, pval, mylist, aic=aic)
}
arimaSelectplot <- function(arimaSelect.out,noms,choix){
noms <- names(arimaSelect.out[[3]][[1]]$coef)
coeff <- arimaSelect.out[[1]]
k <- min(which(is.na(coeff[,1])))-1
coeff <- coeff[1:k,]
pval <- arimaSelect.out[[2]][1:k,]
aic <- arimaSelect.out$aic[1:k]
coeff[coeff==0] <- NA
n <- ncol(coeff)
if(missing(choix)) choix <- k
layout(matrix(c(1,1,1,2,
3,3,3,2,
3,3,3,4,
5,6,7,7),nr=4),
widths=c(10,35,45,15),
heights=c(30,30,15,15))
couleurs <- rainbow(75)[1:50]#(50)
ticks <- pretty(coeff)
par(mar=c(1,1,3,1))
plot(aic,k:1-.5,type='o',pch=21,bg='blue',cex=2,axes=F,lty=2,xpd=NA)
points(aic[choix],k-choix+.5,pch=21,cex=4,bg=2,xpd=NA)
title('aic',line=2)
par(mar=c(3,0,0,0))
plot(0,axes=F,xlab='',ylab='',xlim=range(ticks),ylim=c(.1,1))
rect(xleft = min(ticks) + (0:49)/50*(max(ticks)-min(ticks)),
xright = min(ticks) + (1:50)/50*(max(ticks)-min(ticks)),
ytop = rep(1,50),
ybottom= rep(0,50),col=couleurs,border=NA)
axis(1,ticks)
rect(xleft=min(ticks),xright=max(ticks),ytop=1,ybottom=0)
text(mean(coeff,na.rm=T),.5,'coefficients',cex=2,font=2)
par(mar=c(1,1,3,1))
image(1:n,1:k,t(coeff[k:1,]),axes=F,col=couleurs,zlim=range(ticks))
for(i in 1:n) for(j in 1:k) if(!is.na(coeff[j,i])) {
if(pval[j,i]<.01) symb = 'green'
else if( (pval[j,i]<.05) & (pval[j,i]>=.01)) symb = 'orange'
else if( (pval[j,i]<.1) & (pval[j,i]>=.05)) symb = 'red'
else symb = 'black'
polygon(c(i+.5 ,i+.2 ,i+.5 ,i+.5),
c(k-j+0.5,k-j+0.5,k-j+0.8,k-j+0.5),
col=symb)
if(j==choix) {
rect(xleft=i-.5,
xright=i+.5,
ybottom=k-j+1.5,
ytop=k-j+.5,
lwd=4)
text(i,
k-j+1,
round(coeff[j,i],2),
cex=1.2,
font=2)
}
else{
rect(xleft=i-.5,xright=i+.5,ybottom=k-j+1.5,ytop=k-j+.5)
text(i,k-j+1,round(coeff[j,i],2),cex=1.2,font=1)
}
}
axis(3,1:n,noms)
par(mar=c(0.5,0,0,0.5))
plot(0,axes=F,xlab='',ylab='',type='n',xlim=c(0,8),ylim=c(-.2,.8))
cols <- c('green','orange','red','black')
niv <- c('0','0.01','0.05','0.1')
for(i in 0:3){
polygon(c(1+2*i ,1+2*i ,1+2*i-.5 ,1+2*i),
c(.4 ,.7 , .4 , .4),
col=cols[i+1])
text(2*i,0.5,niv[i+1],cex=1.5)
}
text(8,.5,1,cex=1.5)
text(4,0,'p-value',cex=2)
box()
residus <- arimaSelect.out[[3]][[choix]]$res
par(mar=c(1,2,4,1))
acf(residus,main='')
title('acf',line=.5)
par(mar=c(1,2,4,1))
pacf(residus,main='')
title('pacf',line=.5)
par(mar=c(2,2,4,1))
qqnorm(residus,main='')
title('qq-norm',line=.5)
qqline(residus)
residus
}
if (par2 == 0) x <- log(x)
if (par2 != 0) x <- x^par2
(selection <- arimaSelect(x, order=c(par6,par3,par7), seasonal=list(order=c(par8,par4,par9), period=par5)))
bitmap(file='test1.png')
resid <- arimaSelectplot(selection)
dev.off()
resid
bitmap(file='test2.png')
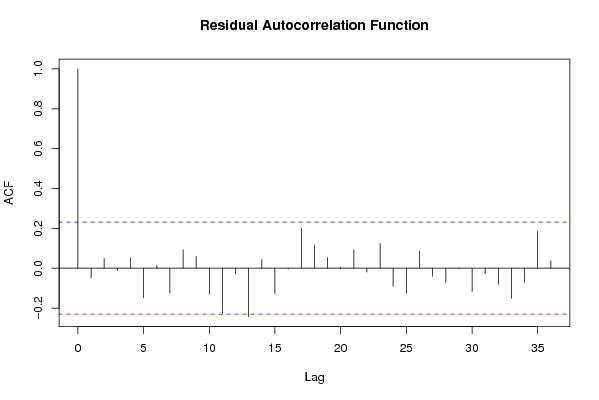
acf(resid,length(resid)/2, main='Residual Autocorrelation Function')
dev.off()
bitmap(file='test3.png')
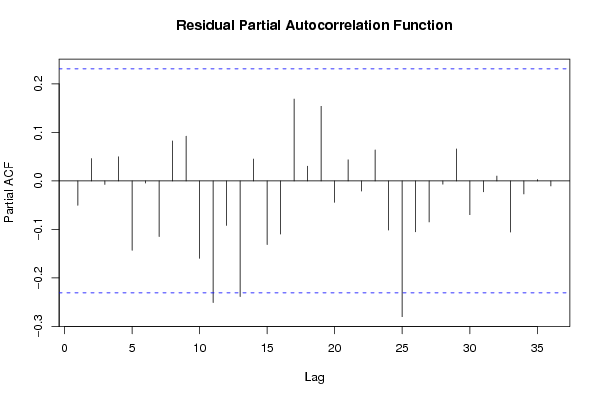
pacf(resid,length(resid)/2, main='Residual Partial Autocorrelation Function')
dev.off()
bitmap(file='test4.png')
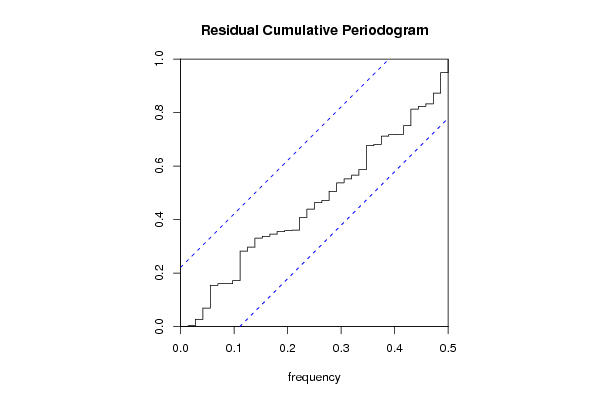
cpgram(resid, main='Residual Cumulative Periodogram')
dev.off()
bitmap(file='test5.png')
hist(resid, main='Residual Histogram', xlab='values of Residuals')
dev.off()
bitmap(file='test6.png')
densityplot(~resid,col='black',main='Residual Density Plot', xlab='values of Residuals')
dev.off()
bitmap(file='test7.png')
qqnorm(resid, main='Residual Normal Q-Q Plot')
qqline(resid)
dev.off()
ncols <- length(selection[[1]][1,])
nrows <- length(selection[[2]][,1])-1
load(file='createtable')
a<-table.start()
a<-table.row.start(a)
a<-table.element(a,'ARIMA Parameter Estimation and Backward Selection', ncols+1,TRUE)
a<-table.row.end(a)
a<-table.row.start(a)
a<-table.element(a,'Iteration', header=TRUE)
for (i in 1:ncols) {
a<-table.element(a,names(selection[[3]][[1]]$coef)[i],header=TRUE)
}
a<-table.row.end(a)
for (j in 1:nrows) {
a<-table.row.start(a)
mydum <- 'Estimates ('
mydum <- paste(mydum,j)
mydum <- paste(mydum,')')
a<-table.element(a,mydum, header=TRUE)
for (i in 1:ncols) {
a<-table.element(a,round(selection[[1]][j,i],4))
}
a<-table.row.end(a)
a<-table.row.start(a)
a<-table.element(a,'(p-val)', header=TRUE)
for (i in 1:ncols) {
mydum <- '('
mydum <- paste(mydum,round(selection[[2]][j,i],4),sep='')
mydum <- paste(mydum,')')
a<-table.element(a,mydum)
}
a<-table.row.end(a)
}
a<-table.end(a)
table.save(a,file='mytable.tab')
a<-table.start()
a<-table.row.start(a)
a<-table.element(a,'Estimated ARIMA Residuals', 1,TRUE)
a<-table.row.end(a)
a<-table.row.start(a)
a<-table.element(a,'Value', 1,TRUE)
a<-table.row.end(a)
for (i in (par4*par5+par3):length(resid)) {
a<-table.row.start(a)
a<-table.element(a,resid[i])
a<-table.row.end(a)
}
a<-table.end(a)
table.save(a,file='mytable1.tab')