Free Statistics

of Irreproducible Research!

Author's title

Author*Unverified author*
R Software Modulerwasp_autocorrelation.wasp
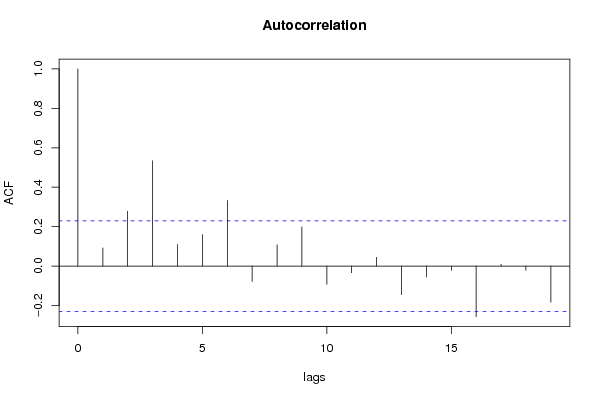
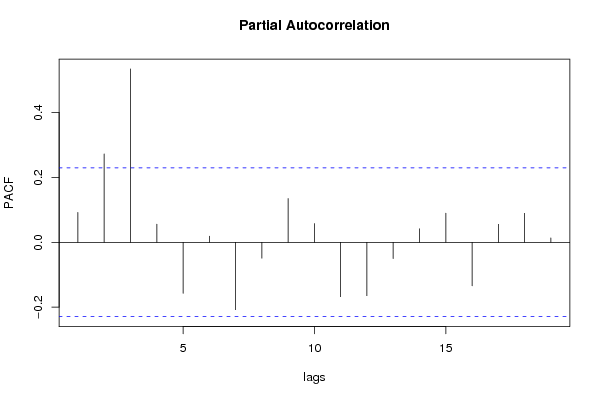
Title produced by software(Partial) Autocorrelation Function
Date of computationWed, 17 Dec 2008 03:36:38 -0700
Cite this page as followsStatistical Computations at FreeStatistics.org, Office for Research Development and Education, URL https://freestatistics.org/blog/index.php?v=date/2008/Dec/17/t1229510250armhaur4rc7ecgi.htm/, Retrieved Sun, 19 May 2024 07:46:36 +0000
Statistical Computations at FreeStatistics.org, Office for Research Development and Education, URL https://freestatistics.org/blog/index.php?pk=34296, Retrieved Sun, 19 May 2024 07:46:36 +0000
QR Codes:

Original text written by user:
IsPrivate?No (this computation is public)
User-defined keywords
Estimated Impact163
Family? (F = Feedback message, R = changed R code, M = changed R Module, P = changed Parameters, D = changed Data)
-       [(Partial) Autocorrelation Function] [PACF paper d=0 D=1] [2008-12-17 10:36:38] [e1dd70d3b1099218056e8ae5041dcc2f] [Current]
-   P     [(Partial) Autocorrelation Function] [autocorrelation f...] [2008-12-17 12:28:16] [74be16979710d4c4e7c6647856088456]
- RMP     [ARIMA Forecasting] [arima forecasting ] [2008-12-17 12:42:38] [11edab5c4db3615abbf782b1c6e7cacf]
Feedback Forum

Post a new message
Dataseries X:
12.5
14.8
15.9
14.8
12.9
14.3
14.2
15.9
15.3
15.5
15.1
15
12.1
15.8
16.9
15.1
13.7
14.8
14.7
16
15.4
15
15.5
15.1
11.7
16.3
16.7
15
14.9
14.6
15.3
17.9
16.4
15.4
17.9
15.9
13.9
17.8
17.9
17.4
16.7
16
16.6
19.1
17.8
17.2
18.6
16.3
15.1
19.2
17.7
19.1
18
17.5
17.8
21.1
17.2
19.4
19.8
17.6
16.2
19.5
19.9
20
17.3
18.9
18.6
21.4
18.6
19.8
20.8
19.6
17.7
19.8
22.2
20.7
17.9
21.2
21.4
21.7
23.2
21.5
22.9
23.2
18.6


Summary of computational transaction
Raw Inputview raw input (R code)
Raw Outputview raw output of R engine
Computing time1 seconds
R Server'Gwilym Jenkins' @ 72.249.127.135

\begin{tabular}{lllllllll}
\hline
Summary of computational transaction \tabularnewline
Raw Input & view raw input (R code)  \tabularnewline
Raw Output & view raw output of R engine  \tabularnewline
Computing time & 1 seconds \tabularnewline
R Server & 'Gwilym Jenkins' @ 72.249.127.135 \tabularnewline
\hline
\end{tabular}
%Source: https://freestatistics.org/blog/index.php?pk=34296&T=0

[TABLE]
[ROW][C]Summary of computational transaction[/C][/ROW]
[ROW][C]Raw Input[/C][C]view raw input (R code) [/C][/ROW]
[ROW][C]Raw Output[/C][C]view raw output of R engine [/C][/ROW]
[ROW][C]Computing time[/C][C]1 seconds[/C][/ROW]
[ROW][C]R Server[/C][C]'Gwilym Jenkins' @ 72.249.127.135[/C][/ROW]
[/TABLE]
Source: https://freestatistics.org/blog/index.php?pk=34296&T=0

Globally Unique Identifier (entire table): ba.freestatistics.org/blog/index.php?pk=34296&T=0

As an alternative you can also use a QR Code:  

The GUIDs for individual cells are displayed in the table below:

Summary of computational transaction
Raw Inputview raw input (R code)
Raw Outputview raw output of R engine
Computing time1 seconds
R Server'Gwilym Jenkins' @ 72.249.127.135


Autocorrelation Function
Time lag kACF(k)T-STATP-value
10.0920020.78610.217187
20.2783592.37830.010006
30.5343434.56541e-05
40.1095580.93610.176164
50.1595721.36340.088476
60.3327982.84340.002893
7-0.078036-0.66670.25352
80.1078220.92120.179983
90.1986411.69720.04696
10-0.092172-0.78750.216763
11-0.033537-0.28650.387639
120.0446640.38160.351931
13-0.144822-1.23740.109959
14-0.055549-0.47460.318241
15-0.021719-0.18560.42665
16-0.256374-2.19050.015843
170.0099180.08470.46635
18-0.021188-0.1810.428421
19-0.182929-1.5630.061195

\begin{tabular}{lllllllll}
\hline
Autocorrelation Function \tabularnewline
Time lag k & ACF(k) & T-STAT & P-value \tabularnewline
1 & 0.092002 & 0.7861 & 0.217187 \tabularnewline
2 & 0.278359 & 2.3783 & 0.010006 \tabularnewline
3 & 0.534343 & 4.5654 & 1e-05 \tabularnewline
4 & 0.109558 & 0.9361 & 0.176164 \tabularnewline
5 & 0.159572 & 1.3634 & 0.088476 \tabularnewline
6 & 0.332798 & 2.8434 & 0.002893 \tabularnewline
7 & -0.078036 & -0.6667 & 0.25352 \tabularnewline
8 & 0.107822 & 0.9212 & 0.179983 \tabularnewline
9 & 0.198641 & 1.6972 & 0.04696 \tabularnewline
10 & -0.092172 & -0.7875 & 0.216763 \tabularnewline
11 & -0.033537 & -0.2865 & 0.387639 \tabularnewline
12 & 0.044664 & 0.3816 & 0.351931 \tabularnewline
13 & -0.144822 & -1.2374 & 0.109959 \tabularnewline
14 & -0.055549 & -0.4746 & 0.318241 \tabularnewline
15 & -0.021719 & -0.1856 & 0.42665 \tabularnewline
16 & -0.256374 & -2.1905 & 0.015843 \tabularnewline
17 & 0.009918 & 0.0847 & 0.46635 \tabularnewline
18 & -0.021188 & -0.181 & 0.428421 \tabularnewline
19 & -0.182929 & -1.563 & 0.061195 \tabularnewline
\hline
\end{tabular}
%Source: https://freestatistics.org/blog/index.php?pk=34296&T=1

[TABLE]
[ROW][C]Autocorrelation Function[/C][/ROW]
[ROW][C]Time lag k[/C][C]ACF(k)[/C][C]T-STAT[/C][C]P-value[/C][/ROW]
[ROW][C]1[/C][C]0.092002[/C][C]0.7861[/C][C]0.217187[/C][/ROW]
[ROW][C]2[/C][C]0.278359[/C][C]2.3783[/C][C]0.010006[/C][/ROW]
[ROW][C]3[/C][C]0.534343[/C][C]4.5654[/C][C]1e-05[/C][/ROW]
[ROW][C]4[/C][C]0.109558[/C][C]0.9361[/C][C]0.176164[/C][/ROW]
[ROW][C]5[/C][C]0.159572[/C][C]1.3634[/C][C]0.088476[/C][/ROW]
[ROW][C]6[/C][C]0.332798[/C][C]2.8434[/C][C]0.002893[/C][/ROW]
[ROW][C]7[/C][C]-0.078036[/C][C]-0.6667[/C][C]0.25352[/C][/ROW]
[ROW][C]8[/C][C]0.107822[/C][C]0.9212[/C][C]0.179983[/C][/ROW]
[ROW][C]9[/C][C]0.198641[/C][C]1.6972[/C][C]0.04696[/C][/ROW]
[ROW][C]10[/C][C]-0.092172[/C][C]-0.7875[/C][C]0.216763[/C][/ROW]
[ROW][C]11[/C][C]-0.033537[/C][C]-0.2865[/C][C]0.387639[/C][/ROW]
[ROW][C]12[/C][C]0.044664[/C][C]0.3816[/C][C]0.351931[/C][/ROW]
[ROW][C]13[/C][C]-0.144822[/C][C]-1.2374[/C][C]0.109959[/C][/ROW]
[ROW][C]14[/C][C]-0.055549[/C][C]-0.4746[/C][C]0.318241[/C][/ROW]
[ROW][C]15[/C][C]-0.021719[/C][C]-0.1856[/C][C]0.42665[/C][/ROW]
[ROW][C]16[/C][C]-0.256374[/C][C]-2.1905[/C][C]0.015843[/C][/ROW]
[ROW][C]17[/C][C]0.009918[/C][C]0.0847[/C][C]0.46635[/C][/ROW]
[ROW][C]18[/C][C]-0.021188[/C][C]-0.181[/C][C]0.428421[/C][/ROW]
[ROW][C]19[/C][C]-0.182929[/C][C]-1.563[/C][C]0.061195[/C][/ROW]
[/TABLE]
Source: https://freestatistics.org/blog/index.php?pk=34296&T=1

Globally Unique Identifier (entire table): ba.freestatistics.org/blog/index.php?pk=34296&T=1

As an alternative you can also use a QR Code:  

The GUIDs for individual cells are displayed in the table below:

Autocorrelation Function
Time lag kACF(k)T-STATP-value
10.0920020.78610.217187
20.2783592.37830.010006
30.5343434.56541e-05
40.1095580.93610.176164
50.1595721.36340.088476
60.3327982.84340.002893
7-0.078036-0.66670.25352
80.1078220.92120.179983
90.1986411.69720.04696
10-0.092172-0.78750.216763
11-0.033537-0.28650.387639
120.0446640.38160.351931
13-0.144822-1.23740.109959
14-0.055549-0.47460.318241
15-0.021719-0.18560.42665
16-0.256374-2.19050.015843
170.0099180.08470.46635
18-0.021188-0.1810.428421
19-0.182929-1.5630.061195


Partial Autocorrelation Function
Time lag kPACF(k)T-STATP-value
10.0920020.78610.217187
20.2721992.32570.011409
30.5344494.56631e-05
40.0557070.4760.317761
5-0.157485-1.34560.091306
60.0187430.16010.436606
7-0.208088-1.77790.039792
8-0.048932-0.41810.338559
90.1348761.15240.126462
100.0574970.49130.312359
11-0.167858-1.43420.077896
12-0.164619-1.40650.081909
13-0.050108-0.42810.334911
140.0414440.35410.362145
150.089840.76760.222603
16-0.134442-1.14870.127221
170.0554070.47340.318671
180.0891980.76210.224226
190.0133580.11410.454725

\begin{tabular}{lllllllll}
\hline
Partial Autocorrelation Function \tabularnewline
Time lag k & PACF(k) & T-STAT & P-value \tabularnewline
1 & 0.092002 & 0.7861 & 0.217187 \tabularnewline
2 & 0.272199 & 2.3257 & 0.011409 \tabularnewline
3 & 0.534449 & 4.5663 & 1e-05 \tabularnewline
4 & 0.055707 & 0.476 & 0.317761 \tabularnewline
5 & -0.157485 & -1.3456 & 0.091306 \tabularnewline
6 & 0.018743 & 0.1601 & 0.436606 \tabularnewline
7 & -0.208088 & -1.7779 & 0.039792 \tabularnewline
8 & -0.048932 & -0.4181 & 0.338559 \tabularnewline
9 & 0.134876 & 1.1524 & 0.126462 \tabularnewline
10 & 0.057497 & 0.4913 & 0.312359 \tabularnewline
11 & -0.167858 & -1.4342 & 0.077896 \tabularnewline
12 & -0.164619 & -1.4065 & 0.081909 \tabularnewline
13 & -0.050108 & -0.4281 & 0.334911 \tabularnewline
14 & 0.041444 & 0.3541 & 0.362145 \tabularnewline
15 & 0.08984 & 0.7676 & 0.222603 \tabularnewline
16 & -0.134442 & -1.1487 & 0.127221 \tabularnewline
17 & 0.055407 & 0.4734 & 0.318671 \tabularnewline
18 & 0.089198 & 0.7621 & 0.224226 \tabularnewline
19 & 0.013358 & 0.1141 & 0.454725 \tabularnewline
\hline
\end{tabular}
%Source: https://freestatistics.org/blog/index.php?pk=34296&T=2

[TABLE]
[ROW][C]Partial Autocorrelation Function[/C][/ROW]
[ROW][C]Time lag k[/C][C]PACF(k)[/C][C]T-STAT[/C][C]P-value[/C][/ROW]
[ROW][C]1[/C][C]0.092002[/C][C]0.7861[/C][C]0.217187[/C][/ROW]
[ROW][C]2[/C][C]0.272199[/C][C]2.3257[/C][C]0.011409[/C][/ROW]
[ROW][C]3[/C][C]0.534449[/C][C]4.5663[/C][C]1e-05[/C][/ROW]
[ROW][C]4[/C][C]0.055707[/C][C]0.476[/C][C]0.317761[/C][/ROW]
[ROW][C]5[/C][C]-0.157485[/C][C]-1.3456[/C][C]0.091306[/C][/ROW]
[ROW][C]6[/C][C]0.018743[/C][C]0.1601[/C][C]0.436606[/C][/ROW]
[ROW][C]7[/C][C]-0.208088[/C][C]-1.7779[/C][C]0.039792[/C][/ROW]
[ROW][C]8[/C][C]-0.048932[/C][C]-0.4181[/C][C]0.338559[/C][/ROW]
[ROW][C]9[/C][C]0.134876[/C][C]1.1524[/C][C]0.126462[/C][/ROW]
[ROW][C]10[/C][C]0.057497[/C][C]0.4913[/C][C]0.312359[/C][/ROW]
[ROW][C]11[/C][C]-0.167858[/C][C]-1.4342[/C][C]0.077896[/C][/ROW]
[ROW][C]12[/C][C]-0.164619[/C][C]-1.4065[/C][C]0.081909[/C][/ROW]
[ROW][C]13[/C][C]-0.050108[/C][C]-0.4281[/C][C]0.334911[/C][/ROW]
[ROW][C]14[/C][C]0.041444[/C][C]0.3541[/C][C]0.362145[/C][/ROW]
[ROW][C]15[/C][C]0.08984[/C][C]0.7676[/C][C]0.222603[/C][/ROW]
[ROW][C]16[/C][C]-0.134442[/C][C]-1.1487[/C][C]0.127221[/C][/ROW]
[ROW][C]17[/C][C]0.055407[/C][C]0.4734[/C][C]0.318671[/C][/ROW]
[ROW][C]18[/C][C]0.089198[/C][C]0.7621[/C][C]0.224226[/C][/ROW]
[ROW][C]19[/C][C]0.013358[/C][C]0.1141[/C][C]0.454725[/C][/ROW]
[/TABLE]
Source: https://freestatistics.org/blog/index.php?pk=34296&T=2

Globally Unique Identifier (entire table): ba.freestatistics.org/blog/index.php?pk=34296&T=2

As an alternative you can also use a QR Code:  

The GUIDs for individual cells are displayed in the table below:

Partial Autocorrelation Function
Time lag kPACF(k)T-STATP-value
10.0920020.78610.217187
20.2721992.32570.011409
30.5344494.56631e-05
40.0557070.4760.317761
5-0.157485-1.34560.091306
60.0187430.16010.436606
7-0.208088-1.77790.039792
8-0.048932-0.41810.338559
90.1348761.15240.126462
100.0574970.49130.312359
11-0.167858-1.43420.077896
12-0.164619-1.40650.081909
13-0.050108-0.42810.334911
140.0414440.35410.362145
150.089840.76760.222603
16-0.134442-1.14870.127221
170.0554070.47340.318671
180.0891980.76210.224226
190.0133580.11410.454725


Parameters (Session):
par1 = Default ; par2 = 1 ; par3 = 0 ; par4 = 1 ; par5 = 12 ;
Parameters (R input):
par1 = Default ; par2 = 1 ; par3 = 0 ; par4 = 1 ; par5 = 12 ;
R code (references can be found in the software module):
if (par1 == 'Default') {
par1 = 10*log10(length(x))
} else {
par1 <- as.numeric(par1)
}
par2 <- as.numeric(par2)
par3 <- as.numeric(par3)
par4 <- as.numeric(par4)
par5 <- as.numeric(par5)
if (par2 == 0) {
x <- log(x)
} else {
x <- (x ^ par2 - 1) / par2
}
if (par3 > 0) x <- diff(x,lag=1,difference=par3)
if (par4 > 0) x <- diff(x,lag=par5,difference=par4)
bitmap(file='pic1.png')
racf <- acf(x,par1,main='Autocorrelation',xlab='lags',ylab='ACF')
dev.off()
bitmap(file='pic2.png')
rpacf <- pacf(x,par1,main='Partial Autocorrelation',xlab='lags',ylab='PACF')
dev.off()
(myacf <- c(racf$acf))
(mypacf <- c(rpacf$acf))
lengthx <- length(x)
sqrtn <- sqrt(lengthx)
load(file='createtable')
a<-table.start()
a<-table.row.start(a)
a<-table.element(a,'Autocorrelation Function',4,TRUE)
a<-table.row.end(a)
a<-table.row.start(a)
a<-table.element(a,'Time lag k',header=TRUE)
a<-table.element(a,hyperlink('basics.htm','ACF(k)','click here for more information about the Autocorrelation Function'),header=TRUE)
a<-table.element(a,'T-STAT',header=TRUE)
a<-table.element(a,'P-value',header=TRUE)
a<-table.row.end(a)
for (i in 2:(par1+1)) {
a<-table.row.start(a)
a<-table.element(a,i-1,header=TRUE)
a<-table.element(a,round(myacf[i],6))
mytstat <- myacf[i]*sqrtn
a<-table.element(a,round(mytstat,4))
a<-table.element(a,round(1-pt(abs(mytstat),lengthx),6))
a<-table.row.end(a)
}
a<-table.end(a)
table.save(a,file='mytable.tab')
a<-table.start()
a<-table.row.start(a)
a<-table.element(a,'Partial Autocorrelation Function',4,TRUE)
a<-table.row.end(a)
a<-table.row.start(a)
a<-table.element(a,'Time lag k',header=TRUE)
a<-table.element(a,hyperlink('basics.htm','PACF(k)','click here for more information about the Partial Autocorrelation Function'),header=TRUE)
a<-table.element(a,'T-STAT',header=TRUE)
a<-table.element(a,'P-value',header=TRUE)
a<-table.row.end(a)
for (i in 1:par1) {
a<-table.row.start(a)
a<-table.element(a,i,header=TRUE)
a<-table.element(a,round(mypacf[i],6))
mytstat <- mypacf[i]*sqrtn
a<-table.element(a,round(mytstat,4))
a<-table.element(a,round(1-pt(abs(mytstat),lengthx),6))
a<-table.row.end(a)
}
a<-table.end(a)
table.save(a,file='mytable1.tab')