Free Statistics

of Irreproducible Research!

Author's title

Author*The author of this computation has been verified*
R Software Modulerwasp_arimaforecasting.wasp
Title produced by softwareARIMA Forecasting
Date of computationTue, 16 Dec 2008 16:21:15 -0700
Cite this page as followsStatistical Computations at FreeStatistics.org, Office for Research Development and Education, URL https://freestatistics.org/blog/index.php?v=date/2008/Dec/17/t1229469948j9pv8r66w27o119.htm/, Retrieved Sun, 19 May 2024 07:55:26 +0000
Statistical Computations at FreeStatistics.org, Office for Research Development and Education, URL https://freestatistics.org/blog/index.php?pk=34249, Retrieved Sun, 19 May 2024 07:55:26 +0000
QR Codes:

Original text written by user:
IsPrivate?No (this computation is public)
User-defined keywords
Estimated Impact226
Family? (F = Feedback message, R = changed R code, M = changed R Module, P = changed Parameters, D = changed Data)
-     [ARIMA Backward Selection] [Step 5 Eigen tijd...] [2008-12-10 01:30:15] [2e47c012a41b5d00849693def6142119]
F RMP     [ARIMA Forecasting] [Arima forecasting...] [2008-12-16 23:21:15] [9f72e095d5529918bf5b0810c01bf6ce] [Current]
F           [ARIMA Forecasting] [] [2008-12-17 03:10:23] [17bd4671b42d569d890f7246b2ee4ecc]
-           [ARIMA Forecasting] [] [2008-12-17 03:13:35] [74be16979710d4c4e7c6647856088456]
Feedback Forum
2008-12-17 21:01:24 [Julie Govaerts] [reply
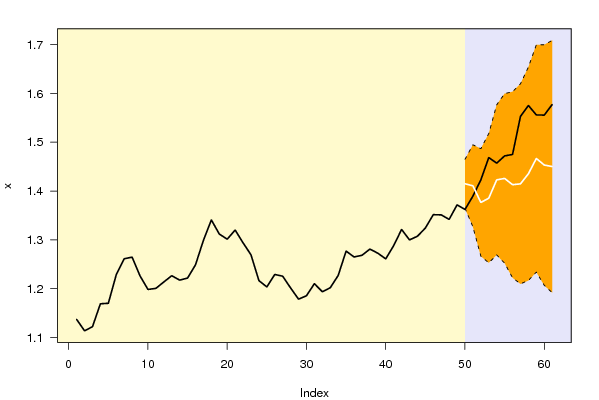
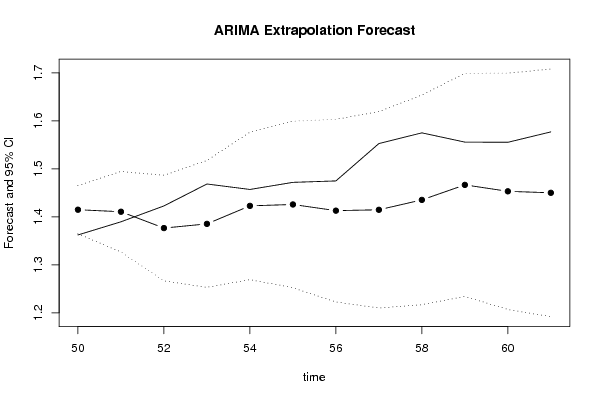
in de tweede grafiek is het duidelijk dat de voorspellingen (bollenlijn) lager liggen dan onze werkelijke observaties (volle lijn) = dit zagen we ook al in de tabel. De voorspellingen volgen wel redelijk de schommelingen (pieken en dalen) en dus de seizoenaliteit van de werkelijke observaties.

tweede tabel -->
Hoe verder we in de toekomst gaan voorspellen hoe groter de S.E. wordt, dit valt te verklaren doordat de berekening rekening houdt met alle gegevens. Dit wil zeggen dat als maand 56 wordt berekend dat er ook rekening wordt gehouden met de voorspelling van de maand 55. Maar de maand 55 is ook slechts een voorspelling dus we houden voor het berekenen van de maand 56 rekening met de voorafgaande voorspellingen en de gegeven tijdsreeks. Daardoor is de verwachte voorspellingsfout een stijgend gegeven in de tijd.
2008-12-24 10:47:27 [a2386b643d711541400692649981f2dc] [reply
Step 1 : correct uitgevoerd en voldoende uitleg!

step 2: bij step 2 had je de grafieken moeten gebruiken die je bij step 1 hebt geplaatst. Bij de eerste grafiek had je gewoon moeten vermelden of er een trend of seizonaliteit aanwezig was. Bij jou grafiek zien we een licht stijgende trend en is er niet echt sprake van seizonaliteit. Bij de tweede grafiek leg je uit waar de bolletjeslijn en de volle lijn voor staan en zeg je dat ze binnen het betrouwbaarheidsinterval liggen. Je had nog een conclusie kunnen maken : aangezien ze in het betrouwbaarheidsinterval liggen is er geen sprake van een significant verschil tussen de voorspelling en de verwachting.

step3: Je geeft een volledige uitleg! Ik kan hier niet veel aan toevoegen.

step 4 is niet gemaakt maar ik begreep deze opdracht ook niet goed, dus ik kan hier geen antwoord op geven.

step 5 is inderdaad hetzelde antwoord als je bij step 2 moest geven.

Post a new message
Dataseries X:
1.1372
1.1139
1.1222
1.1692
1.1702
1.2286
1.2613
1.2646
1.2262
1.1985
1.2007
1.2138
1.2266
1.2176
1.2218
1.249
1.2991
1.3408
1.3119
1.3014
1.3201
1.2938
1.2694
1.2165
1.2037
1.2292
1.2256
1.2015
1.1786
1.1856
1.2103
1.1938
1.202
1.2271
1.277
1.265
1.2684
1.2811
1.2727
1.2611
1.2881
1.3213
1.2999
1.3074
1.3242
1.3516
1.3511
1.3419
1.3716
1.3622
1.3896
1.4227
1.4684
1.457
1.4718
1.4748
1.5527
1.575
1.5557
1.5553
1.577


Summary of computational transaction
Raw Inputview raw input (R code)
Raw Outputview raw output of R engine
Computing time19 seconds
R Server'Sir Ronald Aylmer Fisher' @ 193.190.124.24

\begin{tabular}{lllllllll}
\hline
Summary of computational transaction \tabularnewline
Raw Input & view raw input (R code)  \tabularnewline
Raw Output & view raw output of R engine  \tabularnewline
Computing time & 19 seconds \tabularnewline
R Server & 'Sir Ronald Aylmer Fisher' @ 193.190.124.24 \tabularnewline
\hline
\end{tabular}
%Source: https://freestatistics.org/blog/index.php?pk=34249&T=0

[TABLE]
[ROW][C]Summary of computational transaction[/C][/ROW]
[ROW][C]Raw Input[/C][C]view raw input (R code) [/C][/ROW]
[ROW][C]Raw Output[/C][C]view raw output of R engine [/C][/ROW]
[ROW][C]Computing time[/C][C]19 seconds[/C][/ROW]
[ROW][C]R Server[/C][C]'Sir Ronald Aylmer Fisher' @ 193.190.124.24[/C][/ROW]
[/TABLE]
Source: https://freestatistics.org/blog/index.php?pk=34249&T=0

Globally Unique Identifier (entire table): ba.freestatistics.org/blog/index.php?pk=34249&T=0

As an alternative you can also use a QR Code:  

The GUIDs for individual cells are displayed in the table below:

Summary of computational transaction
Raw Inputview raw input (R code)
Raw Outputview raw output of R engine
Computing time19 seconds
R Server'Sir Ronald Aylmer Fisher' @ 193.190.124.24


Univariate ARIMA Extrapolation Forecast
timeY[t]F[t]95% LB95% UBp-value(H0: Y[t] = F[t])P(F[t]>Y[t-1])P(F[t]>Y[t-s])P(F[t]>Y[49])
371.2684-------
381.2811-------
391.2727-------
401.2611-------
411.2881-------
421.3213-------
431.2999-------
441.3074-------
451.3242-------
461.3516-------
471.3511-------
481.3419-------
491.3716-------
501.36221.41481.36471.46490.01990.954410.9544
511.38961.41061.32661.49460.31230.87050.99940.8184
521.42271.37651.26661.48650.20540.4080.98020.5351
531.46841.38531.2531.51750.1090.28950.9250.5802
541.4571.42281.26921.57640.33130.28040.90230.7432
551.47181.42571.25221.59930.30140.3620.92240.7295
561.47481.41281.22241.60330.26180.2720.86110.6644
571.55271.41461.20991.61940.09310.28230.80670.6598
581.5751.43531.21681.65370.1050.1460.77360.7161
591.55571.46661.2341.69920.22630.18040.83470.7882
601.55531.45311.20691.69930.2080.20710.8120.7418
611.5771.451.19191.70820.16750.21210.72430.7243

\begin{tabular}{lllllllll}
\hline
Univariate ARIMA Extrapolation Forecast \tabularnewline
time & Y[t] & F[t] & 95% LB & 95% UB & p-value(H0: Y[t] = F[t]) & P(F[t]>Y[t-1]) & P(F[t]>Y[t-s]) & P(F[t]>Y[49]) \tabularnewline
37 & 1.2684 & - & - & - & - & - & - & - \tabularnewline
38 & 1.2811 & - & - & - & - & - & - & - \tabularnewline
39 & 1.2727 & - & - & - & - & - & - & - \tabularnewline
40 & 1.2611 & - & - & - & - & - & - & - \tabularnewline
41 & 1.2881 & - & - & - & - & - & - & - \tabularnewline
42 & 1.3213 & - & - & - & - & - & - & - \tabularnewline
43 & 1.2999 & - & - & - & - & - & - & - \tabularnewline
44 & 1.3074 & - & - & - & - & - & - & - \tabularnewline
45 & 1.3242 & - & - & - & - & - & - & - \tabularnewline
46 & 1.3516 & - & - & - & - & - & - & - \tabularnewline
47 & 1.3511 & - & - & - & - & - & - & - \tabularnewline
48 & 1.3419 & - & - & - & - & - & - & - \tabularnewline
49 & 1.3716 & - & - & - & - & - & - & - \tabularnewline
50 & 1.3622 & 1.4148 & 1.3647 & 1.4649 & 0.0199 & 0.9544 & 1 & 0.9544 \tabularnewline
51 & 1.3896 & 1.4106 & 1.3266 & 1.4946 & 0.3123 & 0.8705 & 0.9994 & 0.8184 \tabularnewline
52 & 1.4227 & 1.3765 & 1.2666 & 1.4865 & 0.2054 & 0.408 & 0.9802 & 0.5351 \tabularnewline
53 & 1.4684 & 1.3853 & 1.253 & 1.5175 & 0.109 & 0.2895 & 0.925 & 0.5802 \tabularnewline
54 & 1.457 & 1.4228 & 1.2692 & 1.5764 & 0.3313 & 0.2804 & 0.9023 & 0.7432 \tabularnewline
55 & 1.4718 & 1.4257 & 1.2522 & 1.5993 & 0.3014 & 0.362 & 0.9224 & 0.7295 \tabularnewline
56 & 1.4748 & 1.4128 & 1.2224 & 1.6033 & 0.2618 & 0.272 & 0.8611 & 0.6644 \tabularnewline
57 & 1.5527 & 1.4146 & 1.2099 & 1.6194 & 0.0931 & 0.2823 & 0.8067 & 0.6598 \tabularnewline
58 & 1.575 & 1.4353 & 1.2168 & 1.6537 & 0.105 & 0.146 & 0.7736 & 0.7161 \tabularnewline
59 & 1.5557 & 1.4666 & 1.234 & 1.6992 & 0.2263 & 0.1804 & 0.8347 & 0.7882 \tabularnewline
60 & 1.5553 & 1.4531 & 1.2069 & 1.6993 & 0.208 & 0.2071 & 0.812 & 0.7418 \tabularnewline
61 & 1.577 & 1.45 & 1.1919 & 1.7082 & 0.1675 & 0.2121 & 0.7243 & 0.7243 \tabularnewline
\hline
\end{tabular}
%Source: https://freestatistics.org/blog/index.php?pk=34249&T=1

[TABLE]
[ROW][C]Univariate ARIMA Extrapolation Forecast[/C][/ROW]
[ROW][C]time[/C][C]Y[t][/C][C]F[t][/C][C]95% LB[/C][C]95% UB[/C][C]p-value(H0: Y[t] = F[t])[/C][C]P(F[t]>Y[t-1])[/C][C]P(F[t]>Y[t-s])[/C][C]P(F[t]>Y[49])[/C][/ROW]
[ROW][C]37[/C][C]1.2684[/C][C]-[/C][C]-[/C][C]-[/C][C]-[/C][C]-[/C][C]-[/C][C]-[/C][/ROW]
[ROW][C]38[/C][C]1.2811[/C][C]-[/C][C]-[/C][C]-[/C][C]-[/C][C]-[/C][C]-[/C][C]-[/C][/ROW]
[ROW][C]39[/C][C]1.2727[/C][C]-[/C][C]-[/C][C]-[/C][C]-[/C][C]-[/C][C]-[/C][C]-[/C][/ROW]
[ROW][C]40[/C][C]1.2611[/C][C]-[/C][C]-[/C][C]-[/C][C]-[/C][C]-[/C][C]-[/C][C]-[/C][/ROW]
[ROW][C]41[/C][C]1.2881[/C][C]-[/C][C]-[/C][C]-[/C][C]-[/C][C]-[/C][C]-[/C][C]-[/C][/ROW]
[ROW][C]42[/C][C]1.3213[/C][C]-[/C][C]-[/C][C]-[/C][C]-[/C][C]-[/C][C]-[/C][C]-[/C][/ROW]
[ROW][C]43[/C][C]1.2999[/C][C]-[/C][C]-[/C][C]-[/C][C]-[/C][C]-[/C][C]-[/C][C]-[/C][/ROW]
[ROW][C]44[/C][C]1.3074[/C][C]-[/C][C]-[/C][C]-[/C][C]-[/C][C]-[/C][C]-[/C][C]-[/C][/ROW]
[ROW][C]45[/C][C]1.3242[/C][C]-[/C][C]-[/C][C]-[/C][C]-[/C][C]-[/C][C]-[/C][C]-[/C][/ROW]
[ROW][C]46[/C][C]1.3516[/C][C]-[/C][C]-[/C][C]-[/C][C]-[/C][C]-[/C][C]-[/C][C]-[/C][/ROW]
[ROW][C]47[/C][C]1.3511[/C][C]-[/C][C]-[/C][C]-[/C][C]-[/C][C]-[/C][C]-[/C][C]-[/C][/ROW]
[ROW][C]48[/C][C]1.3419[/C][C]-[/C][C]-[/C][C]-[/C][C]-[/C][C]-[/C][C]-[/C][C]-[/C][/ROW]
[ROW][C]49[/C][C]1.3716[/C][C]-[/C][C]-[/C][C]-[/C][C]-[/C][C]-[/C][C]-[/C][C]-[/C][/ROW]
[ROW][C]50[/C][C]1.3622[/C][C]1.4148[/C][C]1.3647[/C][C]1.4649[/C][C]0.0199[/C][C]0.9544[/C][C]1[/C][C]0.9544[/C][/ROW]
[ROW][C]51[/C][C]1.3896[/C][C]1.4106[/C][C]1.3266[/C][C]1.4946[/C][C]0.3123[/C][C]0.8705[/C][C]0.9994[/C][C]0.8184[/C][/ROW]
[ROW][C]52[/C][C]1.4227[/C][C]1.3765[/C][C]1.2666[/C][C]1.4865[/C][C]0.2054[/C][C]0.408[/C][C]0.9802[/C][C]0.5351[/C][/ROW]
[ROW][C]53[/C][C]1.4684[/C][C]1.3853[/C][C]1.253[/C][C]1.5175[/C][C]0.109[/C][C]0.2895[/C][C]0.925[/C][C]0.5802[/C][/ROW]
[ROW][C]54[/C][C]1.457[/C][C]1.4228[/C][C]1.2692[/C][C]1.5764[/C][C]0.3313[/C][C]0.2804[/C][C]0.9023[/C][C]0.7432[/C][/ROW]
[ROW][C]55[/C][C]1.4718[/C][C]1.4257[/C][C]1.2522[/C][C]1.5993[/C][C]0.3014[/C][C]0.362[/C][C]0.9224[/C][C]0.7295[/C][/ROW]
[ROW][C]56[/C][C]1.4748[/C][C]1.4128[/C][C]1.2224[/C][C]1.6033[/C][C]0.2618[/C][C]0.272[/C][C]0.8611[/C][C]0.6644[/C][/ROW]
[ROW][C]57[/C][C]1.5527[/C][C]1.4146[/C][C]1.2099[/C][C]1.6194[/C][C]0.0931[/C][C]0.2823[/C][C]0.8067[/C][C]0.6598[/C][/ROW]
[ROW][C]58[/C][C]1.575[/C][C]1.4353[/C][C]1.2168[/C][C]1.6537[/C][C]0.105[/C][C]0.146[/C][C]0.7736[/C][C]0.7161[/C][/ROW]
[ROW][C]59[/C][C]1.5557[/C][C]1.4666[/C][C]1.234[/C][C]1.6992[/C][C]0.2263[/C][C]0.1804[/C][C]0.8347[/C][C]0.7882[/C][/ROW]
[ROW][C]60[/C][C]1.5553[/C][C]1.4531[/C][C]1.2069[/C][C]1.6993[/C][C]0.208[/C][C]0.2071[/C][C]0.812[/C][C]0.7418[/C][/ROW]
[ROW][C]61[/C][C]1.577[/C][C]1.45[/C][C]1.1919[/C][C]1.7082[/C][C]0.1675[/C][C]0.2121[/C][C]0.7243[/C][C]0.7243[/C][/ROW]
[/TABLE]
Source: https://freestatistics.org/blog/index.php?pk=34249&T=1

Globally Unique Identifier (entire table): ba.freestatistics.org/blog/index.php?pk=34249&T=1

As an alternative you can also use a QR Code:  

The GUIDs for individual cells are displayed in the table below:

Univariate ARIMA Extrapolation Forecast
timeY[t]F[t]95% LB95% UBp-value(H0: Y[t] = F[t])P(F[t]>Y[t-1])P(F[t]>Y[t-s])P(F[t]>Y[49])
371.2684-------
381.2811-------
391.2727-------
401.2611-------
411.2881-------
421.3213-------
431.2999-------
441.3074-------
451.3242-------
461.3516-------
471.3511-------
481.3419-------
491.3716-------
501.36221.41481.36471.46490.01990.954410.9544
511.38961.41061.32661.49460.31230.87050.99940.8184
521.42271.37651.26661.48650.20540.4080.98020.5351
531.46841.38531.2531.51750.1090.28950.9250.5802
541.4571.42281.26921.57640.33130.28040.90230.7432
551.47181.42571.25221.59930.30140.3620.92240.7295
561.47481.41281.22241.60330.26180.2720.86110.6644
571.55271.41461.20991.61940.09310.28230.80670.6598
581.5751.43531.21681.65370.1050.1460.77360.7161
591.55571.46661.2341.69920.22630.18040.83470.7882
601.55531.45311.20691.69930.2080.20710.8120.7418
611.5771.451.19191.70820.16750.21210.72430.7243


Univariate ARIMA Extrapolation Forecast Performance
time% S.E.PEMAPESq.EMSERMSE
500.0181-0.03720.00310.00282e-040.0152
510.0304-0.01490.00124e-0400.0061
520.04080.03350.00280.00212e-040.0133
530.04870.060.0050.00696e-040.024
540.05510.0240.0020.00121e-040.0099
550.06210.03230.00270.00212e-040.0133
560.06880.04390.00370.00383e-040.0179
570.07380.09760.00810.01910.00160.0399
580.07770.09740.00810.01950.00160.0403
590.08090.06080.00510.00797e-040.0257
600.08640.07030.00590.01049e-040.0295
610.09080.08760.00730.01610.00130.0366

\begin{tabular}{lllllllll}
\hline
Univariate ARIMA Extrapolation Forecast Performance \tabularnewline
time & % S.E. & PE & MAPE & Sq.E & MSE & RMSE \tabularnewline
50 & 0.0181 & -0.0372 & 0.0031 & 0.0028 & 2e-04 & 0.0152 \tabularnewline
51 & 0.0304 & -0.0149 & 0.0012 & 4e-04 & 0 & 0.0061 \tabularnewline
52 & 0.0408 & 0.0335 & 0.0028 & 0.0021 & 2e-04 & 0.0133 \tabularnewline
53 & 0.0487 & 0.06 & 0.005 & 0.0069 & 6e-04 & 0.024 \tabularnewline
54 & 0.0551 & 0.024 & 0.002 & 0.0012 & 1e-04 & 0.0099 \tabularnewline
55 & 0.0621 & 0.0323 & 0.0027 & 0.0021 & 2e-04 & 0.0133 \tabularnewline
56 & 0.0688 & 0.0439 & 0.0037 & 0.0038 & 3e-04 & 0.0179 \tabularnewline
57 & 0.0738 & 0.0976 & 0.0081 & 0.0191 & 0.0016 & 0.0399 \tabularnewline
58 & 0.0777 & 0.0974 & 0.0081 & 0.0195 & 0.0016 & 0.0403 \tabularnewline
59 & 0.0809 & 0.0608 & 0.0051 & 0.0079 & 7e-04 & 0.0257 \tabularnewline
60 & 0.0864 & 0.0703 & 0.0059 & 0.0104 & 9e-04 & 0.0295 \tabularnewline
61 & 0.0908 & 0.0876 & 0.0073 & 0.0161 & 0.0013 & 0.0366 \tabularnewline
\hline
\end{tabular}
%Source: https://freestatistics.org/blog/index.php?pk=34249&T=2

[TABLE]
[ROW][C]Univariate ARIMA Extrapolation Forecast Performance[/C][/ROW]
[ROW][C]time[/C][C]% S.E.[/C][C]PE[/C][C]MAPE[/C][C]Sq.E[/C][C]MSE[/C][C]RMSE[/C][/ROW]
[ROW][C]50[/C][C]0.0181[/C][C]-0.0372[/C][C]0.0031[/C][C]0.0028[/C][C]2e-04[/C][C]0.0152[/C][/ROW]
[ROW][C]51[/C][C]0.0304[/C][C]-0.0149[/C][C]0.0012[/C][C]4e-04[/C][C]0[/C][C]0.0061[/C][/ROW]
[ROW][C]52[/C][C]0.0408[/C][C]0.0335[/C][C]0.0028[/C][C]0.0021[/C][C]2e-04[/C][C]0.0133[/C][/ROW]
[ROW][C]53[/C][C]0.0487[/C][C]0.06[/C][C]0.005[/C][C]0.0069[/C][C]6e-04[/C][C]0.024[/C][/ROW]
[ROW][C]54[/C][C]0.0551[/C][C]0.024[/C][C]0.002[/C][C]0.0012[/C][C]1e-04[/C][C]0.0099[/C][/ROW]
[ROW][C]55[/C][C]0.0621[/C][C]0.0323[/C][C]0.0027[/C][C]0.0021[/C][C]2e-04[/C][C]0.0133[/C][/ROW]
[ROW][C]56[/C][C]0.0688[/C][C]0.0439[/C][C]0.0037[/C][C]0.0038[/C][C]3e-04[/C][C]0.0179[/C][/ROW]
[ROW][C]57[/C][C]0.0738[/C][C]0.0976[/C][C]0.0081[/C][C]0.0191[/C][C]0.0016[/C][C]0.0399[/C][/ROW]
[ROW][C]58[/C][C]0.0777[/C][C]0.0974[/C][C]0.0081[/C][C]0.0195[/C][C]0.0016[/C][C]0.0403[/C][/ROW]
[ROW][C]59[/C][C]0.0809[/C][C]0.0608[/C][C]0.0051[/C][C]0.0079[/C][C]7e-04[/C][C]0.0257[/C][/ROW]
[ROW][C]60[/C][C]0.0864[/C][C]0.0703[/C][C]0.0059[/C][C]0.0104[/C][C]9e-04[/C][C]0.0295[/C][/ROW]
[ROW][C]61[/C][C]0.0908[/C][C]0.0876[/C][C]0.0073[/C][C]0.0161[/C][C]0.0013[/C][C]0.0366[/C][/ROW]
[/TABLE]
Source: https://freestatistics.org/blog/index.php?pk=34249&T=2

Globally Unique Identifier (entire table): ba.freestatistics.org/blog/index.php?pk=34249&T=2

As an alternative you can also use a QR Code:  

The GUIDs for individual cells are displayed in the table below:

Univariate ARIMA Extrapolation Forecast Performance
time% S.E.PEMAPESq.EMSERMSE
500.0181-0.03720.00310.00282e-040.0152
510.0304-0.01490.00124e-0400.0061
520.04080.03350.00280.00212e-040.0133
530.04870.060.0050.00696e-040.024
540.05510.0240.0020.00121e-040.0099
550.06210.03230.00270.00212e-040.0133
560.06880.04390.00370.00383e-040.0179
570.07380.09760.00810.01910.00160.0399
580.07770.09740.00810.01950.00160.0403
590.08090.06080.00510.00797e-040.0257
600.08640.07030.00590.01049e-040.0295
610.09080.08760.00730.01610.00130.0366


Parameters (Session):
par1 = 12 ; par2 = 1 ; par3 = 1 ; par4 = 1 ; par5 = 12 ; par6 = 3 ; par7 = 2 ; par8 = 2 ; par9 = 1 ; par10 = FALSE ;
Parameters (R input):
par1 = 12 ; par2 = 1 ; par3 = 1 ; par4 = 1 ; par5 = 12 ; par6 = 3 ; par7 = 2 ; par8 = 2 ; par9 = 1 ; par10 = FALSE ;
R code (references can be found in the software module):
par1 <- as.numeric(par1) #cut off periods
par2 <- as.numeric(par2) #lambda
par3 <- as.numeric(par3) #degree of non-seasonal differencing
par4 <- as.numeric(par4) #degree of seasonal differencing
par5 <- as.numeric(par5) #seasonal period
par6 <- as.numeric(par6) #p
par7 <- as.numeric(par7) #q
par8 <- as.numeric(par8) #P
par9 <- as.numeric(par9) #Q
if (par10 == 'TRUE') par10 <- TRUE
if (par10 == 'FALSE') par10 <- FALSE
if (par2 == 0) x <- log(x)
if (par2 != 0) x <- x^par2
lx <- length(x)
first <- lx - 2*par1
nx <- lx - par1
nx1 <- nx + 1
fx <- lx - nx
if (fx < 1) {
fx <- par5
nx1 <- lx + fx - 1
first <- lx - 2*fx
}
first <- 1
if (fx < 3) fx <- round(lx/10,0)
(arima.out <- arima(x[1:nx], order=c(par6,par3,par7), seasonal=list(order=c(par8,par4,par9), period=par5), include.mean=par10, method='ML'))
(forecast <- predict(arima.out,fx))
(lb <- forecast$pred - 1.96 * forecast$se)
(ub <- forecast$pred + 1.96 * forecast$se)
if (par2 == 0) {
x <- exp(x)
forecast$pred <- exp(forecast$pred)
lb <- exp(lb)
ub <- exp(ub)
}
if (par2 != 0) {
x <- x^(1/par2)
forecast$pred <- forecast$pred^(1/par2)
lb <- lb^(1/par2)
ub <- ub^(1/par2)
}
if (par2 < 0) {
olb <- lb
lb <- ub
ub <- olb
}
(actandfor <- c(x[1:nx], forecast$pred))
(perc.se <- (ub-forecast$pred)/1.96/forecast$pred)
bitmap(file='test1.png')
opar <- par(mar=c(4,4,2,2),las=1)
ylim <- c( min(x[first:nx],lb), max(x[first:nx],ub))
plot(x,ylim=ylim,type='n',xlim=c(first,lx))
usr <- par('usr')
rect(usr[1],usr[3],nx+1,usr[4],border=NA,col='lemonchiffon')
rect(nx1,usr[3],usr[2],usr[4],border=NA,col='lavender')
abline(h= (-3:3)*2 , col ='gray', lty =3)
polygon( c(nx1:lx,lx:nx1), c(lb,rev(ub)), col = 'orange', lty=2,border=NA)
lines(nx1:lx, lb , lty=2)
lines(nx1:lx, ub , lty=2)
lines(x, lwd=2)
lines(nx1:lx, forecast$pred , lwd=2 , col ='white')
box()
par(opar)
dev.off()
prob.dec <- array(NA, dim=fx)
prob.sdec <- array(NA, dim=fx)
prob.ldec <- array(NA, dim=fx)
prob.pval <- array(NA, dim=fx)
perf.pe <- array(0, dim=fx)
perf.mape <- array(0, dim=fx)
perf.se <- array(0, dim=fx)
perf.mse <- array(0, dim=fx)
perf.rmse <- array(0, dim=fx)
for (i in 1:fx) {
locSD <- (ub[i] - forecast$pred[i]) / 1.96
perf.pe[i] = (x[nx+i] - forecast$pred[i]) / forecast$pred[i]
perf.mape[i] = perf.mape[i] + abs(perf.pe[i])
perf.se[i] = (x[nx+i] - forecast$pred[i])^2
perf.mse[i] = perf.mse[i] + perf.se[i]
prob.dec[i] = pnorm((x[nx+i-1] - forecast$pred[i]) / locSD)
prob.sdec[i] = pnorm((x[nx+i-par5] - forecast$pred[i]) / locSD)
prob.ldec[i] = pnorm((x[nx] - forecast$pred[i]) / locSD)
prob.pval[i] = pnorm(abs(x[nx+i] - forecast$pred[i]) / locSD)
}
perf.mape = perf.mape / fx
perf.mse = perf.mse / fx
perf.rmse = sqrt(perf.mse)
bitmap(file='test2.png')
plot(forecast$pred, pch=19, type='b',main='ARIMA Extrapolation Forecast', ylab='Forecast and 95% CI', xlab='time',ylim=c(min(lb),max(ub)))
dum <- forecast$pred
dum[1:12] <- x[(nx+1):lx]
lines(dum, lty=1)
lines(ub,lty=3)
lines(lb,lty=3)
dev.off()
load(file='createtable')
a<-table.start()
a<-table.row.start(a)
a<-table.element(a,'Univariate ARIMA Extrapolation Forecast',9,TRUE)
a<-table.row.end(a)
a<-table.row.start(a)
a<-table.element(a,'time',1,header=TRUE)
a<-table.element(a,'Y[t]',1,header=TRUE)
a<-table.element(a,'F[t]',1,header=TRUE)
a<-table.element(a,'95% LB',1,header=TRUE)
a<-table.element(a,'95% UB',1,header=TRUE)
a<-table.element(a,'p-value
(H0: Y[t] = F[t])',1,header=TRUE)
a<-table.element(a,'P(F[t]>Y[t-1])',1,header=TRUE)
a<-table.element(a,'P(F[t]>Y[t-s])',1,header=TRUE)
mylab <- paste('P(F[t]>Y[',nx,sep='')
mylab <- paste(mylab,'])',sep='')
a<-table.element(a,mylab,1,header=TRUE)
a<-table.row.end(a)
for (i in (nx-par5):nx) {
a<-table.row.start(a)
a<-table.element(a,i,header=TRUE)
a<-table.element(a,x[i])
a<-table.element(a,'-')
a<-table.row.end(a)
}
for (i in 1:fx) {
a<-table.row.start(a)
a<-table.element(a,nx+i,header=TRUE)
a<-table.element(a,round(x[nx+i],4))
a<-table.element(a,round(forecast$pred[i],4))
a<-table.element(a,round(lb[i],4))
a<-table.element(a,round(ub[i],4))
a<-table.element(a,round((1-prob.pval[i]),4))
a<-table.element(a,round((1-prob.dec[i]),4))
a<-table.element(a,round((1-prob.sdec[i]),4))
a<-table.element(a,round((1-prob.ldec[i]),4))
a<-table.row.end(a)
}
a<-table.end(a)
table.save(a,file='mytable.tab')
a<-table.start()
a<-table.row.start(a)
a<-table.element(a,'Univariate ARIMA Extrapolation Forecast Performance',7,TRUE)
a<-table.row.end(a)
a<-table.row.start(a)
a<-table.element(a,'time',1,header=TRUE)
a<-table.element(a,'% S.E.',1,header=TRUE)
a<-table.element(a,'PE',1,header=TRUE)
a<-table.element(a,'MAPE',1,header=TRUE)
a<-table.element(a,'Sq.E',1,header=TRUE)
a<-table.element(a,'MSE',1,header=TRUE)
a<-table.element(a,'RMSE',1,header=TRUE)
a<-table.row.end(a)
for (i in 1:fx) {
a<-table.row.start(a)
a<-table.element(a,nx+i,header=TRUE)
a<-table.element(a,round(perc.se[i],4))
a<-table.element(a,round(perf.pe[i],4))
a<-table.element(a,round(perf.mape[i],4))
a<-table.element(a,round(perf.se[i],4))
a<-table.element(a,round(perf.mse[i],4))
a<-table.element(a,round(perf.rmse[i],4))
a<-table.row.end(a)
}
a<-table.end(a)
table.save(a,file='mytable1.tab')