Free Statistics

of Irreproducible Research!

Author's title

Author*The author of this computation has been verified*
R Software Modulerwasp_arimaforecasting.wasp
Title produced by softwareARIMA Forecasting
Date of computationTue, 16 Dec 2008 09:14:23 -0700
Cite this page as followsStatistical Computations at FreeStatistics.org, Office for Research Development and Education, URL https://freestatistics.org/blog/index.php?v=date/2008/Dec/16/t12294441867kaj55iqdbwf55f.htm/, Retrieved Sun, 19 May 2024 10:08:46 +0000
Statistical Computations at FreeStatistics.org, Office for Research Development and Education, URL https://freestatistics.org/blog/index.php?pk=34003, Retrieved Sun, 19 May 2024 10:08:46 +0000
QR Codes:

Original text written by user:
IsPrivate?No (this computation is public)
User-defined keywords
Estimated Impact153
Family? (F = Feedback message, R = changed R code, M = changed R Module, P = changed Parameters, D = changed Data)
F       [ARIMA Forecasting] [opdracht 6 ] [2008-12-16 16:14:23] [f7fbcd402030df685d3fe4ce577d7846] [Current]
Feedback Forum
2008-12-18 12:38:39 [Stefan Temmerman] [reply
Step 1: De student antwoord naast de kwestie. De voorspelling gedraagt zich volledig zoals verwacht. De AR processen zijn stabiel en de MA processen zijn invertibel. Er is met andere woorden geen sprake van explosiviteit. De voorspellingen gaan bijvoorbeeld niet ineens naar + of – oneindig. Dit nemen we waar op de grafiek, en ook in de tabellen, waarover in de volgende stappen meer.

Step 2: Opnieuw geen duidelijk antwoord op de vraag. De forecast zegt ons dat er een stijgende trend is. Dit zien we aan de kolommen P(F[t]>Y[t-s]), P(F[t]>Y[85]). Ze staan respectievelijk voor de kans dat de waarneming groter is dan dezelfde maand vorig jaar en de kans dat de waarneming groter is dan de eerste voorspelde. Deze is in alle drie vrij groot en duidt op stijgende waarden naargelang de maanden. De kolom P(F[t]>Y[t-1]) staat voor de kans dat de volgende waarneming groter is als de vorige, deze verspringt hier af en toe, en leidt zo tot een bewijs voor seizoenaliteit.

Step 3: Hier wordt wel gekeken naar de juiste kolommen door de student, en wordt een juiste conclusie gemaakt. De waarden zijn niet hoog, en de PE overschrijdt de %SE niet, wat zegt dat het model goed is. De uitschuiver op 135 kan duiden op een invloed van buitenaf, wat het model niet meerekent omdat het ceteris paribus is. Deze voorspelling zou bijkomend onderzoek nodig hebben.

Step 4: De vraag is niet beantwoord. Hier gaan we kijken naar de kolommen P(F[t]>Y[t-1]), P(F[t]>Y[t-s]) en P(F[t]>Y[85]). Deze zeggen respectievelijk de kans dat de voorspellingswaarde groter is als de vorige, de kans dat de voorspellingswaarde groter is als dezelfde maand van het vorige jaar en de kans dat de voorspellingswaarde groter is als het begin van de voorspelling. De onderliggende assumpties veronderstellen dat in de residus geen autocorrelatie meer voorkomt en dat deze normaal verdeeld zijn en dat de spreiding ervan constant is. Het gemiddelde van de residus moet gelijk zijn aan nul. Dit kunnen we testen in bv de module arima backward selection dat een ACF, PACF, Q-Q plot, Density Plot en histogram van de residus weergeeft.

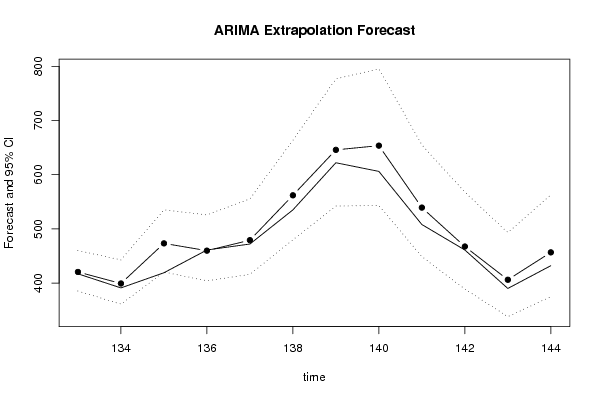
Step 5: De conclusie van de student is heel bondig, maar wel correct. Op de ARIMA extrapolation forecast zien we dat de grafiek goed samenloopt met de voorspellingen.
2008-12-22 17:19:22 [Gert-Jan Geudens] [reply
Step 1 : Het antwoord van de student is niet helemaal correct. Er is geen sprake van explosiviteit aangezien de AR-processen stabiel zijn en aangezien de MA-processen invertibel zijn. Je had hier misschien ook even kort de laatste kolommen kunnen overlopen :

P(F[t]>Y[t-1]) = Dit is de waarschijnlijkheid dat de voorspelde waarde groter is dan vorige gekende waarde.
P(F[t]>Y[t-s]) = Dit is de kans dat de waarde die we voorspellen, groter is dan de werkelijke waarde van dezelfde maand van het vorige jaar.
P(F[t]>Y[132]) = Dit is de kans dat we een grotere waarde zullen voorspellen dan de laatst gekende waarde

Step 2 :
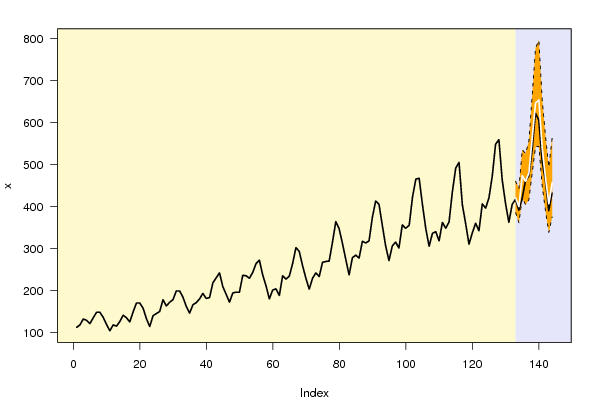
Niet helemaal volledig, We willen nog vermelden dat in de eerste grafiek de zwarte lijn de werkelijke waarden voorstellen.Het oranje vlak op het einde is het 95% betrouwbaarheidsinterval en de witte lijn is de eigenlijke voorspelling.

Step 3 : Foutieve conclusie. De eerste kolom is slechts de geschatte standaardfout. In de tweede kolom staat de werkelijke standaardfout. Deze werkelijke standaardfout is nog kleiner en dus is het een goed model.

Step 4 : Geen antwoord gegeven. De assumpties kunnen we controleren door naar de residu's te kijken bij de ARIMA Backward selection. Dit is reeds uitvoerig besproken in de vorige workshop.

Step 5 : Goede conclusie, al had nog wel wat meer argumentatie kunnen geven
2008-12-23 09:17:28 [Katrijn Truyman] [reply
STEP 1: we kijken naar de drie laatste kolommen van de eerste tabel. P(F[t]>Y[t-1]) geeft de waarschijnlijkheid dat er een stijging is t.o.v. de vorige maand. P(F[t]>Y[t-s]) is de waarschijnlijkheid dat de waarde groter is dan exact 1 jaar geleden (12m). P(F[t]>Y[132]) toont de waarschijnlijkheid dat de waarde groter is dan de laatst gekende maand (hier: maand 132).
We kunnen ook kijken naar de SE en PE in de tweede tabel. SE is de procentuele standaardafwijking van de voorspelde waarden, PE geeft de procentuele fout van de werkelijke waarden. We kijken in welke mate deze twee kolommen overeenkomen.
STEP 2: De voorspelling ligt binnen het betrouwbaarheidsinterval (zie grafieken 1 en 2), dwz dat er geen significant verschil is met de werkelijke waarden. Beide curven vallen ongeveer samen, dus er is een goede voorspelling gemaakt. Er is een stijgende trend, maar geen seizonaliteit.
STEP 3: Het verschil tussen SE en PE is zeer klein en de werkelijke standaardfout is kleiner dan de voorspelde fout, dus er is een goede voorspelling gemaakt. Hoe verder we in de toekomst gaan voorspellen, hoe groter de standaardafwijking wordt, omdat we steeds onzekerderd worden ivm met de toekomst. we weten namelijk niet wat er zich in de toekomst gaat voordoen.
STEP 4: geen antwoord gegeven. voor een antwoord op deze vraag, moeten we kijken naar de 3 laatste kolommen uit tabel 1.
STEP 5: Er is een goede voorspelling gemaakt. Dit kan je zien aan de p-waarde in tabel 1, aan tabel 2 (SE en PE) en aan de grafieken.
2008-12-24 09:44:52 [Sofie Mertens] [reply
Step 1: Het antwoord geeft uitleg over hoe men te werk gaat, maar beantwoord de vraag niet. De voorspelling verloopt niet explosief. Dus kunnen we concluderen dat de AR en MA processen niet onstabiel of onomkeerbaar zijn.
Step 2: Ook hier geeft men uitleg bij de grafieken, maar beantwoordt men de vraag niet. We zien duidelijk dat er een stijgende trend aanwezig is. De pieken doen ons vermoeden dat er ook sprake is van seizoenaliteit.
Step 3: Correct antwoord. Het feit dat S.E. > PE kan men interpreteren als een invloed van buitenaf op de tijdreeks.
Step 4: Deze vraag werd niet beantwoord. De 3 laatste kolommen van de 1ste tabel gaven ons hier het antwoord op volgende vragen: wat is de kans op een stijging ten opzichte van vorige periode/vorig jaar/de laatst gekende waarde?
Step 5: Korte, maar correcte conclusie.

Post a new message
Dataseries X:
112
118
132
129
121
135
148
148
136
119
104
118
115
126
141
135
125
149
170
170
158
133
114
140
145
150
178
163
172
178
199
199
184
162
146
166
171
180
193
181
183
218
230
242
209
191
172
194
196
196
236
235
229
243
264
272
237
211
180
201
204
188
235
227
234
264
302
293
259
229
203
229
242
233
267
269
270
315
364
347
312
274
237
278
284
277
317
313
318
374
413
405
355
306
271
306
315
301
356
348
355
422
465
467
404
347
305
336
340
318
362
348
363
435
491
505
404
359
310
337
360
342
406
396
420
472
548
559
463
407
362
405
417
391
419
461
472
535
622
606
508
461
390
432


Summary of computational transaction
Raw Inputview raw input (R code)
Raw Outputview raw output of R engine
Computing time2 seconds
R Server'Gwilym Jenkins' @ 72.249.127.135

\begin{tabular}{lllllllll}
\hline
Summary of computational transaction \tabularnewline
Raw Input & view raw input (R code)  \tabularnewline
Raw Output & view raw output of R engine  \tabularnewline
Computing time & 2 seconds \tabularnewline
R Server & 'Gwilym Jenkins' @ 72.249.127.135 \tabularnewline
\hline
\end{tabular}
%Source: https://freestatistics.org/blog/index.php?pk=34003&T=0

[TABLE]
[ROW][C]Summary of computational transaction[/C][/ROW]
[ROW][C]Raw Input[/C][C]view raw input (R code) [/C][/ROW]
[ROW][C]Raw Output[/C][C]view raw output of R engine [/C][/ROW]
[ROW][C]Computing time[/C][C]2 seconds[/C][/ROW]
[ROW][C]R Server[/C][C]'Gwilym Jenkins' @ 72.249.127.135[/C][/ROW]
[/TABLE]
Source: https://freestatistics.org/blog/index.php?pk=34003&T=0

Globally Unique Identifier (entire table): ba.freestatistics.org/blog/index.php?pk=34003&T=0

As an alternative you can also use a QR Code:  

The GUIDs for individual cells are displayed in the table below:

Summary of computational transaction
Raw Inputview raw input (R code)
Raw Outputview raw output of R engine
Computing time2 seconds
R Server'Gwilym Jenkins' @ 72.249.127.135


Univariate ARIMA Extrapolation Forecast
timeY[t]F[t]95% LB95% UBp-value(H0: Y[t] = F[t])P(F[t]>Y[t-1])P(F[t]>Y[t-s])P(F[t]>Y[132])
120337-------
121360-------
122342-------
123406-------
124396-------
125420-------
126472-------
127548-------
128559-------
129463-------
130407-------
131362-------
132405-------
133417420.4376385.2234459.9540.43230.77810.99860.7781
134391399.1493361.0418442.65540.35680.21060.9950.3961
135419473.1677420.2928535.02660.04310.99540.98330.9846
136461459.762404.1038525.81170.48530.88680.97080.9479
137472479.1007415.9796555.26150.42750.67930.93590.9717
138535561.8519479.5594663.48750.30230.95840.95840.9988
139622645.7644542.0887776.76630.36110.95130.92820.9998
140606653.5451543.1045795.05290.25510.66890.90480.9997
141508539.2133448.8089654.79360.29830.12870.90190.9886
142461467.3323388.8733567.67860.45080.21350.88070.8883
143390406.0529337.9633493.1080.35890.1080.83940.5095
144432456.5858374.9333562.94780.32530.89010.82910.8291

\begin{tabular}{lllllllll}
\hline
Univariate ARIMA Extrapolation Forecast \tabularnewline
time & Y[t] & F[t] & 95% LB & 95% UB & p-value(H0: Y[t] = F[t]) & P(F[t]>Y[t-1]) & P(F[t]>Y[t-s]) & P(F[t]>Y[132]) \tabularnewline
120 & 337 & - & - & - & - & - & - & - \tabularnewline
121 & 360 & - & - & - & - & - & - & - \tabularnewline
122 & 342 & - & - & - & - & - & - & - \tabularnewline
123 & 406 & - & - & - & - & - & - & - \tabularnewline
124 & 396 & - & - & - & - & - & - & - \tabularnewline
125 & 420 & - & - & - & - & - & - & - \tabularnewline
126 & 472 & - & - & - & - & - & - & - \tabularnewline
127 & 548 & - & - & - & - & - & - & - \tabularnewline
128 & 559 & - & - & - & - & - & - & - \tabularnewline
129 & 463 & - & - & - & - & - & - & - \tabularnewline
130 & 407 & - & - & - & - & - & - & - \tabularnewline
131 & 362 & - & - & - & - & - & - & - \tabularnewline
132 & 405 & - & - & - & - & - & - & - \tabularnewline
133 & 417 & 420.4376 & 385.2234 & 459.954 & 0.4323 & 0.7781 & 0.9986 & 0.7781 \tabularnewline
134 & 391 & 399.1493 & 361.0418 & 442.6554 & 0.3568 & 0.2106 & 0.995 & 0.3961 \tabularnewline
135 & 419 & 473.1677 & 420.2928 & 535.0266 & 0.0431 & 0.9954 & 0.9833 & 0.9846 \tabularnewline
136 & 461 & 459.762 & 404.1038 & 525.8117 & 0.4853 & 0.8868 & 0.9708 & 0.9479 \tabularnewline
137 & 472 & 479.1007 & 415.9796 & 555.2615 & 0.4275 & 0.6793 & 0.9359 & 0.9717 \tabularnewline
138 & 535 & 561.8519 & 479.5594 & 663.4875 & 0.3023 & 0.9584 & 0.9584 & 0.9988 \tabularnewline
139 & 622 & 645.7644 & 542.0887 & 776.7663 & 0.3611 & 0.9513 & 0.9282 & 0.9998 \tabularnewline
140 & 606 & 653.5451 & 543.1045 & 795.0529 & 0.2551 & 0.6689 & 0.9048 & 0.9997 \tabularnewline
141 & 508 & 539.2133 & 448.8089 & 654.7936 & 0.2983 & 0.1287 & 0.9019 & 0.9886 \tabularnewline
142 & 461 & 467.3323 & 388.8733 & 567.6786 & 0.4508 & 0.2135 & 0.8807 & 0.8883 \tabularnewline
143 & 390 & 406.0529 & 337.9633 & 493.108 & 0.3589 & 0.108 & 0.8394 & 0.5095 \tabularnewline
144 & 432 & 456.5858 & 374.9333 & 562.9478 & 0.3253 & 0.8901 & 0.8291 & 0.8291 \tabularnewline
\hline
\end{tabular}
%Source: https://freestatistics.org/blog/index.php?pk=34003&T=1

[TABLE]
[ROW][C]Univariate ARIMA Extrapolation Forecast[/C][/ROW]
[ROW][C]time[/C][C]Y[t][/C][C]F[t][/C][C]95% LB[/C][C]95% UB[/C][C]p-value(H0: Y[t] = F[t])[/C][C]P(F[t]>Y[t-1])[/C][C]P(F[t]>Y[t-s])[/C][C]P(F[t]>Y[132])[/C][/ROW]
[ROW][C]120[/C][C]337[/C][C]-[/C][C]-[/C][C]-[/C][C]-[/C][C]-[/C][C]-[/C][C]-[/C][/ROW]
[ROW][C]121[/C][C]360[/C][C]-[/C][C]-[/C][C]-[/C][C]-[/C][C]-[/C][C]-[/C][C]-[/C][/ROW]
[ROW][C]122[/C][C]342[/C][C]-[/C][C]-[/C][C]-[/C][C]-[/C][C]-[/C][C]-[/C][C]-[/C][/ROW]
[ROW][C]123[/C][C]406[/C][C]-[/C][C]-[/C][C]-[/C][C]-[/C][C]-[/C][C]-[/C][C]-[/C][/ROW]
[ROW][C]124[/C][C]396[/C][C]-[/C][C]-[/C][C]-[/C][C]-[/C][C]-[/C][C]-[/C][C]-[/C][/ROW]
[ROW][C]125[/C][C]420[/C][C]-[/C][C]-[/C][C]-[/C][C]-[/C][C]-[/C][C]-[/C][C]-[/C][/ROW]
[ROW][C]126[/C][C]472[/C][C]-[/C][C]-[/C][C]-[/C][C]-[/C][C]-[/C][C]-[/C][C]-[/C][/ROW]
[ROW][C]127[/C][C]548[/C][C]-[/C][C]-[/C][C]-[/C][C]-[/C][C]-[/C][C]-[/C][C]-[/C][/ROW]
[ROW][C]128[/C][C]559[/C][C]-[/C][C]-[/C][C]-[/C][C]-[/C][C]-[/C][C]-[/C][C]-[/C][/ROW]
[ROW][C]129[/C][C]463[/C][C]-[/C][C]-[/C][C]-[/C][C]-[/C][C]-[/C][C]-[/C][C]-[/C][/ROW]
[ROW][C]130[/C][C]407[/C][C]-[/C][C]-[/C][C]-[/C][C]-[/C][C]-[/C][C]-[/C][C]-[/C][/ROW]
[ROW][C]131[/C][C]362[/C][C]-[/C][C]-[/C][C]-[/C][C]-[/C][C]-[/C][C]-[/C][C]-[/C][/ROW]
[ROW][C]132[/C][C]405[/C][C]-[/C][C]-[/C][C]-[/C][C]-[/C][C]-[/C][C]-[/C][C]-[/C][/ROW]
[ROW][C]133[/C][C]417[/C][C]420.4376[/C][C]385.2234[/C][C]459.954[/C][C]0.4323[/C][C]0.7781[/C][C]0.9986[/C][C]0.7781[/C][/ROW]
[ROW][C]134[/C][C]391[/C][C]399.1493[/C][C]361.0418[/C][C]442.6554[/C][C]0.3568[/C][C]0.2106[/C][C]0.995[/C][C]0.3961[/C][/ROW]
[ROW][C]135[/C][C]419[/C][C]473.1677[/C][C]420.2928[/C][C]535.0266[/C][C]0.0431[/C][C]0.9954[/C][C]0.9833[/C][C]0.9846[/C][/ROW]
[ROW][C]136[/C][C]461[/C][C]459.762[/C][C]404.1038[/C][C]525.8117[/C][C]0.4853[/C][C]0.8868[/C][C]0.9708[/C][C]0.9479[/C][/ROW]
[ROW][C]137[/C][C]472[/C][C]479.1007[/C][C]415.9796[/C][C]555.2615[/C][C]0.4275[/C][C]0.6793[/C][C]0.9359[/C][C]0.9717[/C][/ROW]
[ROW][C]138[/C][C]535[/C][C]561.8519[/C][C]479.5594[/C][C]663.4875[/C][C]0.3023[/C][C]0.9584[/C][C]0.9584[/C][C]0.9988[/C][/ROW]
[ROW][C]139[/C][C]622[/C][C]645.7644[/C][C]542.0887[/C][C]776.7663[/C][C]0.3611[/C][C]0.9513[/C][C]0.9282[/C][C]0.9998[/C][/ROW]
[ROW][C]140[/C][C]606[/C][C]653.5451[/C][C]543.1045[/C][C]795.0529[/C][C]0.2551[/C][C]0.6689[/C][C]0.9048[/C][C]0.9997[/C][/ROW]
[ROW][C]141[/C][C]508[/C][C]539.2133[/C][C]448.8089[/C][C]654.7936[/C][C]0.2983[/C][C]0.1287[/C][C]0.9019[/C][C]0.9886[/C][/ROW]
[ROW][C]142[/C][C]461[/C][C]467.3323[/C][C]388.8733[/C][C]567.6786[/C][C]0.4508[/C][C]0.2135[/C][C]0.8807[/C][C]0.8883[/C][/ROW]
[ROW][C]143[/C][C]390[/C][C]406.0529[/C][C]337.9633[/C][C]493.108[/C][C]0.3589[/C][C]0.108[/C][C]0.8394[/C][C]0.5095[/C][/ROW]
[ROW][C]144[/C][C]432[/C][C]456.5858[/C][C]374.9333[/C][C]562.9478[/C][C]0.3253[/C][C]0.8901[/C][C]0.8291[/C][C]0.8291[/C][/ROW]
[/TABLE]
Source: https://freestatistics.org/blog/index.php?pk=34003&T=1

Globally Unique Identifier (entire table): ba.freestatistics.org/blog/index.php?pk=34003&T=1

As an alternative you can also use a QR Code:  

The GUIDs for individual cells are displayed in the table below:

Univariate ARIMA Extrapolation Forecast
timeY[t]F[t]95% LB95% UBp-value(H0: Y[t] = F[t])P(F[t]>Y[t-1])P(F[t]>Y[t-s])P(F[t]>Y[132])
120337-------
121360-------
122342-------
123406-------
124396-------
125420-------
126472-------
127548-------
128559-------
129463-------
130407-------
131362-------
132405-------
133417420.4376385.2234459.9540.43230.77810.99860.7781
134391399.1493361.0418442.65540.35680.21060.9950.3961
135419473.1677420.2928535.02660.04310.99540.98330.9846
136461459.762404.1038525.81170.48530.88680.97080.9479
137472479.1007415.9796555.26150.42750.67930.93590.9717
138535561.8519479.5594663.48750.30230.95840.95840.9988
139622645.7644542.0887776.76630.36110.95130.92820.9998
140606653.5451543.1045795.05290.25510.66890.90480.9997
141508539.2133448.8089654.79360.29830.12870.90190.9886
142461467.3323388.8733567.67860.45080.21350.88070.8883
143390406.0529337.9633493.1080.35890.1080.83940.5095
144432456.5858374.9333562.94780.32530.89010.82910.8291


Univariate ARIMA Extrapolation Forecast Performance
time% S.E.PEMAPESq.EMSERMSE
1330.048-0.00827e-0411.81740.98480.9924
1340.0556-0.02040.001766.41095.53422.3525
1350.0667-0.11450.00952934.1384244.511515.6369
1360.07330.00272e-041.53270.12770.3574
1370.0811-0.01480.001250.42064.20172.0498
1380.0923-0.04780.004721.022860.08527.7515
1390.1035-0.03680.0031564.749147.06246.8602
1400.1105-0.07270.00612260.5365188.37813.7251
1410.1094-0.05790.0048974.267281.18899.0105
1420.1096-0.01350.001140.09833.34151.828
1430.1094-0.03950.0033257.694521.47454.6341
1440.1189-0.05380.0045604.463350.37197.0973

\begin{tabular}{lllllllll}
\hline
Univariate ARIMA Extrapolation Forecast Performance \tabularnewline
time & % S.E. & PE & MAPE & Sq.E & MSE & RMSE \tabularnewline
133 & 0.048 & -0.0082 & 7e-04 & 11.8174 & 0.9848 & 0.9924 \tabularnewline
134 & 0.0556 & -0.0204 & 0.0017 & 66.4109 & 5.5342 & 2.3525 \tabularnewline
135 & 0.0667 & -0.1145 & 0.0095 & 2934.1384 & 244.5115 & 15.6369 \tabularnewline
136 & 0.0733 & 0.0027 & 2e-04 & 1.5327 & 0.1277 & 0.3574 \tabularnewline
137 & 0.0811 & -0.0148 & 0.0012 & 50.4206 & 4.2017 & 2.0498 \tabularnewline
138 & 0.0923 & -0.0478 & 0.004 & 721.0228 & 60.0852 & 7.7515 \tabularnewline
139 & 0.1035 & -0.0368 & 0.0031 & 564.7491 & 47.0624 & 6.8602 \tabularnewline
140 & 0.1105 & -0.0727 & 0.0061 & 2260.5365 & 188.378 & 13.7251 \tabularnewline
141 & 0.1094 & -0.0579 & 0.0048 & 974.2672 & 81.1889 & 9.0105 \tabularnewline
142 & 0.1096 & -0.0135 & 0.0011 & 40.0983 & 3.3415 & 1.828 \tabularnewline
143 & 0.1094 & -0.0395 & 0.0033 & 257.6945 & 21.4745 & 4.6341 \tabularnewline
144 & 0.1189 & -0.0538 & 0.0045 & 604.4633 & 50.3719 & 7.0973 \tabularnewline
\hline
\end{tabular}
%Source: https://freestatistics.org/blog/index.php?pk=34003&T=2

[TABLE]
[ROW][C]Univariate ARIMA Extrapolation Forecast Performance[/C][/ROW]
[ROW][C]time[/C][C]% S.E.[/C][C]PE[/C][C]MAPE[/C][C]Sq.E[/C][C]MSE[/C][C]RMSE[/C][/ROW]
[ROW][C]133[/C][C]0.048[/C][C]-0.0082[/C][C]7e-04[/C][C]11.8174[/C][C]0.9848[/C][C]0.9924[/C][/ROW]
[ROW][C]134[/C][C]0.0556[/C][C]-0.0204[/C][C]0.0017[/C][C]66.4109[/C][C]5.5342[/C][C]2.3525[/C][/ROW]
[ROW][C]135[/C][C]0.0667[/C][C]-0.1145[/C][C]0.0095[/C][C]2934.1384[/C][C]244.5115[/C][C]15.6369[/C][/ROW]
[ROW][C]136[/C][C]0.0733[/C][C]0.0027[/C][C]2e-04[/C][C]1.5327[/C][C]0.1277[/C][C]0.3574[/C][/ROW]
[ROW][C]137[/C][C]0.0811[/C][C]-0.0148[/C][C]0.0012[/C][C]50.4206[/C][C]4.2017[/C][C]2.0498[/C][/ROW]
[ROW][C]138[/C][C]0.0923[/C][C]-0.0478[/C][C]0.004[/C][C]721.0228[/C][C]60.0852[/C][C]7.7515[/C][/ROW]
[ROW][C]139[/C][C]0.1035[/C][C]-0.0368[/C][C]0.0031[/C][C]564.7491[/C][C]47.0624[/C][C]6.8602[/C][/ROW]
[ROW][C]140[/C][C]0.1105[/C][C]-0.0727[/C][C]0.0061[/C][C]2260.5365[/C][C]188.378[/C][C]13.7251[/C][/ROW]
[ROW][C]141[/C][C]0.1094[/C][C]-0.0579[/C][C]0.0048[/C][C]974.2672[/C][C]81.1889[/C][C]9.0105[/C][/ROW]
[ROW][C]142[/C][C]0.1096[/C][C]-0.0135[/C][C]0.0011[/C][C]40.0983[/C][C]3.3415[/C][C]1.828[/C][/ROW]
[ROW][C]143[/C][C]0.1094[/C][C]-0.0395[/C][C]0.0033[/C][C]257.6945[/C][C]21.4745[/C][C]4.6341[/C][/ROW]
[ROW][C]144[/C][C]0.1189[/C][C]-0.0538[/C][C]0.0045[/C][C]604.4633[/C][C]50.3719[/C][C]7.0973[/C][/ROW]
[/TABLE]
Source: https://freestatistics.org/blog/index.php?pk=34003&T=2

Globally Unique Identifier (entire table): ba.freestatistics.org/blog/index.php?pk=34003&T=2

As an alternative you can also use a QR Code:  

The GUIDs for individual cells are displayed in the table below:

Univariate ARIMA Extrapolation Forecast Performance
time% S.E.PEMAPESq.EMSERMSE
1330.048-0.00827e-0411.81740.98480.9924
1340.0556-0.02040.001766.41095.53422.3525
1350.0667-0.11450.00952934.1384244.511515.6369
1360.07330.00272e-041.53270.12770.3574
1370.0811-0.01480.001250.42064.20172.0498
1380.0923-0.04780.004721.022860.08527.7515
1390.1035-0.03680.0031564.749147.06246.8602
1400.1105-0.07270.00612260.5365188.37813.7251
1410.1094-0.05790.0048974.267281.18899.0105
1420.1096-0.01350.001140.09833.34151.828
1430.1094-0.03950.0033257.694521.47454.6341
1440.1189-0.05380.0045604.463350.37197.0973


Parameters (Session):
par1 = 12 ; par2 = -0.3 ; par3 = 1 ; par4 = 1 ; par5 = 12 ; par6 = 0 ; par7 = 1 ; par8 = 0 ; par9 = 1 ; par10 = FALSE ;
Parameters (R input):
par1 = 12 ; par2 = -0.3 ; par3 = 1 ; par4 = 1 ; par5 = 12 ; par6 = 0 ; par7 = 1 ; par8 = 0 ; par9 = 1 ; par10 = FALSE ;
R code (references can be found in the software module):
par1 <- as.numeric(par1) #cut off periods
par2 <- as.numeric(par2) #lambda
par3 <- as.numeric(par3) #degree of non-seasonal differencing
par4 <- as.numeric(par4) #degree of seasonal differencing
par5 <- as.numeric(par5) #seasonal period
par6 <- as.numeric(par6) #p
par7 <- as.numeric(par7) #q
par8 <- as.numeric(par8) #P
par9 <- as.numeric(par9) #Q
if (par10 == 'TRUE') par10 <- TRUE
if (par10 == 'FALSE') par10 <- FALSE
if (par2 == 0) x <- log(x)
if (par2 != 0) x <- x^par2
lx <- length(x)
first <- lx - 2*par1
nx <- lx - par1
nx1 <- nx + 1
fx <- lx - nx
if (fx < 1) {
fx <- par5
nx1 <- lx + fx - 1
first <- lx - 2*fx
}
first <- 1
if (fx < 3) fx <- round(lx/10,0)
(arima.out <- arima(x[1:nx], order=c(par6,par3,par7), seasonal=list(order=c(par8,par4,par9), period=par5), include.mean=par10, method='ML'))
(forecast <- predict(arima.out,fx))
(lb <- forecast$pred - 1.96 * forecast$se)
(ub <- forecast$pred + 1.96 * forecast$se)
if (par2 == 0) {
x <- exp(x)
forecast$pred <- exp(forecast$pred)
lb <- exp(lb)
ub <- exp(ub)
}
if (par2 != 0) {
x <- x^(1/par2)
forecast$pred <- forecast$pred^(1/par2)
lb <- lb^(1/par2)
ub <- ub^(1/par2)
}
if (par2 < 0) {
olb <- lb
lb <- ub
ub <- olb
}
(actandfor <- c(x[1:nx], forecast$pred))
(perc.se <- (ub-forecast$pred)/1.96/forecast$pred)
bitmap(file='test1.png')
opar <- par(mar=c(4,4,2,2),las=1)
ylim <- c( min(x[first:nx],lb), max(x[first:nx],ub))
plot(x,ylim=ylim,type='n',xlim=c(first,lx))
usr <- par('usr')
rect(usr[1],usr[3],nx+1,usr[4],border=NA,col='lemonchiffon')
rect(nx1,usr[3],usr[2],usr[4],border=NA,col='lavender')
abline(h= (-3:3)*2 , col ='gray', lty =3)
polygon( c(nx1:lx,lx:nx1), c(lb,rev(ub)), col = 'orange', lty=2,border=NA)
lines(nx1:lx, lb , lty=2)
lines(nx1:lx, ub , lty=2)
lines(x, lwd=2)
lines(nx1:lx, forecast$pred , lwd=2 , col ='white')
box()
par(opar)
dev.off()
prob.dec <- array(NA, dim=fx)
prob.sdec <- array(NA, dim=fx)
prob.ldec <- array(NA, dim=fx)
prob.pval <- array(NA, dim=fx)
perf.pe <- array(0, dim=fx)
perf.mape <- array(0, dim=fx)
perf.se <- array(0, dim=fx)
perf.mse <- array(0, dim=fx)
perf.rmse <- array(0, dim=fx)
for (i in 1:fx) {
locSD <- (ub[i] - forecast$pred[i]) / 1.96
perf.pe[i] = (x[nx+i] - forecast$pred[i]) / forecast$pred[i]
perf.mape[i] = perf.mape[i] + abs(perf.pe[i])
perf.se[i] = (x[nx+i] - forecast$pred[i])^2
perf.mse[i] = perf.mse[i] + perf.se[i]
prob.dec[i] = pnorm((x[nx+i-1] - forecast$pred[i]) / locSD)
prob.sdec[i] = pnorm((x[nx+i-par5] - forecast$pred[i]) / locSD)
prob.ldec[i] = pnorm((x[nx] - forecast$pred[i]) / locSD)
prob.pval[i] = pnorm(abs(x[nx+i] - forecast$pred[i]) / locSD)
}
perf.mape = perf.mape / fx
perf.mse = perf.mse / fx
perf.rmse = sqrt(perf.mse)
bitmap(file='test2.png')
plot(forecast$pred, pch=19, type='b',main='ARIMA Extrapolation Forecast', ylab='Forecast and 95% CI', xlab='time',ylim=c(min(lb),max(ub)))
dum <- forecast$pred
dum[1:12] <- x[(nx+1):lx]
lines(dum, lty=1)
lines(ub,lty=3)
lines(lb,lty=3)
dev.off()
load(file='createtable')
a<-table.start()
a<-table.row.start(a)
a<-table.element(a,'Univariate ARIMA Extrapolation Forecast',9,TRUE)
a<-table.row.end(a)
a<-table.row.start(a)
a<-table.element(a,'time',1,header=TRUE)
a<-table.element(a,'Y[t]',1,header=TRUE)
a<-table.element(a,'F[t]',1,header=TRUE)
a<-table.element(a,'95% LB',1,header=TRUE)
a<-table.element(a,'95% UB',1,header=TRUE)
a<-table.element(a,'p-value
(H0: Y[t] = F[t])',1,header=TRUE)
a<-table.element(a,'P(F[t]>Y[t-1])',1,header=TRUE)
a<-table.element(a,'P(F[t]>Y[t-s])',1,header=TRUE)
mylab <- paste('P(F[t]>Y[',nx,sep='')
mylab <- paste(mylab,'])',sep='')
a<-table.element(a,mylab,1,header=TRUE)
a<-table.row.end(a)
for (i in (nx-par5):nx) {
a<-table.row.start(a)
a<-table.element(a,i,header=TRUE)
a<-table.element(a,x[i])
a<-table.element(a,'-')
a<-table.row.end(a)
}
for (i in 1:fx) {
a<-table.row.start(a)
a<-table.element(a,nx+i,header=TRUE)
a<-table.element(a,round(x[nx+i],4))
a<-table.element(a,round(forecast$pred[i],4))
a<-table.element(a,round(lb[i],4))
a<-table.element(a,round(ub[i],4))
a<-table.element(a,round((1-prob.pval[i]),4))
a<-table.element(a,round((1-prob.dec[i]),4))
a<-table.element(a,round((1-prob.sdec[i]),4))
a<-table.element(a,round((1-prob.ldec[i]),4))
a<-table.row.end(a)
}
a<-table.end(a)
table.save(a,file='mytable.tab')
a<-table.start()
a<-table.row.start(a)
a<-table.element(a,'Univariate ARIMA Extrapolation Forecast Performance',7,TRUE)
a<-table.row.end(a)
a<-table.row.start(a)
a<-table.element(a,'time',1,header=TRUE)
a<-table.element(a,'% S.E.',1,header=TRUE)
a<-table.element(a,'PE',1,header=TRUE)
a<-table.element(a,'MAPE',1,header=TRUE)
a<-table.element(a,'Sq.E',1,header=TRUE)
a<-table.element(a,'MSE',1,header=TRUE)
a<-table.element(a,'RMSE',1,header=TRUE)
a<-table.row.end(a)
for (i in 1:fx) {
a<-table.row.start(a)
a<-table.element(a,nx+i,header=TRUE)
a<-table.element(a,round(perc.se[i],4))
a<-table.element(a,round(perf.pe[i],4))
a<-table.element(a,round(perf.mape[i],4))
a<-table.element(a,round(perf.se[i],4))
a<-table.element(a,round(perf.mse[i],4))
a<-table.element(a,round(perf.rmse[i],4))
a<-table.row.end(a)
}
a<-table.end(a)
table.save(a,file='mytable1.tab')