Free Statistics

of Irreproducible Research!

Author's title

Author*The author of this computation has been verified*
R Software Modulerwasp_autocorrelation.wasp
Title produced by software(Partial) Autocorrelation Function
Date of computationTue, 16 Dec 2008 04:51:37 -0700
Cite this page as followsStatistical Computations at FreeStatistics.org, Office for Research Development and Education, URL https://freestatistics.org/blog/index.php?v=date/2008/Dec/16/t1229428449ub2qustqk1cx5g4.htm/, Retrieved Sun, 19 May 2024 12:17:04 +0000
Statistical Computations at FreeStatistics.org, Office for Research Development and Education, URL https://freestatistics.org/blog/index.php?pk=33923, Retrieved Sun, 19 May 2024 12:17:04 +0000
QR Codes:

Original text written by user:
IsPrivate?No (this computation is public)
User-defined keywords
Estimated Impact213
Family? (F = Feedback message, R = changed R code, M = changed R Module, P = changed Parameters, D = changed Data)
-     [Univariate Data Series] [data set] [2008-12-01 19:54:57] [b98453cac15ba1066b407e146608df68]
F RMP   [(Partial) Autocorrelation Function] [ACF] [2008-12-08 11:23:44] [7173087adebe3e3a714c80ea2417b3eb]
-   PD      [(Partial) Autocorrelation Function] [(P) ACF - Totale ...] [2008-12-16 11:51:37] [c0a347e3519123f7eef62b705326dad9] [Current]
-   PD        [(Partial) Autocorrelation Function] [(P) ACF - Totale ...] [2008-12-16 11:56:43] [29747f79f5beb5b2516e1271770ecb47]
Feedback Forum

Post a new message
Dataseries X:
15044.5
14944.2
16754.8
14254
15454.9
15644.8
14568.3
12520.2
14803
15873.2
14755.3
12875.1
14291.1
14205.3
15859.4
15258.9
15498.6
15106.5
15023.6
12083
15761.3
16943
15070.3
13659.6
14768.9
14725.1
15998.1
15370.6
14956.9
15469.7
15101.8
11703.7
16283.6
16726.5
14968.9
14861
14583.3
15305.8
17903.9
16379.4
15420.3
17870.5
15912.8
13866.5
17823.2
17872
17420.4
16704.4
15991.2
16583.6
19123.5
17838.7
17209.4
18586.5
16258.1
15141.6
19202.1
17746.5
19090.1
18040.3
17515.5
17751.8
21072.4
17170
19439.5
19795.4
17574.9
16165.4
19464.6
19932.1
19961.2
17343.4
18924.2
18574.1
21350.6
18594.6
19823.1
20844.4
19640.2
17735.4
19813.6
22160
20664.3
17877.4
21211.2
21423.1
21688.7
23243.2
21490.2
22925.8
23184.8
18562.2


Summary of computational transaction
Raw Inputview raw input (R code)
Raw Outputview raw output of R engine
Computing time1 seconds
R Server'Gwilym Jenkins' @ 72.249.127.135

\begin{tabular}{lllllllll}
\hline
Summary of computational transaction \tabularnewline
Raw Input & view raw input (R code)  \tabularnewline
Raw Output & view raw output of R engine  \tabularnewline
Computing time & 1 seconds \tabularnewline
R Server & 'Gwilym Jenkins' @ 72.249.127.135 \tabularnewline
\hline
\end{tabular}
%Source: https://freestatistics.org/blog/index.php?pk=33923&T=0

[TABLE]
[ROW][C]Summary of computational transaction[/C][/ROW]
[ROW][C]Raw Input[/C][C]view raw input (R code) [/C][/ROW]
[ROW][C]Raw Output[/C][C]view raw output of R engine [/C][/ROW]
[ROW][C]Computing time[/C][C]1 seconds[/C][/ROW]
[ROW][C]R Server[/C][C]'Gwilym Jenkins' @ 72.249.127.135[/C][/ROW]
[/TABLE]
Source: https://freestatistics.org/blog/index.php?pk=33923&T=0

Globally Unique Identifier (entire table): ba.freestatistics.org/blog/index.php?pk=33923&T=0

As an alternative you can also use a QR Code:  

The GUIDs for individual cells are displayed in the table below:

Summary of computational transaction
Raw Inputview raw input (R code)
Raw Outputview raw output of R engine
Computing time1 seconds
R Server'Gwilym Jenkins' @ 72.249.127.135


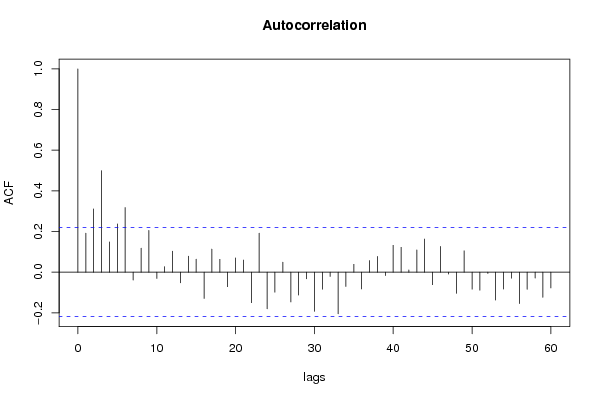
Autocorrelation Function
Time lag kACF(k)T-STATP-value
10.1916761.71440.045163
20.3112792.78420.003348
30.4989934.46311.3e-05
40.1487411.33040.093587
50.2371882.12150.018489
60.3175952.84070.002854
7-0.039342-0.35190.362924
80.1178891.05440.14743
90.2054961.8380.034887
10-0.030802-0.27550.391822
110.0270740.24220.40464
120.1033180.92410.179106
13-0.052397-0.46870.320297
140.0782520.69990.243007
150.0635060.5680.285808
16-0.129814-1.16110.124529
170.1132551.0130.157062
180.0632310.56560.28664
19-0.071482-0.63940.262209
200.0699660.62580.266616
210.059420.53150.298282
22-0.150328-1.34460.091282
230.1916151.71390.045214
24-0.180589-1.61520.055099
25-0.098706-0.88290.189981
260.0490370.43860.331067
27-0.146583-1.31110.096792
28-0.112841-1.00930.157942
29-0.032701-0.29250.385334
30-0.192661-1.72320.044357
31-0.083872-0.75020.227675
32-0.020967-0.18750.425857
33-0.204904-1.83270.035283
34-0.070542-0.63090.264937
350.0387120.34630.365032
36-0.082614-0.73890.231058
370.0570490.51030.305638
380.0773530.69190.245513
39-0.016826-0.15050.440376
400.132151.1820.120356
410.1220931.0920.139049
420.0108510.09710.461462
430.1091210.9760.166001
440.1628281.45640.0746
45-0.061845-0.55320.290849
460.1261721.12850.131237
47-0.009804-0.08770.465173
48-0.104337-0.93320.176758
490.1050980.940.175017
50-0.083687-0.74850.22817
51-0.08881-0.79430.214674
52-0.006657-0.05950.476335
53-0.137641-1.23110.110946
54-0.083313-0.74520.229176
55-0.029973-0.26810.39466
56-0.154805-1.38460.085009
57-0.08436-0.75450.22637
58-0.028931-0.25880.398241
59-0.124037-1.10940.135285
60-0.077924-0.6970.243919

\begin{tabular}{lllllllll}
\hline
Autocorrelation Function \tabularnewline
Time lag k & ACF(k) & T-STAT & P-value \tabularnewline
1 & 0.191676 & 1.7144 & 0.045163 \tabularnewline
2 & 0.311279 & 2.7842 & 0.003348 \tabularnewline
3 & 0.498993 & 4.4631 & 1.3e-05 \tabularnewline
4 & 0.148741 & 1.3304 & 0.093587 \tabularnewline
5 & 0.237188 & 2.1215 & 0.018489 \tabularnewline
6 & 0.317595 & 2.8407 & 0.002854 \tabularnewline
7 & -0.039342 & -0.3519 & 0.362924 \tabularnewline
8 & 0.117889 & 1.0544 & 0.14743 \tabularnewline
9 & 0.205496 & 1.838 & 0.034887 \tabularnewline
10 & -0.030802 & -0.2755 & 0.391822 \tabularnewline
11 & 0.027074 & 0.2422 & 0.40464 \tabularnewline
12 & 0.103318 & 0.9241 & 0.179106 \tabularnewline
13 & -0.052397 & -0.4687 & 0.320297 \tabularnewline
14 & 0.078252 & 0.6999 & 0.243007 \tabularnewline
15 & 0.063506 & 0.568 & 0.285808 \tabularnewline
16 & -0.129814 & -1.1611 & 0.124529 \tabularnewline
17 & 0.113255 & 1.013 & 0.157062 \tabularnewline
18 & 0.063231 & 0.5656 & 0.28664 \tabularnewline
19 & -0.071482 & -0.6394 & 0.262209 \tabularnewline
20 & 0.069966 & 0.6258 & 0.266616 \tabularnewline
21 & 0.05942 & 0.5315 & 0.298282 \tabularnewline
22 & -0.150328 & -1.3446 & 0.091282 \tabularnewline
23 & 0.191615 & 1.7139 & 0.045214 \tabularnewline
24 & -0.180589 & -1.6152 & 0.055099 \tabularnewline
25 & -0.098706 & -0.8829 & 0.189981 \tabularnewline
26 & 0.049037 & 0.4386 & 0.331067 \tabularnewline
27 & -0.146583 & -1.3111 & 0.096792 \tabularnewline
28 & -0.112841 & -1.0093 & 0.157942 \tabularnewline
29 & -0.032701 & -0.2925 & 0.385334 \tabularnewline
30 & -0.192661 & -1.7232 & 0.044357 \tabularnewline
31 & -0.083872 & -0.7502 & 0.227675 \tabularnewline
32 & -0.020967 & -0.1875 & 0.425857 \tabularnewline
33 & -0.204904 & -1.8327 & 0.035283 \tabularnewline
34 & -0.070542 & -0.6309 & 0.264937 \tabularnewline
35 & 0.038712 & 0.3463 & 0.365032 \tabularnewline
36 & -0.082614 & -0.7389 & 0.231058 \tabularnewline
37 & 0.057049 & 0.5103 & 0.305638 \tabularnewline
38 & 0.077353 & 0.6919 & 0.245513 \tabularnewline
39 & -0.016826 & -0.1505 & 0.440376 \tabularnewline
40 & 0.13215 & 1.182 & 0.120356 \tabularnewline
41 & 0.122093 & 1.092 & 0.139049 \tabularnewline
42 & 0.010851 & 0.0971 & 0.461462 \tabularnewline
43 & 0.109121 & 0.976 & 0.166001 \tabularnewline
44 & 0.162828 & 1.4564 & 0.0746 \tabularnewline
45 & -0.061845 & -0.5532 & 0.290849 \tabularnewline
46 & 0.126172 & 1.1285 & 0.131237 \tabularnewline
47 & -0.009804 & -0.0877 & 0.465173 \tabularnewline
48 & -0.104337 & -0.9332 & 0.176758 \tabularnewline
49 & 0.105098 & 0.94 & 0.175017 \tabularnewline
50 & -0.083687 & -0.7485 & 0.22817 \tabularnewline
51 & -0.08881 & -0.7943 & 0.214674 \tabularnewline
52 & -0.006657 & -0.0595 & 0.476335 \tabularnewline
53 & -0.137641 & -1.2311 & 0.110946 \tabularnewline
54 & -0.083313 & -0.7452 & 0.229176 \tabularnewline
55 & -0.029973 & -0.2681 & 0.39466 \tabularnewline
56 & -0.154805 & -1.3846 & 0.085009 \tabularnewline
57 & -0.08436 & -0.7545 & 0.22637 \tabularnewline
58 & -0.028931 & -0.2588 & 0.398241 \tabularnewline
59 & -0.124037 & -1.1094 & 0.135285 \tabularnewline
60 & -0.077924 & -0.697 & 0.243919 \tabularnewline
\hline
\end{tabular}
%Source: https://freestatistics.org/blog/index.php?pk=33923&T=1

[TABLE]
[ROW][C]Autocorrelation Function[/C][/ROW]
[ROW][C]Time lag k[/C][C]ACF(k)[/C][C]T-STAT[/C][C]P-value[/C][/ROW]
[ROW][C]1[/C][C]0.191676[/C][C]1.7144[/C][C]0.045163[/C][/ROW]
[ROW][C]2[/C][C]0.311279[/C][C]2.7842[/C][C]0.003348[/C][/ROW]
[ROW][C]3[/C][C]0.498993[/C][C]4.4631[/C][C]1.3e-05[/C][/ROW]
[ROW][C]4[/C][C]0.148741[/C][C]1.3304[/C][C]0.093587[/C][/ROW]
[ROW][C]5[/C][C]0.237188[/C][C]2.1215[/C][C]0.018489[/C][/ROW]
[ROW][C]6[/C][C]0.317595[/C][C]2.8407[/C][C]0.002854[/C][/ROW]
[ROW][C]7[/C][C]-0.039342[/C][C]-0.3519[/C][C]0.362924[/C][/ROW]
[ROW][C]8[/C][C]0.117889[/C][C]1.0544[/C][C]0.14743[/C][/ROW]
[ROW][C]9[/C][C]0.205496[/C][C]1.838[/C][C]0.034887[/C][/ROW]
[ROW][C]10[/C][C]-0.030802[/C][C]-0.2755[/C][C]0.391822[/C][/ROW]
[ROW][C]11[/C][C]0.027074[/C][C]0.2422[/C][C]0.40464[/C][/ROW]
[ROW][C]12[/C][C]0.103318[/C][C]0.9241[/C][C]0.179106[/C][/ROW]
[ROW][C]13[/C][C]-0.052397[/C][C]-0.4687[/C][C]0.320297[/C][/ROW]
[ROW][C]14[/C][C]0.078252[/C][C]0.6999[/C][C]0.243007[/C][/ROW]
[ROW][C]15[/C][C]0.063506[/C][C]0.568[/C][C]0.285808[/C][/ROW]
[ROW][C]16[/C][C]-0.129814[/C][C]-1.1611[/C][C]0.124529[/C][/ROW]
[ROW][C]17[/C][C]0.113255[/C][C]1.013[/C][C]0.157062[/C][/ROW]
[ROW][C]18[/C][C]0.063231[/C][C]0.5656[/C][C]0.28664[/C][/ROW]
[ROW][C]19[/C][C]-0.071482[/C][C]-0.6394[/C][C]0.262209[/C][/ROW]
[ROW][C]20[/C][C]0.069966[/C][C]0.6258[/C][C]0.266616[/C][/ROW]
[ROW][C]21[/C][C]0.05942[/C][C]0.5315[/C][C]0.298282[/C][/ROW]
[ROW][C]22[/C][C]-0.150328[/C][C]-1.3446[/C][C]0.091282[/C][/ROW]
[ROW][C]23[/C][C]0.191615[/C][C]1.7139[/C][C]0.045214[/C][/ROW]
[ROW][C]24[/C][C]-0.180589[/C][C]-1.6152[/C][C]0.055099[/C][/ROW]
[ROW][C]25[/C][C]-0.098706[/C][C]-0.8829[/C][C]0.189981[/C][/ROW]
[ROW][C]26[/C][C]0.049037[/C][C]0.4386[/C][C]0.331067[/C][/ROW]
[ROW][C]27[/C][C]-0.146583[/C][C]-1.3111[/C][C]0.096792[/C][/ROW]
[ROW][C]28[/C][C]-0.112841[/C][C]-1.0093[/C][C]0.157942[/C][/ROW]
[ROW][C]29[/C][C]-0.032701[/C][C]-0.2925[/C][C]0.385334[/C][/ROW]
[ROW][C]30[/C][C]-0.192661[/C][C]-1.7232[/C][C]0.044357[/C][/ROW]
[ROW][C]31[/C][C]-0.083872[/C][C]-0.7502[/C][C]0.227675[/C][/ROW]
[ROW][C]32[/C][C]-0.020967[/C][C]-0.1875[/C][C]0.425857[/C][/ROW]
[ROW][C]33[/C][C]-0.204904[/C][C]-1.8327[/C][C]0.035283[/C][/ROW]
[ROW][C]34[/C][C]-0.070542[/C][C]-0.6309[/C][C]0.264937[/C][/ROW]
[ROW][C]35[/C][C]0.038712[/C][C]0.3463[/C][C]0.365032[/C][/ROW]
[ROW][C]36[/C][C]-0.082614[/C][C]-0.7389[/C][C]0.231058[/C][/ROW]
[ROW][C]37[/C][C]0.057049[/C][C]0.5103[/C][C]0.305638[/C][/ROW]
[ROW][C]38[/C][C]0.077353[/C][C]0.6919[/C][C]0.245513[/C][/ROW]
[ROW][C]39[/C][C]-0.016826[/C][C]-0.1505[/C][C]0.440376[/C][/ROW]
[ROW][C]40[/C][C]0.13215[/C][C]1.182[/C][C]0.120356[/C][/ROW]
[ROW][C]41[/C][C]0.122093[/C][C]1.092[/C][C]0.139049[/C][/ROW]
[ROW][C]42[/C][C]0.010851[/C][C]0.0971[/C][C]0.461462[/C][/ROW]
[ROW][C]43[/C][C]0.109121[/C][C]0.976[/C][C]0.166001[/C][/ROW]
[ROW][C]44[/C][C]0.162828[/C][C]1.4564[/C][C]0.0746[/C][/ROW]
[ROW][C]45[/C][C]-0.061845[/C][C]-0.5532[/C][C]0.290849[/C][/ROW]
[ROW][C]46[/C][C]0.126172[/C][C]1.1285[/C][C]0.131237[/C][/ROW]
[ROW][C]47[/C][C]-0.009804[/C][C]-0.0877[/C][C]0.465173[/C][/ROW]
[ROW][C]48[/C][C]-0.104337[/C][C]-0.9332[/C][C]0.176758[/C][/ROW]
[ROW][C]49[/C][C]0.105098[/C][C]0.94[/C][C]0.175017[/C][/ROW]
[ROW][C]50[/C][C]-0.083687[/C][C]-0.7485[/C][C]0.22817[/C][/ROW]
[ROW][C]51[/C][C]-0.08881[/C][C]-0.7943[/C][C]0.214674[/C][/ROW]
[ROW][C]52[/C][C]-0.006657[/C][C]-0.0595[/C][C]0.476335[/C][/ROW]
[ROW][C]53[/C][C]-0.137641[/C][C]-1.2311[/C][C]0.110946[/C][/ROW]
[ROW][C]54[/C][C]-0.083313[/C][C]-0.7452[/C][C]0.229176[/C][/ROW]
[ROW][C]55[/C][C]-0.029973[/C][C]-0.2681[/C][C]0.39466[/C][/ROW]
[ROW][C]56[/C][C]-0.154805[/C][C]-1.3846[/C][C]0.085009[/C][/ROW]
[ROW][C]57[/C][C]-0.08436[/C][C]-0.7545[/C][C]0.22637[/C][/ROW]
[ROW][C]58[/C][C]-0.028931[/C][C]-0.2588[/C][C]0.398241[/C][/ROW]
[ROW][C]59[/C][C]-0.124037[/C][C]-1.1094[/C][C]0.135285[/C][/ROW]
[ROW][C]60[/C][C]-0.077924[/C][C]-0.697[/C][C]0.243919[/C][/ROW]
[/TABLE]
Source: https://freestatistics.org/blog/index.php?pk=33923&T=1

Globally Unique Identifier (entire table): ba.freestatistics.org/blog/index.php?pk=33923&T=1

As an alternative you can also use a QR Code:  

The GUIDs for individual cells are displayed in the table below:

Autocorrelation Function
Time lag kACF(k)T-STATP-value
10.1916761.71440.045163
20.3112792.78420.003348
30.4989934.46311.3e-05
40.1487411.33040.093587
50.2371882.12150.018489
60.3175952.84070.002854
7-0.039342-0.35190.362924
80.1178891.05440.14743
90.2054961.8380.034887
10-0.030802-0.27550.391822
110.0270740.24220.40464
120.1033180.92410.179106
13-0.052397-0.46870.320297
140.0782520.69990.243007
150.0635060.5680.285808
16-0.129814-1.16110.124529
170.1132551.0130.157062
180.0632310.56560.28664
19-0.071482-0.63940.262209
200.0699660.62580.266616
210.059420.53150.298282
22-0.150328-1.34460.091282
230.1916151.71390.045214
24-0.180589-1.61520.055099
25-0.098706-0.88290.189981
260.0490370.43860.331067
27-0.146583-1.31110.096792
28-0.112841-1.00930.157942
29-0.032701-0.29250.385334
30-0.192661-1.72320.044357
31-0.083872-0.75020.227675
32-0.020967-0.18750.425857
33-0.204904-1.83270.035283
34-0.070542-0.63090.264937
350.0387120.34630.365032
36-0.082614-0.73890.231058
370.0570490.51030.305638
380.0773530.69190.245513
39-0.016826-0.15050.440376
400.132151.1820.120356
410.1220931.0920.139049
420.0108510.09710.461462
430.1091210.9760.166001
440.1628281.45640.0746
45-0.061845-0.55320.290849
460.1261721.12850.131237
47-0.009804-0.08770.465173
48-0.104337-0.93320.176758
490.1050980.940.175017
50-0.083687-0.74850.22817
51-0.08881-0.79430.214674
52-0.006657-0.05950.476335
53-0.137641-1.23110.110946
54-0.083313-0.74520.229176
55-0.029973-0.26810.39466
56-0.154805-1.38460.085009
57-0.08436-0.75450.22637
58-0.028931-0.25880.398241
59-0.124037-1.10940.135285
60-0.077924-0.6970.243919


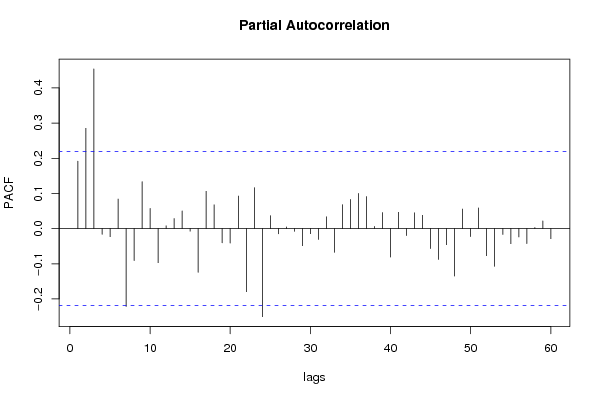
Partial Autocorrelation Function
Time lag kPACF(k)T-STATP-value
10.1916761.71440.045163
20.2850112.54920.006354
30.4538954.05985.7e-05
4-0.016292-0.14570.442255
5-0.02313-0.20690.418315
60.0841680.75280.226884
7-0.2214-1.98030.025556
8-0.09073-0.81150.209739
90.1332831.19210.11837
100.0574420.51380.304413
11-0.096899-0.86670.194353
120.0078050.06980.472258
130.0285290.25520.399624
140.0501760.44880.327401
15-0.007297-0.06530.474062
16-0.124374-1.11240.134641
170.1060910.94890.172764
180.0675640.60430.273674
19-0.040427-0.36160.359306
20-0.041172-0.36830.356827
210.0924230.82670.205446
22-0.179387-1.60450.056274
230.1162271.03960.150836
24-0.250315-2.23890.013971
250.0368950.330.371131
26-0.014972-0.13390.446903
270.0046350.04150.483518
28-0.007743-0.06930.472479
29-0.048609-0.43480.33245
30-0.014372-0.12850.449019
31-0.030915-0.27650.391435
320.0335310.29990.382513
33-0.06739-0.60280.27419
340.068030.60850.272297
350.082970.74210.230098
360.0999960.89440.186897
370.0912580.81620.208395
380.0062970.05630.477612
390.045620.4080.342169
40-0.08094-0.72390.235604
410.0464150.41510.339572
42-0.019795-0.1770.429959
430.0449280.40180.344433
440.0377830.33790.368147
45-0.05665-0.50670.306883
46-0.087636-0.78380.217723
47-0.045892-0.41050.34128
48-0.135003-1.20750.115398
490.0557280.49850.309767
50-0.022588-0.2020.420203
510.0588870.52670.299929
52-0.076823-0.68710.246996
53-0.1071-0.95790.170492
54-0.016451-0.14710.441696
55-0.043024-0.38480.350698
56-0.023619-0.21130.416613
57-0.042593-0.3810.352121
580.0029750.02660.489419
590.0217490.19450.423126
60-0.028701-0.25670.399032

\begin{tabular}{lllllllll}
\hline
Partial Autocorrelation Function \tabularnewline
Time lag k & PACF(k) & T-STAT & P-value \tabularnewline
1 & 0.191676 & 1.7144 & 0.045163 \tabularnewline
2 & 0.285011 & 2.5492 & 0.006354 \tabularnewline
3 & 0.453895 & 4.0598 & 5.7e-05 \tabularnewline
4 & -0.016292 & -0.1457 & 0.442255 \tabularnewline
5 & -0.02313 & -0.2069 & 0.418315 \tabularnewline
6 & 0.084168 & 0.7528 & 0.226884 \tabularnewline
7 & -0.2214 & -1.9803 & 0.025556 \tabularnewline
8 & -0.09073 & -0.8115 & 0.209739 \tabularnewline
9 & 0.133283 & 1.1921 & 0.11837 \tabularnewline
10 & 0.057442 & 0.5138 & 0.304413 \tabularnewline
11 & -0.096899 & -0.8667 & 0.194353 \tabularnewline
12 & 0.007805 & 0.0698 & 0.472258 \tabularnewline
13 & 0.028529 & 0.2552 & 0.399624 \tabularnewline
14 & 0.050176 & 0.4488 & 0.327401 \tabularnewline
15 & -0.007297 & -0.0653 & 0.474062 \tabularnewline
16 & -0.124374 & -1.1124 & 0.134641 \tabularnewline
17 & 0.106091 & 0.9489 & 0.172764 \tabularnewline
18 & 0.067564 & 0.6043 & 0.273674 \tabularnewline
19 & -0.040427 & -0.3616 & 0.359306 \tabularnewline
20 & -0.041172 & -0.3683 & 0.356827 \tabularnewline
21 & 0.092423 & 0.8267 & 0.205446 \tabularnewline
22 & -0.179387 & -1.6045 & 0.056274 \tabularnewline
23 & 0.116227 & 1.0396 & 0.150836 \tabularnewline
24 & -0.250315 & -2.2389 & 0.013971 \tabularnewline
25 & 0.036895 & 0.33 & 0.371131 \tabularnewline
26 & -0.014972 & -0.1339 & 0.446903 \tabularnewline
27 & 0.004635 & 0.0415 & 0.483518 \tabularnewline
28 & -0.007743 & -0.0693 & 0.472479 \tabularnewline
29 & -0.048609 & -0.4348 & 0.33245 \tabularnewline
30 & -0.014372 & -0.1285 & 0.449019 \tabularnewline
31 & -0.030915 & -0.2765 & 0.391435 \tabularnewline
32 & 0.033531 & 0.2999 & 0.382513 \tabularnewline
33 & -0.06739 & -0.6028 & 0.27419 \tabularnewline
34 & 0.06803 & 0.6085 & 0.272297 \tabularnewline
35 & 0.08297 & 0.7421 & 0.230098 \tabularnewline
36 & 0.099996 & 0.8944 & 0.186897 \tabularnewline
37 & 0.091258 & 0.8162 & 0.208395 \tabularnewline
38 & 0.006297 & 0.0563 & 0.477612 \tabularnewline
39 & 0.04562 & 0.408 & 0.342169 \tabularnewline
40 & -0.08094 & -0.7239 & 0.235604 \tabularnewline
41 & 0.046415 & 0.4151 & 0.339572 \tabularnewline
42 & -0.019795 & -0.177 & 0.429959 \tabularnewline
43 & 0.044928 & 0.4018 & 0.344433 \tabularnewline
44 & 0.037783 & 0.3379 & 0.368147 \tabularnewline
45 & -0.05665 & -0.5067 & 0.306883 \tabularnewline
46 & -0.087636 & -0.7838 & 0.217723 \tabularnewline
47 & -0.045892 & -0.4105 & 0.34128 \tabularnewline
48 & -0.135003 & -1.2075 & 0.115398 \tabularnewline
49 & 0.055728 & 0.4985 & 0.309767 \tabularnewline
50 & -0.022588 & -0.202 & 0.420203 \tabularnewline
51 & 0.058887 & 0.5267 & 0.299929 \tabularnewline
52 & -0.076823 & -0.6871 & 0.246996 \tabularnewline
53 & -0.1071 & -0.9579 & 0.170492 \tabularnewline
54 & -0.016451 & -0.1471 & 0.441696 \tabularnewline
55 & -0.043024 & -0.3848 & 0.350698 \tabularnewline
56 & -0.023619 & -0.2113 & 0.416613 \tabularnewline
57 & -0.042593 & -0.381 & 0.352121 \tabularnewline
58 & 0.002975 & 0.0266 & 0.489419 \tabularnewline
59 & 0.021749 & 0.1945 & 0.423126 \tabularnewline
60 & -0.028701 & -0.2567 & 0.399032 \tabularnewline
\hline
\end{tabular}
%Source: https://freestatistics.org/blog/index.php?pk=33923&T=2

[TABLE]
[ROW][C]Partial Autocorrelation Function[/C][/ROW]
[ROW][C]Time lag k[/C][C]PACF(k)[/C][C]T-STAT[/C][C]P-value[/C][/ROW]
[ROW][C]1[/C][C]0.191676[/C][C]1.7144[/C][C]0.045163[/C][/ROW]
[ROW][C]2[/C][C]0.285011[/C][C]2.5492[/C][C]0.006354[/C][/ROW]
[ROW][C]3[/C][C]0.453895[/C][C]4.0598[/C][C]5.7e-05[/C][/ROW]
[ROW][C]4[/C][C]-0.016292[/C][C]-0.1457[/C][C]0.442255[/C][/ROW]
[ROW][C]5[/C][C]-0.02313[/C][C]-0.2069[/C][C]0.418315[/C][/ROW]
[ROW][C]6[/C][C]0.084168[/C][C]0.7528[/C][C]0.226884[/C][/ROW]
[ROW][C]7[/C][C]-0.2214[/C][C]-1.9803[/C][C]0.025556[/C][/ROW]
[ROW][C]8[/C][C]-0.09073[/C][C]-0.8115[/C][C]0.209739[/C][/ROW]
[ROW][C]9[/C][C]0.133283[/C][C]1.1921[/C][C]0.11837[/C][/ROW]
[ROW][C]10[/C][C]0.057442[/C][C]0.5138[/C][C]0.304413[/C][/ROW]
[ROW][C]11[/C][C]-0.096899[/C][C]-0.8667[/C][C]0.194353[/C][/ROW]
[ROW][C]12[/C][C]0.007805[/C][C]0.0698[/C][C]0.472258[/C][/ROW]
[ROW][C]13[/C][C]0.028529[/C][C]0.2552[/C][C]0.399624[/C][/ROW]
[ROW][C]14[/C][C]0.050176[/C][C]0.4488[/C][C]0.327401[/C][/ROW]
[ROW][C]15[/C][C]-0.007297[/C][C]-0.0653[/C][C]0.474062[/C][/ROW]
[ROW][C]16[/C][C]-0.124374[/C][C]-1.1124[/C][C]0.134641[/C][/ROW]
[ROW][C]17[/C][C]0.106091[/C][C]0.9489[/C][C]0.172764[/C][/ROW]
[ROW][C]18[/C][C]0.067564[/C][C]0.6043[/C][C]0.273674[/C][/ROW]
[ROW][C]19[/C][C]-0.040427[/C][C]-0.3616[/C][C]0.359306[/C][/ROW]
[ROW][C]20[/C][C]-0.041172[/C][C]-0.3683[/C][C]0.356827[/C][/ROW]
[ROW][C]21[/C][C]0.092423[/C][C]0.8267[/C][C]0.205446[/C][/ROW]
[ROW][C]22[/C][C]-0.179387[/C][C]-1.6045[/C][C]0.056274[/C][/ROW]
[ROW][C]23[/C][C]0.116227[/C][C]1.0396[/C][C]0.150836[/C][/ROW]
[ROW][C]24[/C][C]-0.250315[/C][C]-2.2389[/C][C]0.013971[/C][/ROW]
[ROW][C]25[/C][C]0.036895[/C][C]0.33[/C][C]0.371131[/C][/ROW]
[ROW][C]26[/C][C]-0.014972[/C][C]-0.1339[/C][C]0.446903[/C][/ROW]
[ROW][C]27[/C][C]0.004635[/C][C]0.0415[/C][C]0.483518[/C][/ROW]
[ROW][C]28[/C][C]-0.007743[/C][C]-0.0693[/C][C]0.472479[/C][/ROW]
[ROW][C]29[/C][C]-0.048609[/C][C]-0.4348[/C][C]0.33245[/C][/ROW]
[ROW][C]30[/C][C]-0.014372[/C][C]-0.1285[/C][C]0.449019[/C][/ROW]
[ROW][C]31[/C][C]-0.030915[/C][C]-0.2765[/C][C]0.391435[/C][/ROW]
[ROW][C]32[/C][C]0.033531[/C][C]0.2999[/C][C]0.382513[/C][/ROW]
[ROW][C]33[/C][C]-0.06739[/C][C]-0.6028[/C][C]0.27419[/C][/ROW]
[ROW][C]34[/C][C]0.06803[/C][C]0.6085[/C][C]0.272297[/C][/ROW]
[ROW][C]35[/C][C]0.08297[/C][C]0.7421[/C][C]0.230098[/C][/ROW]
[ROW][C]36[/C][C]0.099996[/C][C]0.8944[/C][C]0.186897[/C][/ROW]
[ROW][C]37[/C][C]0.091258[/C][C]0.8162[/C][C]0.208395[/C][/ROW]
[ROW][C]38[/C][C]0.006297[/C][C]0.0563[/C][C]0.477612[/C][/ROW]
[ROW][C]39[/C][C]0.04562[/C][C]0.408[/C][C]0.342169[/C][/ROW]
[ROW][C]40[/C][C]-0.08094[/C][C]-0.7239[/C][C]0.235604[/C][/ROW]
[ROW][C]41[/C][C]0.046415[/C][C]0.4151[/C][C]0.339572[/C][/ROW]
[ROW][C]42[/C][C]-0.019795[/C][C]-0.177[/C][C]0.429959[/C][/ROW]
[ROW][C]43[/C][C]0.044928[/C][C]0.4018[/C][C]0.344433[/C][/ROW]
[ROW][C]44[/C][C]0.037783[/C][C]0.3379[/C][C]0.368147[/C][/ROW]
[ROW][C]45[/C][C]-0.05665[/C][C]-0.5067[/C][C]0.306883[/C][/ROW]
[ROW][C]46[/C][C]-0.087636[/C][C]-0.7838[/C][C]0.217723[/C][/ROW]
[ROW][C]47[/C][C]-0.045892[/C][C]-0.4105[/C][C]0.34128[/C][/ROW]
[ROW][C]48[/C][C]-0.135003[/C][C]-1.2075[/C][C]0.115398[/C][/ROW]
[ROW][C]49[/C][C]0.055728[/C][C]0.4985[/C][C]0.309767[/C][/ROW]
[ROW][C]50[/C][C]-0.022588[/C][C]-0.202[/C][C]0.420203[/C][/ROW]
[ROW][C]51[/C][C]0.058887[/C][C]0.5267[/C][C]0.299929[/C][/ROW]
[ROW][C]52[/C][C]-0.076823[/C][C]-0.6871[/C][C]0.246996[/C][/ROW]
[ROW][C]53[/C][C]-0.1071[/C][C]-0.9579[/C][C]0.170492[/C][/ROW]
[ROW][C]54[/C][C]-0.016451[/C][C]-0.1471[/C][C]0.441696[/C][/ROW]
[ROW][C]55[/C][C]-0.043024[/C][C]-0.3848[/C][C]0.350698[/C][/ROW]
[ROW][C]56[/C][C]-0.023619[/C][C]-0.2113[/C][C]0.416613[/C][/ROW]
[ROW][C]57[/C][C]-0.042593[/C][C]-0.381[/C][C]0.352121[/C][/ROW]
[ROW][C]58[/C][C]0.002975[/C][C]0.0266[/C][C]0.489419[/C][/ROW]
[ROW][C]59[/C][C]0.021749[/C][C]0.1945[/C][C]0.423126[/C][/ROW]
[ROW][C]60[/C][C]-0.028701[/C][C]-0.2567[/C][C]0.399032[/C][/ROW]
[/TABLE]
Source: https://freestatistics.org/blog/index.php?pk=33923&T=2

Globally Unique Identifier (entire table): ba.freestatistics.org/blog/index.php?pk=33923&T=2

As an alternative you can also use a QR Code:  

The GUIDs for individual cells are displayed in the table below:

Partial Autocorrelation Function
Time lag kPACF(k)T-STATP-value
10.1916761.71440.045163
20.2850112.54920.006354
30.4538954.05985.7e-05
4-0.016292-0.14570.442255
5-0.02313-0.20690.418315
60.0841680.75280.226884
7-0.2214-1.98030.025556
8-0.09073-0.81150.209739
90.1332831.19210.11837
100.0574420.51380.304413
11-0.096899-0.86670.194353
120.0078050.06980.472258
130.0285290.25520.399624
140.0501760.44880.327401
15-0.007297-0.06530.474062
16-0.124374-1.11240.134641
170.1060910.94890.172764
180.0675640.60430.273674
19-0.040427-0.36160.359306
20-0.041172-0.36830.356827
210.0924230.82670.205446
22-0.179387-1.60450.056274
230.1162271.03960.150836
24-0.250315-2.23890.013971
250.0368950.330.371131
26-0.014972-0.13390.446903
270.0046350.04150.483518
28-0.007743-0.06930.472479
29-0.048609-0.43480.33245
30-0.014372-0.12850.449019
31-0.030915-0.27650.391435
320.0335310.29990.382513
33-0.06739-0.60280.27419
340.068030.60850.272297
350.082970.74210.230098
360.0999960.89440.186897
370.0912580.81620.208395
380.0062970.05630.477612
390.045620.4080.342169
40-0.08094-0.72390.235604
410.0464150.41510.339572
42-0.019795-0.1770.429959
430.0449280.40180.344433
440.0377830.33790.368147
45-0.05665-0.50670.306883
46-0.087636-0.78380.217723
47-0.045892-0.41050.34128
48-0.135003-1.20750.115398
490.0557280.49850.309767
50-0.022588-0.2020.420203
510.0588870.52670.299929
52-0.076823-0.68710.246996
53-0.1071-0.95790.170492
54-0.016451-0.14710.441696
55-0.043024-0.38480.350698
56-0.023619-0.21130.416613
57-0.042593-0.3810.352121
580.0029750.02660.489419
590.0217490.19450.423126
60-0.028701-0.25670.399032


Parameters (Session):
par1 = 60 ; par2 = 0.4 ; par3 = 0 ; par4 = 1 ; par5 = 12 ;
Parameters (R input):
par1 = 60 ; par2 = 0.4 ; par3 = 0 ; par4 = 1 ; par5 = 12 ;
R code (references can be found in the software module):
if (par1 == 'Default') {
par1 = 10*log10(length(x))
} else {
par1 <- as.numeric(par1)
}
par2 <- as.numeric(par2)
par3 <- as.numeric(par3)
par4 <- as.numeric(par4)
par5 <- as.numeric(par5)
if (par2 == 0) {
x <- log(x)
} else {
x <- (x ^ par2 - 1) / par2
}
if (par3 > 0) x <- diff(x,lag=1,difference=par3)
if (par4 > 0) x <- diff(x,lag=par5,difference=par4)
bitmap(file='pic1.png')
racf <- acf(x,par1,main='Autocorrelation',xlab='lags',ylab='ACF')
dev.off()
bitmap(file='pic2.png')
rpacf <- pacf(x,par1,main='Partial Autocorrelation',xlab='lags',ylab='PACF')
dev.off()
(myacf <- c(racf$acf))
(mypacf <- c(rpacf$acf))
lengthx <- length(x)
sqrtn <- sqrt(lengthx)
load(file='createtable')
a<-table.start()
a<-table.row.start(a)
a<-table.element(a,'Autocorrelation Function',4,TRUE)
a<-table.row.end(a)
a<-table.row.start(a)
a<-table.element(a,'Time lag k',header=TRUE)
a<-table.element(a,hyperlink('basics.htm','ACF(k)','click here for more information about the Autocorrelation Function'),header=TRUE)
a<-table.element(a,'T-STAT',header=TRUE)
a<-table.element(a,'P-value',header=TRUE)
a<-table.row.end(a)
for (i in 2:(par1+1)) {
a<-table.row.start(a)
a<-table.element(a,i-1,header=TRUE)
a<-table.element(a,round(myacf[i],6))
mytstat <- myacf[i]*sqrtn
a<-table.element(a,round(mytstat,4))
a<-table.element(a,round(1-pt(abs(mytstat),lengthx),6))
a<-table.row.end(a)
}
a<-table.end(a)
table.save(a,file='mytable.tab')
a<-table.start()
a<-table.row.start(a)
a<-table.element(a,'Partial Autocorrelation Function',4,TRUE)
a<-table.row.end(a)
a<-table.row.start(a)
a<-table.element(a,'Time lag k',header=TRUE)
a<-table.element(a,hyperlink('basics.htm','PACF(k)','click here for more information about the Partial Autocorrelation Function'),header=TRUE)
a<-table.element(a,'T-STAT',header=TRUE)
a<-table.element(a,'P-value',header=TRUE)
a<-table.row.end(a)
for (i in 1:par1) {
a<-table.row.start(a)
a<-table.element(a,i,header=TRUE)
a<-table.element(a,round(mypacf[i],6))
mytstat <- mypacf[i]*sqrtn
a<-table.element(a,round(mytstat,4))
a<-table.element(a,round(1-pt(abs(mytstat),lengthx),6))
a<-table.row.end(a)
}
a<-table.end(a)
table.save(a,file='mytable1.tab')