Free Statistics

of Irreproducible Research!

Author's title

Author*The author of this computation has been verified*
R Software Modulerwasp_arimabackwardselection.wasp
Title produced by softwareARIMA Backward Selection
Date of computationTue, 16 Dec 2008 03:23:05 -0700
Cite this page as followsStatistical Computations at FreeStatistics.org, Office for Research Development and Education, URL https://freestatistics.org/blog/index.php?v=date/2008/Dec/16/t1229423036yqwk8fgp4ecvwjq.htm/, Retrieved Sun, 19 May 2024 11:12:32 +0000
Statistical Computations at FreeStatistics.org, Office for Research Development and Education, URL https://freestatistics.org/blog/index.php?pk=33896, Retrieved Sun, 19 May 2024 11:12:32 +0000
QR Codes:

Original text written by user:
IsPrivate?No (this computation is public)
User-defined keywords
Estimated Impact261
Family? (F = Feedback message, R = changed R code, M = changed R Module, P = changed Parameters, D = changed Data)
-     [Univariate Data Series] [Werkloosheid 50 e...] [2008-11-28 13:15:36] [6743688719638b0cb1c0a6e0bf433315]
-   P   [Univariate Data Series] [Unemployment from...] [2008-12-02 18:04:33] [6743688719638b0cb1c0a6e0bf433315]
- RMP       [ARIMA Backward Selection] [50+] [2008-12-16 10:23:05] [9b05d7ef5dbcfba4217d280d9092f628] [Current]
Feedback Forum

Post a new message
Dataseries X:
44028
45564
44277
44976
45406
47379
49200
50221
51573
53091
53337
54978
57885
67099
67169
69796
70600
71982
73957
75273
76322
77078
77954
79238
82179
83834
83744
84861
86478
88290
90287
91230
92380
92506
94172
94728
96581
97344
98346
98214
98366
98768
99832
99976
99961
100164
99964
99304
104008
104644
103950
104263
104241
105141
106018
105866
105944
106379
105082
104915
107026


Summary of computational transaction
Raw Inputview raw input (R code)
Raw Outputview raw output of R engine
Computing time5 seconds
R Server'Gwilym Jenkins' @ 72.249.127.135

\begin{tabular}{lllllllll}
\hline
Summary of computational transaction \tabularnewline
Raw Input & view raw input (R code)  \tabularnewline
Raw Output & view raw output of R engine  \tabularnewline
Computing time & 5 seconds \tabularnewline
R Server & 'Gwilym Jenkins' @ 72.249.127.135 \tabularnewline
\hline
\end{tabular}
%Source: https://freestatistics.org/blog/index.php?pk=33896&T=0

[TABLE]
[ROW][C]Summary of computational transaction[/C][/ROW]
[ROW][C]Raw Input[/C][C]view raw input (R code) [/C][/ROW]
[ROW][C]Raw Output[/C][C]view raw output of R engine [/C][/ROW]
[ROW][C]Computing time[/C][C]5 seconds[/C][/ROW]
[ROW][C]R Server[/C][C]'Gwilym Jenkins' @ 72.249.127.135[/C][/ROW]
[/TABLE]
Source: https://freestatistics.org/blog/index.php?pk=33896&T=0

Globally Unique Identifier (entire table): ba.freestatistics.org/blog/index.php?pk=33896&T=0

As an alternative you can also use a QR Code:  

The GUIDs for individual cells are displayed in the table below:

Summary of computational transaction
Raw Inputview raw input (R code)
Raw Outputview raw output of R engine
Computing time5 seconds
R Server'Gwilym Jenkins' @ 72.249.127.135


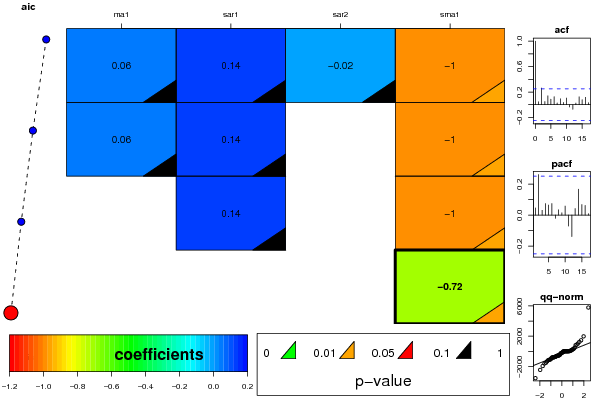
ARIMA Parameter Estimation and Backward Selection
Iterationma1sar1sar2sma1
Estimates ( 1 )0.05830.1362-0.0214-0.9999
(p-val)(0.6142 )(0.4971 )(0.9403 )(0.0452 )
Estimates ( 2 )0.05810.14380-1
(p-val)(0.6154 )(0.4088 )(NA )(0.0402 )
Estimates ( 3 )00.13970-1.0003
(p-val)(NA )(0.4207 )(NA )(0.0451 )
Estimates ( 4 )000-0.7172
(p-val)(NA )(NA )(NA )(0.013 )
Estimates ( 5 )NANANANA
(p-val)(NA )(NA )(NA )(NA )
Estimates ( 6 )NANANANA
(p-val)(NA )(NA )(NA )(NA )
Estimates ( 7 )NANANANA
(p-val)(NA )(NA )(NA )(NA )

\begin{tabular}{lllllllll}
\hline
ARIMA Parameter Estimation and Backward Selection \tabularnewline
Iteration & ma1 & sar1 & sar2 & sma1 \tabularnewline
Estimates ( 1 ) & 0.0583 & 0.1362 & -0.0214 & -0.9999 \tabularnewline
(p-val) & (0.6142 ) & (0.4971 ) & (0.9403 ) & (0.0452 ) \tabularnewline
Estimates ( 2 ) & 0.0581 & 0.1438 & 0 & -1 \tabularnewline
(p-val) & (0.6154 ) & (0.4088 ) & (NA ) & (0.0402 ) \tabularnewline
Estimates ( 3 ) & 0 & 0.1397 & 0 & -1.0003 \tabularnewline
(p-val) & (NA ) & (0.4207 ) & (NA ) & (0.0451 ) \tabularnewline
Estimates ( 4 ) & 0 & 0 & 0 & -0.7172 \tabularnewline
(p-val) & (NA ) & (NA ) & (NA ) & (0.013 ) \tabularnewline
Estimates ( 5 ) & NA & NA & NA & NA \tabularnewline
(p-val) & (NA ) & (NA ) & (NA ) & (NA ) \tabularnewline
Estimates ( 6 ) & NA & NA & NA & NA \tabularnewline
(p-val) & (NA ) & (NA ) & (NA ) & (NA ) \tabularnewline
Estimates ( 7 ) & NA & NA & NA & NA \tabularnewline
(p-val) & (NA ) & (NA ) & (NA ) & (NA ) \tabularnewline
\hline
\end{tabular}
%Source: https://freestatistics.org/blog/index.php?pk=33896&T=1

[TABLE]
[ROW][C]ARIMA Parameter Estimation and Backward Selection[/C][/ROW]
[ROW][C]Iteration[/C][C]ma1[/C][C]sar1[/C][C]sar2[/C][C]sma1[/C][/ROW]
[ROW][C]Estimates ( 1 )[/C][C]0.0583[/C][C]0.1362[/C][C]-0.0214[/C][C]-0.9999[/C][/ROW]
[ROW][C](p-val)[/C][C](0.6142 )[/C][C](0.4971 )[/C][C](0.9403 )[/C][C](0.0452 )[/C][/ROW]
[ROW][C]Estimates ( 2 )[/C][C]0.0581[/C][C]0.1438[/C][C]0[/C][C]-1[/C][/ROW]
[ROW][C](p-val)[/C][C](0.6154 )[/C][C](0.4088 )[/C][C](NA )[/C][C](0.0402 )[/C][/ROW]
[ROW][C]Estimates ( 3 )[/C][C]0[/C][C]0.1397[/C][C]0[/C][C]-1.0003[/C][/ROW]
[ROW][C](p-val)[/C][C](NA )[/C][C](0.4207 )[/C][C](NA )[/C][C](0.0451 )[/C][/ROW]
[ROW][C]Estimates ( 4 )[/C][C]0[/C][C]0[/C][C]0[/C][C]-0.7172[/C][/ROW]
[ROW][C](p-val)[/C][C](NA )[/C][C](NA )[/C][C](NA )[/C][C](0.013 )[/C][/ROW]
[ROW][C]Estimates ( 5 )[/C][C]NA[/C][C]NA[/C][C]NA[/C][C]NA[/C][/ROW]
[ROW][C](p-val)[/C][C](NA )[/C][C](NA )[/C][C](NA )[/C][C](NA )[/C][/ROW]
[ROW][C]Estimates ( 6 )[/C][C]NA[/C][C]NA[/C][C]NA[/C][C]NA[/C][/ROW]
[ROW][C](p-val)[/C][C](NA )[/C][C](NA )[/C][C](NA )[/C][C](NA )[/C][/ROW]
[ROW][C]Estimates ( 7 )[/C][C]NA[/C][C]NA[/C][C]NA[/C][C]NA[/C][/ROW]
[ROW][C](p-val)[/C][C](NA )[/C][C](NA )[/C][C](NA )[/C][C](NA )[/C][/ROW]
[/TABLE]
Source: https://freestatistics.org/blog/index.php?pk=33896&T=1

Globally Unique Identifier (entire table): ba.freestatistics.org/blog/index.php?pk=33896&T=1

As an alternative you can also use a QR Code:  

The GUIDs for individual cells are displayed in the table below:

ARIMA Parameter Estimation and Backward Selection
Iterationma1sar1sar2sma1
Estimates ( 1 )0.05830.1362-0.0214-0.9999
(p-val)(0.6142 )(0.4971 )(0.9403 )(0.0452 )
Estimates ( 2 )0.05810.14380-1
(p-val)(0.6154 )(0.4088 )(NA )(0.0402 )
Estimates ( 3 )00.13970-1.0003
(p-val)(NA )(0.4207 )(NA )(0.0451 )
Estimates ( 4 )000-0.7172
(p-val)(NA )(NA )(NA )(0.013 )
Estimates ( 5 )NANANANA
(p-val)(NA )(NA )(NA )(NA )
Estimates ( 6 )NANANANA
(p-val)(NA )(NA )(NA )(NA )
Estimates ( 7 )NANANANA
(p-val)(NA )(NA )(NA )(NA )


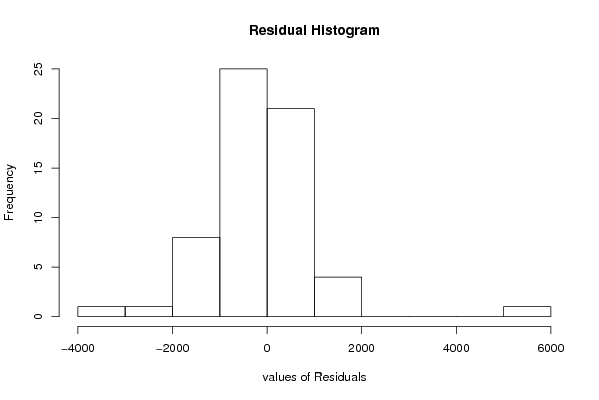
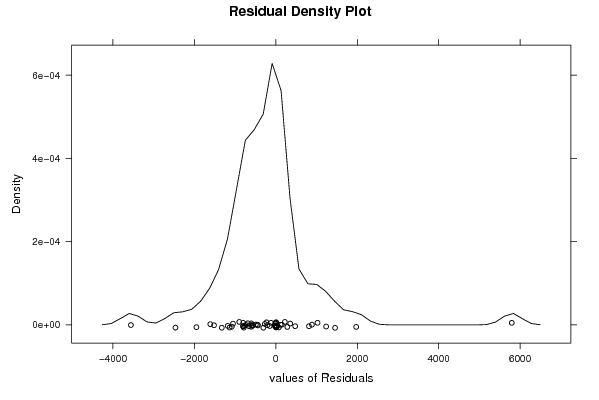
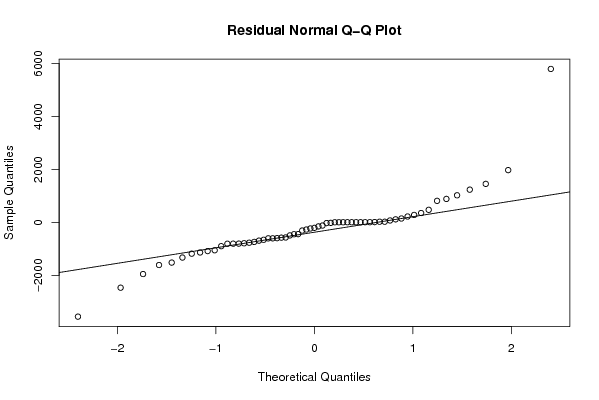
Estimated ARIMA Residuals
Value
-118.061944796416
5795.26080693979
1024.20598170655
1455.17622618410
282.213169613536
-446.179125749909
116.121381909248
222.527311570300
-228.858967491062
-575.331176466066
475.316604606196
-269.685103030923
25.3998124438176
-3558.77104033969
354.215254566916
-569.166670594794
814.191030135787
146.914210578796
73.7026793634436
-205.857432304263
-24.6236563437513
-800.889370986454
886.948941376037
-737.203840592001
-897.606507581069
-2465.25367251198
1236.63926368625
-1327.30367205375
-786.980305506044
-1181.08195556249
-766.603382557187
-805.709884442875
-1051.76311267630
-442.522909952726
-1082.37053653445
-1517.37514360715
1974.58191603584
-1950.14984406222
-688.579852230992
-490.572636876695
-594.197558378547
-306.999620141857
-656.795313387173
-802.789058785465
-600.606714310006
-150.319615481891
-1608.83671541976
-601.667586649662
-1135.23016543098

\begin{tabular}{lllllllll}
\hline
Estimated ARIMA Residuals \tabularnewline
Value \tabularnewline
-118.061944796416 \tabularnewline
5795.26080693979 \tabularnewline
1024.20598170655 \tabularnewline
1455.17622618410 \tabularnewline
282.213169613536 \tabularnewline
-446.179125749909 \tabularnewline
116.121381909248 \tabularnewline
222.527311570300 \tabularnewline
-228.858967491062 \tabularnewline
-575.331176466066 \tabularnewline
475.316604606196 \tabularnewline
-269.685103030923 \tabularnewline
25.3998124438176 \tabularnewline
-3558.77104033969 \tabularnewline
354.215254566916 \tabularnewline
-569.166670594794 \tabularnewline
814.191030135787 \tabularnewline
146.914210578796 \tabularnewline
73.7026793634436 \tabularnewline
-205.857432304263 \tabularnewline
-24.6236563437513 \tabularnewline
-800.889370986454 \tabularnewline
886.948941376037 \tabularnewline
-737.203840592001 \tabularnewline
-897.606507581069 \tabularnewline
-2465.25367251198 \tabularnewline
1236.63926368625 \tabularnewline
-1327.30367205375 \tabularnewline
-786.980305506044 \tabularnewline
-1181.08195556249 \tabularnewline
-766.603382557187 \tabularnewline
-805.709884442875 \tabularnewline
-1051.76311267630 \tabularnewline
-442.522909952726 \tabularnewline
-1082.37053653445 \tabularnewline
-1517.37514360715 \tabularnewline
1974.58191603584 \tabularnewline
-1950.14984406222 \tabularnewline
-688.579852230992 \tabularnewline
-490.572636876695 \tabularnewline
-594.197558378547 \tabularnewline
-306.999620141857 \tabularnewline
-656.795313387173 \tabularnewline
-802.789058785465 \tabularnewline
-600.606714310006 \tabularnewline
-150.319615481891 \tabularnewline
-1608.83671541976 \tabularnewline
-601.667586649662 \tabularnewline
-1135.23016543098 \tabularnewline
\hline
\end{tabular}
%Source: https://freestatistics.org/blog/index.php?pk=33896&T=2

[TABLE]
[ROW][C]Estimated ARIMA Residuals[/C][/ROW]
[ROW][C]Value[/C][/ROW]
[ROW][C]-118.061944796416[/C][/ROW]
[ROW][C]5795.26080693979[/C][/ROW]
[ROW][C]1024.20598170655[/C][/ROW]
[ROW][C]1455.17622618410[/C][/ROW]
[ROW][C]282.213169613536[/C][/ROW]
[ROW][C]-446.179125749909[/C][/ROW]
[ROW][C]116.121381909248[/C][/ROW]
[ROW][C]222.527311570300[/C][/ROW]
[ROW][C]-228.858967491062[/C][/ROW]
[ROW][C]-575.331176466066[/C][/ROW]
[ROW][C]475.316604606196[/C][/ROW]
[ROW][C]-269.685103030923[/C][/ROW]
[ROW][C]25.3998124438176[/C][/ROW]
[ROW][C]-3558.77104033969[/C][/ROW]
[ROW][C]354.215254566916[/C][/ROW]
[ROW][C]-569.166670594794[/C][/ROW]
[ROW][C]814.191030135787[/C][/ROW]
[ROW][C]146.914210578796[/C][/ROW]
[ROW][C]73.7026793634436[/C][/ROW]
[ROW][C]-205.857432304263[/C][/ROW]
[ROW][C]-24.6236563437513[/C][/ROW]
[ROW][C]-800.889370986454[/C][/ROW]
[ROW][C]886.948941376037[/C][/ROW]
[ROW][C]-737.203840592001[/C][/ROW]
[ROW][C]-897.606507581069[/C][/ROW]
[ROW][C]-2465.25367251198[/C][/ROW]
[ROW][C]1236.63926368625[/C][/ROW]
[ROW][C]-1327.30367205375[/C][/ROW]
[ROW][C]-786.980305506044[/C][/ROW]
[ROW][C]-1181.08195556249[/C][/ROW]
[ROW][C]-766.603382557187[/C][/ROW]
[ROW][C]-805.709884442875[/C][/ROW]
[ROW][C]-1051.76311267630[/C][/ROW]
[ROW][C]-442.522909952726[/C][/ROW]
[ROW][C]-1082.37053653445[/C][/ROW]
[ROW][C]-1517.37514360715[/C][/ROW]
[ROW][C]1974.58191603584[/C][/ROW]
[ROW][C]-1950.14984406222[/C][/ROW]
[ROW][C]-688.579852230992[/C][/ROW]
[ROW][C]-490.572636876695[/C][/ROW]
[ROW][C]-594.197558378547[/C][/ROW]
[ROW][C]-306.999620141857[/C][/ROW]
[ROW][C]-656.795313387173[/C][/ROW]
[ROW][C]-802.789058785465[/C][/ROW]
[ROW][C]-600.606714310006[/C][/ROW]
[ROW][C]-150.319615481891[/C][/ROW]
[ROW][C]-1608.83671541976[/C][/ROW]
[ROW][C]-601.667586649662[/C][/ROW]
[ROW][C]-1135.23016543098[/C][/ROW]
[/TABLE]
Source: https://freestatistics.org/blog/index.php?pk=33896&T=2

Globally Unique Identifier (entire table): ba.freestatistics.org/blog/index.php?pk=33896&T=2

As an alternative you can also use a QR Code:  

The GUIDs for individual cells are displayed in the table below:

Estimated ARIMA Residuals
Value
-118.061944796416
5795.26080693979
1024.20598170655
1455.17622618410
282.213169613536
-446.179125749909
116.121381909248
222.527311570300
-228.858967491062
-575.331176466066
475.316604606196
-269.685103030923
25.3998124438176
-3558.77104033969
354.215254566916
-569.166670594794
814.191030135787
146.914210578796
73.7026793634436
-205.857432304263
-24.6236563437513
-800.889370986454
886.948941376037
-737.203840592001
-897.606507581069
-2465.25367251198
1236.63926368625
-1327.30367205375
-786.980305506044
-1181.08195556249
-766.603382557187
-805.709884442875
-1051.76311267630
-442.522909952726
-1082.37053653445
-1517.37514360715
1974.58191603584
-1950.14984406222
-688.579852230992
-490.572636876695
-594.197558378547
-306.999620141857
-656.795313387173
-802.789058785465
-600.606714310006
-150.319615481891
-1608.83671541976
-601.667586649662
-1135.23016543098


Parameters (Session):
par1 = FALSE ; par2 = 1 ; par3 = 1 ; par4 = 1 ; par5 = 12 ; par6 = 0 ; par7 = 1 ; par8 = 2 ; par9 = 1 ;
Parameters (R input):
par1 = FALSE ; par2 = 1 ; par3 = 1 ; par4 = 1 ; par5 = 12 ; par6 = 0 ; par7 = 1 ; par8 = 2 ; par9 = 1 ;
R code (references can be found in the software module):
library(lattice)
if (par1 == 'TRUE') par1 <- TRUE
if (par1 == 'FALSE') par1 <- FALSE
par2 <- as.numeric(par2) #Box-Cox lambda transformation parameter
par3 <- as.numeric(par3) #degree of non-seasonal differencing
par4 <- as.numeric(par4) #degree of seasonal differencing
par5 <- as.numeric(par5) #seasonal period
par6 <- as.numeric(par6) #degree (p) of the non-seasonal AR(p) polynomial
par7 <- as.numeric(par7) #degree (q) of the non-seasonal MA(q) polynomial
par8 <- as.numeric(par8) #degree (P) of the seasonal AR(P) polynomial
par9 <- as.numeric(par9) #degree (Q) of the seasonal MA(Q) polynomial
armaGR <- function(arima.out, names, n){
try1 <- arima.out$coef
try2 <- sqrt(diag(arima.out$var.coef))
try.data.frame <- data.frame(matrix(NA,ncol=4,nrow=length(names)))
dimnames(try.data.frame) <- list(names,c('coef','std','tstat','pv'))
try.data.frame[,1] <- try1
for(i in 1:length(try2)) try.data.frame[which(rownames(try.data.frame)==names(try2)[i]),2] <- try2[i]
try.data.frame[,3] <- try.data.frame[,1] / try.data.frame[,2]
try.data.frame[,4] <- round((1-pt(abs(try.data.frame[,3]),df=n-(length(try2)+1)))*2,5)
vector <- rep(NA,length(names))
vector[is.na(try.data.frame[,4])] <- 0
maxi <- which.max(try.data.frame[,4])
continue <- max(try.data.frame[,4],na.rm=TRUE) > .05
vector[maxi] <- 0
list(summary=try.data.frame,next.vector=vector,continue=continue)
}
arimaSelect <- function(series, order=c(13,0,0), seasonal=list(order=c(2,0,0),period=12), include.mean=F){
nrc <- order[1]+order[3]+seasonal$order[1]+seasonal$order[3]
coeff <- matrix(NA, nrow=nrc*2, ncol=nrc)
pval <- matrix(NA, nrow=nrc*2, ncol=nrc)
mylist <- rep(list(NULL), nrc)
names <- NULL
if(order[1] > 0) names <- paste('ar',1:order[1],sep='')
if(order[3] > 0) names <- c( names , paste('ma',1:order[3],sep='') )
if(seasonal$order[1] > 0) names <- c(names, paste('sar',1:seasonal$order[1],sep=''))
if(seasonal$order[3] > 0) names <- c(names, paste('sma',1:seasonal$order[3],sep=''))
arima.out <- arima(series, order=order, seasonal=seasonal, include.mean=include.mean, method='ML')
mylist[[1]] <- arima.out
last.arma <- armaGR(arima.out, names, length(series))
mystop <- FALSE
i <- 1
coeff[i,] <- last.arma[[1]][,1]
pval [i,] <- last.arma[[1]][,4]
i <- 2
aic <- arima.out$aic
while(!mystop){
mylist[[i]] <- arima.out
arima.out <- arima(series, order=order, seasonal=seasonal, include.mean=include.mean, method='ML', fixed=last.arma$next.vector)
aic <- c(aic, arima.out$aic)
last.arma <- armaGR(arima.out, names, length(series))
mystop <- !last.arma$continue
coeff[i,] <- last.arma[[1]][,1]
pval [i,] <- last.arma[[1]][,4]
i <- i+1
}
list(coeff, pval, mylist, aic=aic)
}
arimaSelectplot <- function(arimaSelect.out,noms,choix){
noms <- names(arimaSelect.out[[3]][[1]]$coef)
coeff <- arimaSelect.out[[1]]
k <- min(which(is.na(coeff[,1])))-1
coeff <- coeff[1:k,]
pval <- arimaSelect.out[[2]][1:k,]
aic <- arimaSelect.out$aic[1:k]
coeff[coeff==0] <- NA
n <- ncol(coeff)
if(missing(choix)) choix <- k
layout(matrix(c(1,1,1,2,
3,3,3,2,
3,3,3,4,
5,6,7,7),nr=4),
widths=c(10,35,45,15),
heights=c(30,30,15,15))
couleurs <- rainbow(75)[1:50]#(50)
ticks <- pretty(coeff)
par(mar=c(1,1,3,1))
plot(aic,k:1-.5,type='o',pch=21,bg='blue',cex=2,axes=F,lty=2,xpd=NA)
points(aic[choix],k-choix+.5,pch=21,cex=4,bg=2,xpd=NA)
title('aic',line=2)
par(mar=c(3,0,0,0))
plot(0,axes=F,xlab='',ylab='',xlim=range(ticks),ylim=c(.1,1))
rect(xleft = min(ticks) + (0:49)/50*(max(ticks)-min(ticks)),
xright = min(ticks) + (1:50)/50*(max(ticks)-min(ticks)),
ytop = rep(1,50),
ybottom= rep(0,50),col=couleurs,border=NA)
axis(1,ticks)
rect(xleft=min(ticks),xright=max(ticks),ytop=1,ybottom=0)
text(mean(coeff,na.rm=T),.5,'coefficients',cex=2,font=2)
par(mar=c(1,1,3,1))
image(1:n,1:k,t(coeff[k:1,]),axes=F,col=couleurs,zlim=range(ticks))
for(i in 1:n) for(j in 1:k) if(!is.na(coeff[j,i])) {
if(pval[j,i]<.01) symb = 'green'
else if( (pval[j,i]<.05) & (pval[j,i]>=.01)) symb = 'orange'
else if( (pval[j,i]<.1) & (pval[j,i]>=.05)) symb = 'red'
else symb = 'black'
polygon(c(i+.5 ,i+.2 ,i+.5 ,i+.5),
c(k-j+0.5,k-j+0.5,k-j+0.8,k-j+0.5),
col=symb)
if(j==choix) {
rect(xleft=i-.5,
xright=i+.5,
ybottom=k-j+1.5,
ytop=k-j+.5,
lwd=4)
text(i,
k-j+1,
round(coeff[j,i],2),
cex=1.2,
font=2)
}
else{
rect(xleft=i-.5,xright=i+.5,ybottom=k-j+1.5,ytop=k-j+.5)
text(i,k-j+1,round(coeff[j,i],2),cex=1.2,font=1)
}
}
axis(3,1:n,noms)
par(mar=c(0.5,0,0,0.5))
plot(0,axes=F,xlab='',ylab='',type='n',xlim=c(0,8),ylim=c(-.2,.8))
cols <- c('green','orange','red','black')
niv <- c('0','0.01','0.05','0.1')
for(i in 0:3){
polygon(c(1+2*i ,1+2*i ,1+2*i-.5 ,1+2*i),
c(.4 ,.7 , .4 , .4),
col=cols[i+1])
text(2*i,0.5,niv[i+1],cex=1.5)
}
text(8,.5,1,cex=1.5)
text(4,0,'p-value',cex=2)
box()
residus <- arimaSelect.out[[3]][[choix]]$res
par(mar=c(1,2,4,1))
acf(residus,main='')
title('acf',line=.5)
par(mar=c(1,2,4,1))
pacf(residus,main='')
title('pacf',line=.5)
par(mar=c(2,2,4,1))
qqnorm(residus,main='')
title('qq-norm',line=.5)
qqline(residus)
residus
}
if (par2 == 0) x <- log(x)
if (par2 != 0) x <- x^par2
(selection <- arimaSelect(x, order=c(par6,par3,par7), seasonal=list(order=c(par8,par4,par9), period=par5)))
bitmap(file='test1.png')
resid <- arimaSelectplot(selection)
dev.off()
resid
bitmap(file='test2.png')
acf(resid,length(resid)/2, main='Residual Autocorrelation Function')
dev.off()
bitmap(file='test3.png')
pacf(resid,length(resid)/2, main='Residual Partial Autocorrelation Function')
dev.off()
bitmap(file='test4.png')
cpgram(resid, main='Residual Cumulative Periodogram')
dev.off()
bitmap(file='test5.png')
hist(resid, main='Residual Histogram', xlab='values of Residuals')
dev.off()
bitmap(file='test6.png')
densityplot(~resid,col='black',main='Residual Density Plot', xlab='values of Residuals')
dev.off()
bitmap(file='test7.png')
qqnorm(resid, main='Residual Normal Q-Q Plot')
qqline(resid)
dev.off()
ncols <- length(selection[[1]][1,])
nrows <- length(selection[[2]][,1])-1
load(file='createtable')
a<-table.start()
a<-table.row.start(a)
a<-table.element(a,'ARIMA Parameter Estimation and Backward Selection', ncols+1,TRUE)
a<-table.row.end(a)
a<-table.row.start(a)
a<-table.element(a,'Iteration', header=TRUE)
for (i in 1:ncols) {
a<-table.element(a,names(selection[[3]][[1]]$coef)[i],header=TRUE)
}
a<-table.row.end(a)
for (j in 1:nrows) {
a<-table.row.start(a)
mydum <- 'Estimates ('
mydum <- paste(mydum,j)
mydum <- paste(mydum,')')
a<-table.element(a,mydum, header=TRUE)
for (i in 1:ncols) {
a<-table.element(a,round(selection[[1]][j,i],4))
}
a<-table.row.end(a)
a<-table.row.start(a)
a<-table.element(a,'(p-val)', header=TRUE)
for (i in 1:ncols) {
mydum <- '('
mydum <- paste(mydum,round(selection[[2]][j,i],4),sep='')
mydum <- paste(mydum,')')
a<-table.element(a,mydum)
}
a<-table.row.end(a)
}
a<-table.end(a)
table.save(a,file='mytable.tab')
a<-table.start()
a<-table.row.start(a)
a<-table.element(a,'Estimated ARIMA Residuals', 1,TRUE)
a<-table.row.end(a)
a<-table.row.start(a)
a<-table.element(a,'Value', 1,TRUE)
a<-table.row.end(a)
for (i in (par4*par5+par3):length(resid)) {
a<-table.row.start(a)
a<-table.element(a,resid[i])
a<-table.row.end(a)
}
a<-table.end(a)
table.save(a,file='mytable1.tab')