Free Statistics

of Irreproducible Research!

Author's title

Author*The author of this computation has been verified*
R Software Modulerwasp_autocorrelation.wasp
Title produced by software(Partial) Autocorrelation Function
Date of computationMon, 15 Dec 2008 04:42:25 -0700
Cite this page as followsStatistical Computations at FreeStatistics.org, Office for Research Development and Education, URL https://freestatistics.org/blog/index.php?v=date/2008/Dec/15/t1229341523urnjt4ur499cj9p.htm/, Retrieved Sun, 19 May 2024 09:41:02 +0000
Statistical Computations at FreeStatistics.org, Office for Research Development and Education, URL https://freestatistics.org/blog/index.php?pk=33679, Retrieved Sun, 19 May 2024 09:41:02 +0000
QR Codes:

Original text written by user:
IsPrivate?No (this computation is public)
User-defined keywords
Estimated Impact195
Family? (F = Feedback message, R = changed R code, M = changed R Module, P = changed Parameters, D = changed Data)
-     [Univariate Data Series] [data set] [2008-12-01 19:54:57] [b98453cac15ba1066b407e146608df68]
F RMP   [Standard Deviation-Mean Plot] [Standard Deviatio...] [2008-12-08 13:56:16] [98f6eecc397b06503dbf024e1e936f30]
- RMPD      [(Partial) Autocorrelation Function] [(partial) autocor...] [2008-12-15 11:42:25] [52d1f7c78552cd0e785e1b7a3cade101] [Current]
Feedback Forum

Post a new message
Dataseries X:
87
96.3
107.1
115.2
106.1
89.5
91.3
97.6
100.7
104.6
94.7
101.8
102.5
105.3
110.3
109.8
117.3
118.8
131.3
125.9
133.1
147
145.8
164.4
149.8
137.7
151.7
156.8
180
180.4
170.4
191.6
199.5
218.2
217.5
205
194
199.3
219.3
211.1
215.2
240.2
242.2
240.7
255.4
253
218.2
203.7
205.6
215.6


Summary of computational transaction
Raw Inputview raw input (R code)
Raw Outputview raw output of R engine
Computing time2 seconds
R Server'Herman Ole Andreas Wold' @ 193.190.124.10:1001

\begin{tabular}{lllllllll}
\hline
Summary of computational transaction \tabularnewline
Raw Input & view raw input (R code)  \tabularnewline
Raw Output & view raw output of R engine  \tabularnewline
Computing time & 2 seconds \tabularnewline
R Server & 'Herman Ole Andreas Wold' @ 193.190.124.10:1001 \tabularnewline
\hline
\end{tabular}
%Source: https://freestatistics.org/blog/index.php?pk=33679&T=0

[TABLE]
[ROW][C]Summary of computational transaction[/C][/ROW]
[ROW][C]Raw Input[/C][C]view raw input (R code) [/C][/ROW]
[ROW][C]Raw Output[/C][C]view raw output of R engine [/C][/ROW]
[ROW][C]Computing time[/C][C]2 seconds[/C][/ROW]
[ROW][C]R Server[/C][C]'Herman Ole Andreas Wold' @ 193.190.124.10:1001[/C][/ROW]
[/TABLE]
Source: https://freestatistics.org/blog/index.php?pk=33679&T=0

Globally Unique Identifier (entire table): ba.freestatistics.org/blog/index.php?pk=33679&T=0

As an alternative you can also use a QR Code:  

The GUIDs for individual cells are displayed in the table below:

Summary of computational transaction
Raw Inputview raw input (R code)
Raw Outputview raw output of R engine
Computing time2 seconds
R Server'Herman Ole Andreas Wold' @ 193.190.124.10:1001


Autocorrelation Function
Time lag kACF(k)T-STATP-value
10.9432946.67010
20.8893746.28880
30.8513966.02030
40.8134455.75190
50.7606245.37841e-06
60.6886064.86926e-06
70.6244224.41532.7e-05
80.5597293.95790.00012
90.5018353.54850.000427
100.4602113.25420.001021
110.3978152.8130.003499
120.3259892.30510.012675
130.2559361.80970.038174
140.1928371.36360.089407
150.1316430.93090.1782
160.0608560.43030.334408
17-0.0054-0.03820.484846
18-0.066513-0.47030.320085
19-0.114132-0.8070.211734
20-0.152613-1.07910.142852
21-0.198093-1.40070.083735
22-0.241799-1.70980.046753
23-0.2803-1.9820.026493
24-0.302017-2.13560.018817
25-0.325027-2.29830.012882
26-0.361287-2.55470.00686
27-0.397634-2.81170.003511
28-0.423999-2.99810.002112
29-0.433439-3.06490.001753
30-0.43671-3.0880.001642
31-0.446687-3.15860.001345
32-0.451417-3.1920.001222
33-0.4468-3.15940.001341
34-0.427916-3.02580.001955
35-0.40412-2.85760.003103
36-0.387631-2.7410.004237
37-0.375311-2.65380.005321
38-0.358854-2.53750.007165
39-0.331967-2.34740.011453
40-0.304565-2.15360.018059
41-0.279354-1.97530.026882
42-0.244596-1.72960.04494
43-0.213013-1.50620.06915
44-0.179236-1.26740.105443
45-0.131689-0.93120.178117
46-0.088196-0.62360.26785
47-0.066847-0.47270.319249
48-0.050833-0.35940.360389

\begin{tabular}{lllllllll}
\hline
Autocorrelation Function \tabularnewline
Time lag k & ACF(k) & T-STAT & P-value \tabularnewline
1 & 0.943294 & 6.6701 & 0 \tabularnewline
2 & 0.889374 & 6.2888 & 0 \tabularnewline
3 & 0.851396 & 6.0203 & 0 \tabularnewline
4 & 0.813445 & 5.7519 & 0 \tabularnewline
5 & 0.760624 & 5.3784 & 1e-06 \tabularnewline
6 & 0.688606 & 4.8692 & 6e-06 \tabularnewline
7 & 0.624422 & 4.4153 & 2.7e-05 \tabularnewline
8 & 0.559729 & 3.9579 & 0.00012 \tabularnewline
9 & 0.501835 & 3.5485 & 0.000427 \tabularnewline
10 & 0.460211 & 3.2542 & 0.001021 \tabularnewline
11 & 0.397815 & 2.813 & 0.003499 \tabularnewline
12 & 0.325989 & 2.3051 & 0.012675 \tabularnewline
13 & 0.255936 & 1.8097 & 0.038174 \tabularnewline
14 & 0.192837 & 1.3636 & 0.089407 \tabularnewline
15 & 0.131643 & 0.9309 & 0.1782 \tabularnewline
16 & 0.060856 & 0.4303 & 0.334408 \tabularnewline
17 & -0.0054 & -0.0382 & 0.484846 \tabularnewline
18 & -0.066513 & -0.4703 & 0.320085 \tabularnewline
19 & -0.114132 & -0.807 & 0.211734 \tabularnewline
20 & -0.152613 & -1.0791 & 0.142852 \tabularnewline
21 & -0.198093 & -1.4007 & 0.083735 \tabularnewline
22 & -0.241799 & -1.7098 & 0.046753 \tabularnewline
23 & -0.2803 & -1.982 & 0.026493 \tabularnewline
24 & -0.302017 & -2.1356 & 0.018817 \tabularnewline
25 & -0.325027 & -2.2983 & 0.012882 \tabularnewline
26 & -0.361287 & -2.5547 & 0.00686 \tabularnewline
27 & -0.397634 & -2.8117 & 0.003511 \tabularnewline
28 & -0.423999 & -2.9981 & 0.002112 \tabularnewline
29 & -0.433439 & -3.0649 & 0.001753 \tabularnewline
30 & -0.43671 & -3.088 & 0.001642 \tabularnewline
31 & -0.446687 & -3.1586 & 0.001345 \tabularnewline
32 & -0.451417 & -3.192 & 0.001222 \tabularnewline
33 & -0.4468 & -3.1594 & 0.001341 \tabularnewline
34 & -0.427916 & -3.0258 & 0.001955 \tabularnewline
35 & -0.40412 & -2.8576 & 0.003103 \tabularnewline
36 & -0.387631 & -2.741 & 0.004237 \tabularnewline
37 & -0.375311 & -2.6538 & 0.005321 \tabularnewline
38 & -0.358854 & -2.5375 & 0.007165 \tabularnewline
39 & -0.331967 & -2.3474 & 0.011453 \tabularnewline
40 & -0.304565 & -2.1536 & 0.018059 \tabularnewline
41 & -0.279354 & -1.9753 & 0.026882 \tabularnewline
42 & -0.244596 & -1.7296 & 0.04494 \tabularnewline
43 & -0.213013 & -1.5062 & 0.06915 \tabularnewline
44 & -0.179236 & -1.2674 & 0.105443 \tabularnewline
45 & -0.131689 & -0.9312 & 0.178117 \tabularnewline
46 & -0.088196 & -0.6236 & 0.26785 \tabularnewline
47 & -0.066847 & -0.4727 & 0.319249 \tabularnewline
48 & -0.050833 & -0.3594 & 0.360389 \tabularnewline
\hline
\end{tabular}
%Source: https://freestatistics.org/blog/index.php?pk=33679&T=1

[TABLE]
[ROW][C]Autocorrelation Function[/C][/ROW]
[ROW][C]Time lag k[/C][C]ACF(k)[/C][C]T-STAT[/C][C]P-value[/C][/ROW]
[ROW][C]1[/C][C]0.943294[/C][C]6.6701[/C][C]0[/C][/ROW]
[ROW][C]2[/C][C]0.889374[/C][C]6.2888[/C][C]0[/C][/ROW]
[ROW][C]3[/C][C]0.851396[/C][C]6.0203[/C][C]0[/C][/ROW]
[ROW][C]4[/C][C]0.813445[/C][C]5.7519[/C][C]0[/C][/ROW]
[ROW][C]5[/C][C]0.760624[/C][C]5.3784[/C][C]1e-06[/C][/ROW]
[ROW][C]6[/C][C]0.688606[/C][C]4.8692[/C][C]6e-06[/C][/ROW]
[ROW][C]7[/C][C]0.624422[/C][C]4.4153[/C][C]2.7e-05[/C][/ROW]
[ROW][C]8[/C][C]0.559729[/C][C]3.9579[/C][C]0.00012[/C][/ROW]
[ROW][C]9[/C][C]0.501835[/C][C]3.5485[/C][C]0.000427[/C][/ROW]
[ROW][C]10[/C][C]0.460211[/C][C]3.2542[/C][C]0.001021[/C][/ROW]
[ROW][C]11[/C][C]0.397815[/C][C]2.813[/C][C]0.003499[/C][/ROW]
[ROW][C]12[/C][C]0.325989[/C][C]2.3051[/C][C]0.012675[/C][/ROW]
[ROW][C]13[/C][C]0.255936[/C][C]1.8097[/C][C]0.038174[/C][/ROW]
[ROW][C]14[/C][C]0.192837[/C][C]1.3636[/C][C]0.089407[/C][/ROW]
[ROW][C]15[/C][C]0.131643[/C][C]0.9309[/C][C]0.1782[/C][/ROW]
[ROW][C]16[/C][C]0.060856[/C][C]0.4303[/C][C]0.334408[/C][/ROW]
[ROW][C]17[/C][C]-0.0054[/C][C]-0.0382[/C][C]0.484846[/C][/ROW]
[ROW][C]18[/C][C]-0.066513[/C][C]-0.4703[/C][C]0.320085[/C][/ROW]
[ROW][C]19[/C][C]-0.114132[/C][C]-0.807[/C][C]0.211734[/C][/ROW]
[ROW][C]20[/C][C]-0.152613[/C][C]-1.0791[/C][C]0.142852[/C][/ROW]
[ROW][C]21[/C][C]-0.198093[/C][C]-1.4007[/C][C]0.083735[/C][/ROW]
[ROW][C]22[/C][C]-0.241799[/C][C]-1.7098[/C][C]0.046753[/C][/ROW]
[ROW][C]23[/C][C]-0.2803[/C][C]-1.982[/C][C]0.026493[/C][/ROW]
[ROW][C]24[/C][C]-0.302017[/C][C]-2.1356[/C][C]0.018817[/C][/ROW]
[ROW][C]25[/C][C]-0.325027[/C][C]-2.2983[/C][C]0.012882[/C][/ROW]
[ROW][C]26[/C][C]-0.361287[/C][C]-2.5547[/C][C]0.00686[/C][/ROW]
[ROW][C]27[/C][C]-0.397634[/C][C]-2.8117[/C][C]0.003511[/C][/ROW]
[ROW][C]28[/C][C]-0.423999[/C][C]-2.9981[/C][C]0.002112[/C][/ROW]
[ROW][C]29[/C][C]-0.433439[/C][C]-3.0649[/C][C]0.001753[/C][/ROW]
[ROW][C]30[/C][C]-0.43671[/C][C]-3.088[/C][C]0.001642[/C][/ROW]
[ROW][C]31[/C][C]-0.446687[/C][C]-3.1586[/C][C]0.001345[/C][/ROW]
[ROW][C]32[/C][C]-0.451417[/C][C]-3.192[/C][C]0.001222[/C][/ROW]
[ROW][C]33[/C][C]-0.4468[/C][C]-3.1594[/C][C]0.001341[/C][/ROW]
[ROW][C]34[/C][C]-0.427916[/C][C]-3.0258[/C][C]0.001955[/C][/ROW]
[ROW][C]35[/C][C]-0.40412[/C][C]-2.8576[/C][C]0.003103[/C][/ROW]
[ROW][C]36[/C][C]-0.387631[/C][C]-2.741[/C][C]0.004237[/C][/ROW]
[ROW][C]37[/C][C]-0.375311[/C][C]-2.6538[/C][C]0.005321[/C][/ROW]
[ROW][C]38[/C][C]-0.358854[/C][C]-2.5375[/C][C]0.007165[/C][/ROW]
[ROW][C]39[/C][C]-0.331967[/C][C]-2.3474[/C][C]0.011453[/C][/ROW]
[ROW][C]40[/C][C]-0.304565[/C][C]-2.1536[/C][C]0.018059[/C][/ROW]
[ROW][C]41[/C][C]-0.279354[/C][C]-1.9753[/C][C]0.026882[/C][/ROW]
[ROW][C]42[/C][C]-0.244596[/C][C]-1.7296[/C][C]0.04494[/C][/ROW]
[ROW][C]43[/C][C]-0.213013[/C][C]-1.5062[/C][C]0.06915[/C][/ROW]
[ROW][C]44[/C][C]-0.179236[/C][C]-1.2674[/C][C]0.105443[/C][/ROW]
[ROW][C]45[/C][C]-0.131689[/C][C]-0.9312[/C][C]0.178117[/C][/ROW]
[ROW][C]46[/C][C]-0.088196[/C][C]-0.6236[/C][C]0.26785[/C][/ROW]
[ROW][C]47[/C][C]-0.066847[/C][C]-0.4727[/C][C]0.319249[/C][/ROW]
[ROW][C]48[/C][C]-0.050833[/C][C]-0.3594[/C][C]0.360389[/C][/ROW]
[/TABLE]
Source: https://freestatistics.org/blog/index.php?pk=33679&T=1

Globally Unique Identifier (entire table): ba.freestatistics.org/blog/index.php?pk=33679&T=1

As an alternative you can also use a QR Code:  

The GUIDs for individual cells are displayed in the table below:

Autocorrelation Function
Time lag kACF(k)T-STATP-value
10.9432946.67010
20.8893746.28880
30.8513966.02030
40.8134455.75190
50.7606245.37841e-06
60.6886064.86926e-06
70.6244224.41532.7e-05
80.5597293.95790.00012
90.5018353.54850.000427
100.4602113.25420.001021
110.3978152.8130.003499
120.3259892.30510.012675
130.2559361.80970.038174
140.1928371.36360.089407
150.1316430.93090.1782
160.0608560.43030.334408
17-0.0054-0.03820.484846
18-0.066513-0.47030.320085
19-0.114132-0.8070.211734
20-0.152613-1.07910.142852
21-0.198093-1.40070.083735
22-0.241799-1.70980.046753
23-0.2803-1.9820.026493
24-0.302017-2.13560.018817
25-0.325027-2.29830.012882
26-0.361287-2.55470.00686
27-0.397634-2.81170.003511
28-0.423999-2.99810.002112
29-0.433439-3.06490.001753
30-0.43671-3.0880.001642
31-0.446687-3.15860.001345
32-0.451417-3.1920.001222
33-0.4468-3.15940.001341
34-0.427916-3.02580.001955
35-0.40412-2.85760.003103
36-0.387631-2.7410.004237
37-0.375311-2.65380.005321
38-0.358854-2.53750.007165
39-0.331967-2.34740.011453
40-0.304565-2.15360.018059
41-0.279354-1.97530.026882
42-0.244596-1.72960.04494
43-0.213013-1.50620.06915
44-0.179236-1.26740.105443
45-0.131689-0.93120.178117
46-0.088196-0.62360.26785
47-0.066847-0.47270.319249
48-0.050833-0.35940.360389


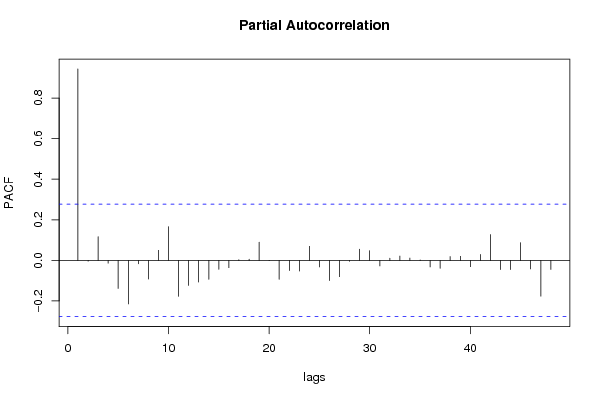
Partial Autocorrelation Function
Time lag kPACF(k)T-STATP-value
10.9432946.67010
2-0.003895-0.02750.489068
30.1167150.82530.206562
4-0.013992-0.09890.46079
5-0.137983-0.97570.166958
6-0.214838-1.51910.067514
7-0.0169-0.11950.45268
8-0.091997-0.65050.259168
90.0498770.35270.362903
100.1662891.17580.122614
11-0.176727-1.24960.108623
12-0.123576-0.87380.193199
13-0.106988-0.75650.226444
14-0.093081-0.65820.25672
15-0.043669-0.30880.379383
16-0.03567-0.25220.400951
170.0035250.02490.490107
180.0062350.04410.482505
190.0897570.63470.264266
20-0.001176-0.00830.496698
21-0.093509-0.66120.255758
22-0.049992-0.35350.362602
23-0.052514-0.37130.35598
240.0695620.49190.31248
25-0.032167-0.22750.410499
26-0.099094-0.70070.243369
27-0.080587-0.56980.285669
28-0.004767-0.03370.486623
290.0553620.39150.348556
300.0480130.33950.367827
31-0.027462-0.19420.423407
320.0108230.07650.46965
330.0216580.15310.43945
340.0117740.08330.46699
350.0021960.01550.493836
36-0.03227-0.22820.410217
37-0.038739-0.27390.392634
380.0191950.13570.446291
390.0200420.14170.443936
40-0.031046-0.21950.413567
410.029140.20610.418793
420.127220.89960.186327
43-0.045278-0.32020.375088
44-0.0452-0.31960.375298
450.0873160.61740.269881
46-0.041826-0.29580.384321
47-0.176132-1.24540.109388
48-0.044512-0.31470.377131

\begin{tabular}{lllllllll}
\hline
Partial Autocorrelation Function \tabularnewline
Time lag k & PACF(k) & T-STAT & P-value \tabularnewline
1 & 0.943294 & 6.6701 & 0 \tabularnewline
2 & -0.003895 & -0.0275 & 0.489068 \tabularnewline
3 & 0.116715 & 0.8253 & 0.206562 \tabularnewline
4 & -0.013992 & -0.0989 & 0.46079 \tabularnewline
5 & -0.137983 & -0.9757 & 0.166958 \tabularnewline
6 & -0.214838 & -1.5191 & 0.067514 \tabularnewline
7 & -0.0169 & -0.1195 & 0.45268 \tabularnewline
8 & -0.091997 & -0.6505 & 0.259168 \tabularnewline
9 & 0.049877 & 0.3527 & 0.362903 \tabularnewline
10 & 0.166289 & 1.1758 & 0.122614 \tabularnewline
11 & -0.176727 & -1.2496 & 0.108623 \tabularnewline
12 & -0.123576 & -0.8738 & 0.193199 \tabularnewline
13 & -0.106988 & -0.7565 & 0.226444 \tabularnewline
14 & -0.093081 & -0.6582 & 0.25672 \tabularnewline
15 & -0.043669 & -0.3088 & 0.379383 \tabularnewline
16 & -0.03567 & -0.2522 & 0.400951 \tabularnewline
17 & 0.003525 & 0.0249 & 0.490107 \tabularnewline
18 & 0.006235 & 0.0441 & 0.482505 \tabularnewline
19 & 0.089757 & 0.6347 & 0.264266 \tabularnewline
20 & -0.001176 & -0.0083 & 0.496698 \tabularnewline
21 & -0.093509 & -0.6612 & 0.255758 \tabularnewline
22 & -0.049992 & -0.3535 & 0.362602 \tabularnewline
23 & -0.052514 & -0.3713 & 0.35598 \tabularnewline
24 & 0.069562 & 0.4919 & 0.31248 \tabularnewline
25 & -0.032167 & -0.2275 & 0.410499 \tabularnewline
26 & -0.099094 & -0.7007 & 0.243369 \tabularnewline
27 & -0.080587 & -0.5698 & 0.285669 \tabularnewline
28 & -0.004767 & -0.0337 & 0.486623 \tabularnewline
29 & 0.055362 & 0.3915 & 0.348556 \tabularnewline
30 & 0.048013 & 0.3395 & 0.367827 \tabularnewline
31 & -0.027462 & -0.1942 & 0.423407 \tabularnewline
32 & 0.010823 & 0.0765 & 0.46965 \tabularnewline
33 & 0.021658 & 0.1531 & 0.43945 \tabularnewline
34 & 0.011774 & 0.0833 & 0.46699 \tabularnewline
35 & 0.002196 & 0.0155 & 0.493836 \tabularnewline
36 & -0.03227 & -0.2282 & 0.410217 \tabularnewline
37 & -0.038739 & -0.2739 & 0.392634 \tabularnewline
38 & 0.019195 & 0.1357 & 0.446291 \tabularnewline
39 & 0.020042 & 0.1417 & 0.443936 \tabularnewline
40 & -0.031046 & -0.2195 & 0.413567 \tabularnewline
41 & 0.02914 & 0.2061 & 0.418793 \tabularnewline
42 & 0.12722 & 0.8996 & 0.186327 \tabularnewline
43 & -0.045278 & -0.3202 & 0.375088 \tabularnewline
44 & -0.0452 & -0.3196 & 0.375298 \tabularnewline
45 & 0.087316 & 0.6174 & 0.269881 \tabularnewline
46 & -0.041826 & -0.2958 & 0.384321 \tabularnewline
47 & -0.176132 & -1.2454 & 0.109388 \tabularnewline
48 & -0.044512 & -0.3147 & 0.377131 \tabularnewline
\hline
\end{tabular}
%Source: https://freestatistics.org/blog/index.php?pk=33679&T=2

[TABLE]
[ROW][C]Partial Autocorrelation Function[/C][/ROW]
[ROW][C]Time lag k[/C][C]PACF(k)[/C][C]T-STAT[/C][C]P-value[/C][/ROW]
[ROW][C]1[/C][C]0.943294[/C][C]6.6701[/C][C]0[/C][/ROW]
[ROW][C]2[/C][C]-0.003895[/C][C]-0.0275[/C][C]0.489068[/C][/ROW]
[ROW][C]3[/C][C]0.116715[/C][C]0.8253[/C][C]0.206562[/C][/ROW]
[ROW][C]4[/C][C]-0.013992[/C][C]-0.0989[/C][C]0.46079[/C][/ROW]
[ROW][C]5[/C][C]-0.137983[/C][C]-0.9757[/C][C]0.166958[/C][/ROW]
[ROW][C]6[/C][C]-0.214838[/C][C]-1.5191[/C][C]0.067514[/C][/ROW]
[ROW][C]7[/C][C]-0.0169[/C][C]-0.1195[/C][C]0.45268[/C][/ROW]
[ROW][C]8[/C][C]-0.091997[/C][C]-0.6505[/C][C]0.259168[/C][/ROW]
[ROW][C]9[/C][C]0.049877[/C][C]0.3527[/C][C]0.362903[/C][/ROW]
[ROW][C]10[/C][C]0.166289[/C][C]1.1758[/C][C]0.122614[/C][/ROW]
[ROW][C]11[/C][C]-0.176727[/C][C]-1.2496[/C][C]0.108623[/C][/ROW]
[ROW][C]12[/C][C]-0.123576[/C][C]-0.8738[/C][C]0.193199[/C][/ROW]
[ROW][C]13[/C][C]-0.106988[/C][C]-0.7565[/C][C]0.226444[/C][/ROW]
[ROW][C]14[/C][C]-0.093081[/C][C]-0.6582[/C][C]0.25672[/C][/ROW]
[ROW][C]15[/C][C]-0.043669[/C][C]-0.3088[/C][C]0.379383[/C][/ROW]
[ROW][C]16[/C][C]-0.03567[/C][C]-0.2522[/C][C]0.400951[/C][/ROW]
[ROW][C]17[/C][C]0.003525[/C][C]0.0249[/C][C]0.490107[/C][/ROW]
[ROW][C]18[/C][C]0.006235[/C][C]0.0441[/C][C]0.482505[/C][/ROW]
[ROW][C]19[/C][C]0.089757[/C][C]0.6347[/C][C]0.264266[/C][/ROW]
[ROW][C]20[/C][C]-0.001176[/C][C]-0.0083[/C][C]0.496698[/C][/ROW]
[ROW][C]21[/C][C]-0.093509[/C][C]-0.6612[/C][C]0.255758[/C][/ROW]
[ROW][C]22[/C][C]-0.049992[/C][C]-0.3535[/C][C]0.362602[/C][/ROW]
[ROW][C]23[/C][C]-0.052514[/C][C]-0.3713[/C][C]0.35598[/C][/ROW]
[ROW][C]24[/C][C]0.069562[/C][C]0.4919[/C][C]0.31248[/C][/ROW]
[ROW][C]25[/C][C]-0.032167[/C][C]-0.2275[/C][C]0.410499[/C][/ROW]
[ROW][C]26[/C][C]-0.099094[/C][C]-0.7007[/C][C]0.243369[/C][/ROW]
[ROW][C]27[/C][C]-0.080587[/C][C]-0.5698[/C][C]0.285669[/C][/ROW]
[ROW][C]28[/C][C]-0.004767[/C][C]-0.0337[/C][C]0.486623[/C][/ROW]
[ROW][C]29[/C][C]0.055362[/C][C]0.3915[/C][C]0.348556[/C][/ROW]
[ROW][C]30[/C][C]0.048013[/C][C]0.3395[/C][C]0.367827[/C][/ROW]
[ROW][C]31[/C][C]-0.027462[/C][C]-0.1942[/C][C]0.423407[/C][/ROW]
[ROW][C]32[/C][C]0.010823[/C][C]0.0765[/C][C]0.46965[/C][/ROW]
[ROW][C]33[/C][C]0.021658[/C][C]0.1531[/C][C]0.43945[/C][/ROW]
[ROW][C]34[/C][C]0.011774[/C][C]0.0833[/C][C]0.46699[/C][/ROW]
[ROW][C]35[/C][C]0.002196[/C][C]0.0155[/C][C]0.493836[/C][/ROW]
[ROW][C]36[/C][C]-0.03227[/C][C]-0.2282[/C][C]0.410217[/C][/ROW]
[ROW][C]37[/C][C]-0.038739[/C][C]-0.2739[/C][C]0.392634[/C][/ROW]
[ROW][C]38[/C][C]0.019195[/C][C]0.1357[/C][C]0.446291[/C][/ROW]
[ROW][C]39[/C][C]0.020042[/C][C]0.1417[/C][C]0.443936[/C][/ROW]
[ROW][C]40[/C][C]-0.031046[/C][C]-0.2195[/C][C]0.413567[/C][/ROW]
[ROW][C]41[/C][C]0.02914[/C][C]0.2061[/C][C]0.418793[/C][/ROW]
[ROW][C]42[/C][C]0.12722[/C][C]0.8996[/C][C]0.186327[/C][/ROW]
[ROW][C]43[/C][C]-0.045278[/C][C]-0.3202[/C][C]0.375088[/C][/ROW]
[ROW][C]44[/C][C]-0.0452[/C][C]-0.3196[/C][C]0.375298[/C][/ROW]
[ROW][C]45[/C][C]0.087316[/C][C]0.6174[/C][C]0.269881[/C][/ROW]
[ROW][C]46[/C][C]-0.041826[/C][C]-0.2958[/C][C]0.384321[/C][/ROW]
[ROW][C]47[/C][C]-0.176132[/C][C]-1.2454[/C][C]0.109388[/C][/ROW]
[ROW][C]48[/C][C]-0.044512[/C][C]-0.3147[/C][C]0.377131[/C][/ROW]
[/TABLE]
Source: https://freestatistics.org/blog/index.php?pk=33679&T=2

Globally Unique Identifier (entire table): ba.freestatistics.org/blog/index.php?pk=33679&T=2

As an alternative you can also use a QR Code:  

The GUIDs for individual cells are displayed in the table below:

Partial Autocorrelation Function
Time lag kPACF(k)T-STATP-value
10.9432946.67010
2-0.003895-0.02750.489068
30.1167150.82530.206562
4-0.013992-0.09890.46079
5-0.137983-0.97570.166958
6-0.214838-1.51910.067514
7-0.0169-0.11950.45268
8-0.091997-0.65050.259168
90.0498770.35270.362903
100.1662891.17580.122614
11-0.176727-1.24960.108623
12-0.123576-0.87380.193199
13-0.106988-0.75650.226444
14-0.093081-0.65820.25672
15-0.043669-0.30880.379383
16-0.03567-0.25220.400951
170.0035250.02490.490107
180.0062350.04410.482505
190.0897570.63470.264266
20-0.001176-0.00830.496698
21-0.093509-0.66120.255758
22-0.049992-0.35350.362602
23-0.052514-0.37130.35598
240.0695620.49190.31248
25-0.032167-0.22750.410499
26-0.099094-0.70070.243369
27-0.080587-0.56980.285669
28-0.004767-0.03370.486623
290.0553620.39150.348556
300.0480130.33950.367827
31-0.027462-0.19420.423407
320.0108230.07650.46965
330.0216580.15310.43945
340.0117740.08330.46699
350.0021960.01550.493836
36-0.03227-0.22820.410217
37-0.038739-0.27390.392634
380.0191950.13570.446291
390.0200420.14170.443936
40-0.031046-0.21950.413567
410.029140.20610.418793
420.127220.89960.186327
43-0.045278-0.32020.375088
44-0.0452-0.31960.375298
450.0873160.61740.269881
46-0.041826-0.29580.384321
47-0.176132-1.24540.109388
48-0.044512-0.31470.377131


Parameters (Session):
par1 = 48 ; par2 = 1 ; par3 = 0 ; par4 = 0 ; par5 = 12 ;
Parameters (R input):
par1 = 48 ; par2 = 1 ; par3 = 0 ; par4 = 0 ; par5 = 12 ;
R code (references can be found in the software module):
if (par1 == 'Default') {
par1 = 10*log10(length(x))
} else {
par1 <- as.numeric(par1)
}
par2 <- as.numeric(par2)
par3 <- as.numeric(par3)
par4 <- as.numeric(par4)
par5 <- as.numeric(par5)
if (par2 == 0) {
x <- log(x)
} else {
x <- (x ^ par2 - 1) / par2
}
if (par3 > 0) x <- diff(x,lag=1,difference=par3)
if (par4 > 0) x <- diff(x,lag=par5,difference=par4)
bitmap(file='pic1.png')
racf <- acf(x,par1,main='Autocorrelation',xlab='lags',ylab='ACF')
dev.off()
bitmap(file='pic2.png')
rpacf <- pacf(x,par1,main='Partial Autocorrelation',xlab='lags',ylab='PACF')
dev.off()
(myacf <- c(racf$acf))
(mypacf <- c(rpacf$acf))
lengthx <- length(x)
sqrtn <- sqrt(lengthx)
load(file='createtable')
a<-table.start()
a<-table.row.start(a)
a<-table.element(a,'Autocorrelation Function',4,TRUE)
a<-table.row.end(a)
a<-table.row.start(a)
a<-table.element(a,'Time lag k',header=TRUE)
a<-table.element(a,hyperlink('basics.htm','ACF(k)','click here for more information about the Autocorrelation Function'),header=TRUE)
a<-table.element(a,'T-STAT',header=TRUE)
a<-table.element(a,'P-value',header=TRUE)
a<-table.row.end(a)
for (i in 2:(par1+1)) {
a<-table.row.start(a)
a<-table.element(a,i-1,header=TRUE)
a<-table.element(a,round(myacf[i],6))
mytstat <- myacf[i]*sqrtn
a<-table.element(a,round(mytstat,4))
a<-table.element(a,round(1-pt(abs(mytstat),lengthx),6))
a<-table.row.end(a)
}
a<-table.end(a)
table.save(a,file='mytable.tab')
a<-table.start()
a<-table.row.start(a)
a<-table.element(a,'Partial Autocorrelation Function',4,TRUE)
a<-table.row.end(a)
a<-table.row.start(a)
a<-table.element(a,'Time lag k',header=TRUE)
a<-table.element(a,hyperlink('basics.htm','PACF(k)','click here for more information about the Partial Autocorrelation Function'),header=TRUE)
a<-table.element(a,'T-STAT',header=TRUE)
a<-table.element(a,'P-value',header=TRUE)
a<-table.row.end(a)
for (i in 1:par1) {
a<-table.row.start(a)
a<-table.element(a,i,header=TRUE)
a<-table.element(a,round(mypacf[i],6))
mytstat <- mypacf[i]*sqrtn
a<-table.element(a,round(mytstat,4))
a<-table.element(a,round(1-pt(abs(mytstat),lengthx),6))
a<-table.row.end(a)
}
a<-table.end(a)
table.save(a,file='mytable1.tab')