Free Statistics

of Irreproducible Research!

Author's title

Author*The author of this computation has been verified*
R Software Modulerwasp_autocorrelation.wasp
Title produced by software(Partial) Autocorrelation Function
Date of computationMon, 15 Dec 2008 02:36:27 -0700
Cite this page as followsStatistical Computations at FreeStatistics.org, Office for Research Development and Education, URL https://freestatistics.org/blog/index.php?v=date/2008/Dec/15/t1229334063bnp64t03obrqc4c.htm/, Retrieved Sun, 19 May 2024 10:11:04 +0000
Statistical Computations at FreeStatistics.org, Office for Research Development and Education, URL https://freestatistics.org/blog/index.php?pk=33627, Retrieved Sun, 19 May 2024 10:11:04 +0000
QR Codes:

Original text written by user:
IsPrivate?No (this computation is public)
User-defined keywords
Estimated Impact198
Family? (F = Feedback message, R = changed R code, M = changed R Module, P = changed Parameters, D = changed Data)
-       [(Partial) Autocorrelation Function] [Partial Autocorre...] [2008-12-15 09:36:27] [21a82be02162ee9c644b6689eefbb825] [Current]
-   P     [(Partial) Autocorrelation Function] [Partial Correlation] [2008-12-16 18:57:09] [81e1690fdaa0a4031eafff37d4d5a366]
Feedback Forum

Post a new message
Dataseries X:
97.7
101.5
119.6
108.1
117.8
125.5
89.2
92.3
104.6
122.8
96
94.6
93.3
101.1
114.2
104.7
113.3
118.2
83.6
73.9
99.5
97.7
103
106.3
92.2
101.8
122.8
111.8
106.3
121.5
81.9
85.4
110.9
117.3
106.3
105.5
101.3
105.9
126.3
111.9
108.9
127.2
94.2
85.7
116.2
107.2
110.6
112
104.5
112
132.8
110.8
128.7
136.8
94.9
88.8
123.2
125.3
122.7
125.7
116.3
118.7
142
127.9
131.9
152.3
110.8
99.1
135
133.2
131
133.9
119.9
136.9
148.9
145.1
142.4
159.6
120.7
109
142


Summary of computational transaction
Raw Inputview raw input (R code)
Raw Outputview raw output of R engine
Computing time3 seconds
R Server'Sir Ronald Aylmer Fisher' @ 193.190.124.24

\begin{tabular}{lllllllll}
\hline
Summary of computational transaction \tabularnewline
Raw Input & view raw input (R code)  \tabularnewline
Raw Output & view raw output of R engine  \tabularnewline
Computing time & 3 seconds \tabularnewline
R Server & 'Sir Ronald Aylmer Fisher' @ 193.190.124.24 \tabularnewline
\hline
\end{tabular}
%Source: https://freestatistics.org/blog/index.php?pk=33627&T=0

[TABLE]
[ROW][C]Summary of computational transaction[/C][/ROW]
[ROW][C]Raw Input[/C][C]view raw input (R code) [/C][/ROW]
[ROW][C]Raw Output[/C][C]view raw output of R engine [/C][/ROW]
[ROW][C]Computing time[/C][C]3 seconds[/C][/ROW]
[ROW][C]R Server[/C][C]'Sir Ronald Aylmer Fisher' @ 193.190.124.24[/C][/ROW]
[/TABLE]
Source: https://freestatistics.org/blog/index.php?pk=33627&T=0

Globally Unique Identifier (entire table): ba.freestatistics.org/blog/index.php?pk=33627&T=0

As an alternative you can also use a QR Code:  

The GUIDs for individual cells are displayed in the table below:

Summary of computational transaction
Raw Inputview raw input (R code)
Raw Outputview raw output of R engine
Computing time3 seconds
R Server'Sir Ronald Aylmer Fisher' @ 193.190.124.24


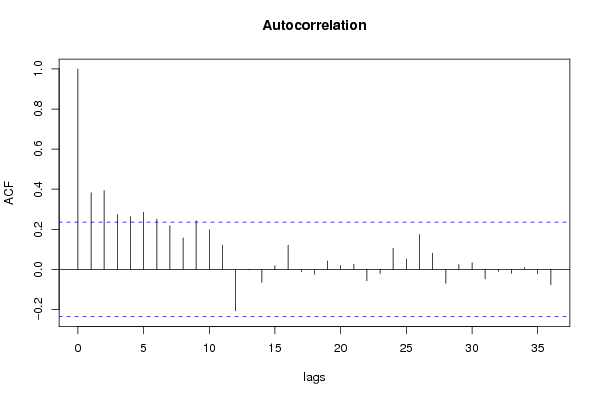
Autocorrelation Function
Time lag kACF(k)T-STATP-value
10.3821723.17460.001121
20.3931583.26580.000851
30.2732492.26980.013175
40.2634042.1880.01603
50.2848212.36590.0104
60.2503622.07970.020637
70.2181071.81170.03719
80.1563251.29850.099214
90.2429322.01790.023744
100.1971641.63780.053011
110.1201170.99780.160939
12-0.207079-1.72010.044946
13-0.00151-0.01250.495014
14-0.064223-0.53350.297709
150.0185650.15420.438945
160.1208421.00380.159493
17-0.011901-0.09890.460768
18-0.023868-0.19830.421711
190.0422680.35110.363288
200.0197440.1640.435104
210.0251260.20870.417644
22-0.057432-0.47710.317411
23-0.020989-0.17440.43105
240.1050470.87260.192957
250.0517130.42960.334426
260.173031.43730.077576
270.0809860.67270.251686
28-0.069261-0.57530.283472
290.0237270.19710.422169
300.0325860.27070.393724
31-0.047327-0.39310.347718
32-0.009418-0.07820.468936
33-0.019941-0.16560.434461
340.0096270.080.468246
35-0.021424-0.1780.429639
36-0.077131-0.64070.261921

\begin{tabular}{lllllllll}
\hline
Autocorrelation Function \tabularnewline
Time lag k & ACF(k) & T-STAT & P-value \tabularnewline
1 & 0.382172 & 3.1746 & 0.001121 \tabularnewline
2 & 0.393158 & 3.2658 & 0.000851 \tabularnewline
3 & 0.273249 & 2.2698 & 0.013175 \tabularnewline
4 & 0.263404 & 2.188 & 0.01603 \tabularnewline
5 & 0.284821 & 2.3659 & 0.0104 \tabularnewline
6 & 0.250362 & 2.0797 & 0.020637 \tabularnewline
7 & 0.218107 & 1.8117 & 0.03719 \tabularnewline
8 & 0.156325 & 1.2985 & 0.099214 \tabularnewline
9 & 0.242932 & 2.0179 & 0.023744 \tabularnewline
10 & 0.197164 & 1.6378 & 0.053011 \tabularnewline
11 & 0.120117 & 0.9978 & 0.160939 \tabularnewline
12 & -0.207079 & -1.7201 & 0.044946 \tabularnewline
13 & -0.00151 & -0.0125 & 0.495014 \tabularnewline
14 & -0.064223 & -0.5335 & 0.297709 \tabularnewline
15 & 0.018565 & 0.1542 & 0.438945 \tabularnewline
16 & 0.120842 & 1.0038 & 0.159493 \tabularnewline
17 & -0.011901 & -0.0989 & 0.460768 \tabularnewline
18 & -0.023868 & -0.1983 & 0.421711 \tabularnewline
19 & 0.042268 & 0.3511 & 0.363288 \tabularnewline
20 & 0.019744 & 0.164 & 0.435104 \tabularnewline
21 & 0.025126 & 0.2087 & 0.417644 \tabularnewline
22 & -0.057432 & -0.4771 & 0.317411 \tabularnewline
23 & -0.020989 & -0.1744 & 0.43105 \tabularnewline
24 & 0.105047 & 0.8726 & 0.192957 \tabularnewline
25 & 0.051713 & 0.4296 & 0.334426 \tabularnewline
26 & 0.17303 & 1.4373 & 0.077576 \tabularnewline
27 & 0.080986 & 0.6727 & 0.251686 \tabularnewline
28 & -0.069261 & -0.5753 & 0.283472 \tabularnewline
29 & 0.023727 & 0.1971 & 0.422169 \tabularnewline
30 & 0.032586 & 0.2707 & 0.393724 \tabularnewline
31 & -0.047327 & -0.3931 & 0.347718 \tabularnewline
32 & -0.009418 & -0.0782 & 0.468936 \tabularnewline
33 & -0.019941 & -0.1656 & 0.434461 \tabularnewline
34 & 0.009627 & 0.08 & 0.468246 \tabularnewline
35 & -0.021424 & -0.178 & 0.429639 \tabularnewline
36 & -0.077131 & -0.6407 & 0.261921 \tabularnewline
\hline
\end{tabular}
%Source: https://freestatistics.org/blog/index.php?pk=33627&T=1

[TABLE]
[ROW][C]Autocorrelation Function[/C][/ROW]
[ROW][C]Time lag k[/C][C]ACF(k)[/C][C]T-STAT[/C][C]P-value[/C][/ROW]
[ROW][C]1[/C][C]0.382172[/C][C]3.1746[/C][C]0.001121[/C][/ROW]
[ROW][C]2[/C][C]0.393158[/C][C]3.2658[/C][C]0.000851[/C][/ROW]
[ROW][C]3[/C][C]0.273249[/C][C]2.2698[/C][C]0.013175[/C][/ROW]
[ROW][C]4[/C][C]0.263404[/C][C]2.188[/C][C]0.01603[/C][/ROW]
[ROW][C]5[/C][C]0.284821[/C][C]2.3659[/C][C]0.0104[/C][/ROW]
[ROW][C]6[/C][C]0.250362[/C][C]2.0797[/C][C]0.020637[/C][/ROW]
[ROW][C]7[/C][C]0.218107[/C][C]1.8117[/C][C]0.03719[/C][/ROW]
[ROW][C]8[/C][C]0.156325[/C][C]1.2985[/C][C]0.099214[/C][/ROW]
[ROW][C]9[/C][C]0.242932[/C][C]2.0179[/C][C]0.023744[/C][/ROW]
[ROW][C]10[/C][C]0.197164[/C][C]1.6378[/C][C]0.053011[/C][/ROW]
[ROW][C]11[/C][C]0.120117[/C][C]0.9978[/C][C]0.160939[/C][/ROW]
[ROW][C]12[/C][C]-0.207079[/C][C]-1.7201[/C][C]0.044946[/C][/ROW]
[ROW][C]13[/C][C]-0.00151[/C][C]-0.0125[/C][C]0.495014[/C][/ROW]
[ROW][C]14[/C][C]-0.064223[/C][C]-0.5335[/C][C]0.297709[/C][/ROW]
[ROW][C]15[/C][C]0.018565[/C][C]0.1542[/C][C]0.438945[/C][/ROW]
[ROW][C]16[/C][C]0.120842[/C][C]1.0038[/C][C]0.159493[/C][/ROW]
[ROW][C]17[/C][C]-0.011901[/C][C]-0.0989[/C][C]0.460768[/C][/ROW]
[ROW][C]18[/C][C]-0.023868[/C][C]-0.1983[/C][C]0.421711[/C][/ROW]
[ROW][C]19[/C][C]0.042268[/C][C]0.3511[/C][C]0.363288[/C][/ROW]
[ROW][C]20[/C][C]0.019744[/C][C]0.164[/C][C]0.435104[/C][/ROW]
[ROW][C]21[/C][C]0.025126[/C][C]0.2087[/C][C]0.417644[/C][/ROW]
[ROW][C]22[/C][C]-0.057432[/C][C]-0.4771[/C][C]0.317411[/C][/ROW]
[ROW][C]23[/C][C]-0.020989[/C][C]-0.1744[/C][C]0.43105[/C][/ROW]
[ROW][C]24[/C][C]0.105047[/C][C]0.8726[/C][C]0.192957[/C][/ROW]
[ROW][C]25[/C][C]0.051713[/C][C]0.4296[/C][C]0.334426[/C][/ROW]
[ROW][C]26[/C][C]0.17303[/C][C]1.4373[/C][C]0.077576[/C][/ROW]
[ROW][C]27[/C][C]0.080986[/C][C]0.6727[/C][C]0.251686[/C][/ROW]
[ROW][C]28[/C][C]-0.069261[/C][C]-0.5753[/C][C]0.283472[/C][/ROW]
[ROW][C]29[/C][C]0.023727[/C][C]0.1971[/C][C]0.422169[/C][/ROW]
[ROW][C]30[/C][C]0.032586[/C][C]0.2707[/C][C]0.393724[/C][/ROW]
[ROW][C]31[/C][C]-0.047327[/C][C]-0.3931[/C][C]0.347718[/C][/ROW]
[ROW][C]32[/C][C]-0.009418[/C][C]-0.0782[/C][C]0.468936[/C][/ROW]
[ROW][C]33[/C][C]-0.019941[/C][C]-0.1656[/C][C]0.434461[/C][/ROW]
[ROW][C]34[/C][C]0.009627[/C][C]0.08[/C][C]0.468246[/C][/ROW]
[ROW][C]35[/C][C]-0.021424[/C][C]-0.178[/C][C]0.429639[/C][/ROW]
[ROW][C]36[/C][C]-0.077131[/C][C]-0.6407[/C][C]0.261921[/C][/ROW]
[/TABLE]
Source: https://freestatistics.org/blog/index.php?pk=33627&T=1

Globally Unique Identifier (entire table): ba.freestatistics.org/blog/index.php?pk=33627&T=1

As an alternative you can also use a QR Code:  

The GUIDs for individual cells are displayed in the table below:

Autocorrelation Function
Time lag kACF(k)T-STATP-value
10.3821723.17460.001121
20.3931583.26580.000851
30.2732492.26980.013175
40.2634042.1880.01603
50.2848212.36590.0104
60.2503622.07970.020637
70.2181071.81170.03719
80.1563251.29850.099214
90.2429322.01790.023744
100.1971641.63780.053011
110.1201170.99780.160939
12-0.207079-1.72010.044946
13-0.00151-0.01250.495014
14-0.064223-0.53350.297709
150.0185650.15420.438945
160.1208421.00380.159493
17-0.011901-0.09890.460768
18-0.023868-0.19830.421711
190.0422680.35110.363288
200.0197440.1640.435104
210.0251260.20870.417644
22-0.057432-0.47710.317411
23-0.020989-0.17440.43105
240.1050470.87260.192957
250.0517130.42960.334426
260.173031.43730.077576
270.0809860.67270.251686
28-0.069261-0.57530.283472
290.0237270.19710.422169
300.0325860.27070.393724
31-0.047327-0.39310.347718
32-0.009418-0.07820.468936
33-0.019941-0.16560.434461
340.0096270.080.468246
35-0.021424-0.1780.429639
36-0.077131-0.64070.261921


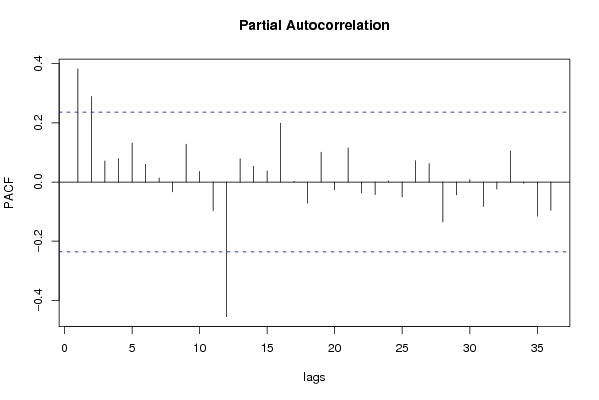
Partial Autocorrelation Function
Time lag kPACF(k)T-STATP-value
10.3821723.17460.001121
20.2893662.40370.009462
30.0714250.59330.27746
40.078880.65520.25725
50.1316151.09330.139038
60.0604580.50220.308561
70.0138860.11530.454254
8-0.032664-0.27130.393473
90.1280451.06360.145604
100.0360310.29930.382807
11-0.095927-0.79680.214142
12-0.454826-3.77810.000166
130.0791210.65720.256609
140.0536060.44530.328754
150.0371730.30880.379207
160.1985381.64920.051828
170.0023980.01990.492082
18-0.071294-0.59220.277822
190.100930.83840.202355
20-0.026115-0.21690.414453
210.1151670.95670.171041
22-0.036759-0.30530.380513
23-0.042175-0.35030.363578
240.0037980.03150.487463
25-0.050531-0.41970.33799
260.0718080.59650.276403
270.0618190.51350.304617
28-0.134621-1.11830.133669
29-0.043005-0.35720.361005
300.0082890.06890.472652
31-0.082329-0.68390.248171
32-0.023795-0.19770.421948
330.1047040.86970.19373
34-0.004369-0.03630.485578
35-0.11518-0.95680.171016
36-0.095338-0.79190.215556

\begin{tabular}{lllllllll}
\hline
Partial Autocorrelation Function \tabularnewline
Time lag k & PACF(k) & T-STAT & P-value \tabularnewline
1 & 0.382172 & 3.1746 & 0.001121 \tabularnewline
2 & 0.289366 & 2.4037 & 0.009462 \tabularnewline
3 & 0.071425 & 0.5933 & 0.27746 \tabularnewline
4 & 0.07888 & 0.6552 & 0.25725 \tabularnewline
5 & 0.131615 & 1.0933 & 0.139038 \tabularnewline
6 & 0.060458 & 0.5022 & 0.308561 \tabularnewline
7 & 0.013886 & 0.1153 & 0.454254 \tabularnewline
8 & -0.032664 & -0.2713 & 0.393473 \tabularnewline
9 & 0.128045 & 1.0636 & 0.145604 \tabularnewline
10 & 0.036031 & 0.2993 & 0.382807 \tabularnewline
11 & -0.095927 & -0.7968 & 0.214142 \tabularnewline
12 & -0.454826 & -3.7781 & 0.000166 \tabularnewline
13 & 0.079121 & 0.6572 & 0.256609 \tabularnewline
14 & 0.053606 & 0.4453 & 0.328754 \tabularnewline
15 & 0.037173 & 0.3088 & 0.379207 \tabularnewline
16 & 0.198538 & 1.6492 & 0.051828 \tabularnewline
17 & 0.002398 & 0.0199 & 0.492082 \tabularnewline
18 & -0.071294 & -0.5922 & 0.277822 \tabularnewline
19 & 0.10093 & 0.8384 & 0.202355 \tabularnewline
20 & -0.026115 & -0.2169 & 0.414453 \tabularnewline
21 & 0.115167 & 0.9567 & 0.171041 \tabularnewline
22 & -0.036759 & -0.3053 & 0.380513 \tabularnewline
23 & -0.042175 & -0.3503 & 0.363578 \tabularnewline
24 & 0.003798 & 0.0315 & 0.487463 \tabularnewline
25 & -0.050531 & -0.4197 & 0.33799 \tabularnewline
26 & 0.071808 & 0.5965 & 0.276403 \tabularnewline
27 & 0.061819 & 0.5135 & 0.304617 \tabularnewline
28 & -0.134621 & -1.1183 & 0.133669 \tabularnewline
29 & -0.043005 & -0.3572 & 0.361005 \tabularnewline
30 & 0.008289 & 0.0689 & 0.472652 \tabularnewline
31 & -0.082329 & -0.6839 & 0.248171 \tabularnewline
32 & -0.023795 & -0.1977 & 0.421948 \tabularnewline
33 & 0.104704 & 0.8697 & 0.19373 \tabularnewline
34 & -0.004369 & -0.0363 & 0.485578 \tabularnewline
35 & -0.11518 & -0.9568 & 0.171016 \tabularnewline
36 & -0.095338 & -0.7919 & 0.215556 \tabularnewline
\hline
\end{tabular}
%Source: https://freestatistics.org/blog/index.php?pk=33627&T=2

[TABLE]
[ROW][C]Partial Autocorrelation Function[/C][/ROW]
[ROW][C]Time lag k[/C][C]PACF(k)[/C][C]T-STAT[/C][C]P-value[/C][/ROW]
[ROW][C]1[/C][C]0.382172[/C][C]3.1746[/C][C]0.001121[/C][/ROW]
[ROW][C]2[/C][C]0.289366[/C][C]2.4037[/C][C]0.009462[/C][/ROW]
[ROW][C]3[/C][C]0.071425[/C][C]0.5933[/C][C]0.27746[/C][/ROW]
[ROW][C]4[/C][C]0.07888[/C][C]0.6552[/C][C]0.25725[/C][/ROW]
[ROW][C]5[/C][C]0.131615[/C][C]1.0933[/C][C]0.139038[/C][/ROW]
[ROW][C]6[/C][C]0.060458[/C][C]0.5022[/C][C]0.308561[/C][/ROW]
[ROW][C]7[/C][C]0.013886[/C][C]0.1153[/C][C]0.454254[/C][/ROW]
[ROW][C]8[/C][C]-0.032664[/C][C]-0.2713[/C][C]0.393473[/C][/ROW]
[ROW][C]9[/C][C]0.128045[/C][C]1.0636[/C][C]0.145604[/C][/ROW]
[ROW][C]10[/C][C]0.036031[/C][C]0.2993[/C][C]0.382807[/C][/ROW]
[ROW][C]11[/C][C]-0.095927[/C][C]-0.7968[/C][C]0.214142[/C][/ROW]
[ROW][C]12[/C][C]-0.454826[/C][C]-3.7781[/C][C]0.000166[/C][/ROW]
[ROW][C]13[/C][C]0.079121[/C][C]0.6572[/C][C]0.256609[/C][/ROW]
[ROW][C]14[/C][C]0.053606[/C][C]0.4453[/C][C]0.328754[/C][/ROW]
[ROW][C]15[/C][C]0.037173[/C][C]0.3088[/C][C]0.379207[/C][/ROW]
[ROW][C]16[/C][C]0.198538[/C][C]1.6492[/C][C]0.051828[/C][/ROW]
[ROW][C]17[/C][C]0.002398[/C][C]0.0199[/C][C]0.492082[/C][/ROW]
[ROW][C]18[/C][C]-0.071294[/C][C]-0.5922[/C][C]0.277822[/C][/ROW]
[ROW][C]19[/C][C]0.10093[/C][C]0.8384[/C][C]0.202355[/C][/ROW]
[ROW][C]20[/C][C]-0.026115[/C][C]-0.2169[/C][C]0.414453[/C][/ROW]
[ROW][C]21[/C][C]0.115167[/C][C]0.9567[/C][C]0.171041[/C][/ROW]
[ROW][C]22[/C][C]-0.036759[/C][C]-0.3053[/C][C]0.380513[/C][/ROW]
[ROW][C]23[/C][C]-0.042175[/C][C]-0.3503[/C][C]0.363578[/C][/ROW]
[ROW][C]24[/C][C]0.003798[/C][C]0.0315[/C][C]0.487463[/C][/ROW]
[ROW][C]25[/C][C]-0.050531[/C][C]-0.4197[/C][C]0.33799[/C][/ROW]
[ROW][C]26[/C][C]0.071808[/C][C]0.5965[/C][C]0.276403[/C][/ROW]
[ROW][C]27[/C][C]0.061819[/C][C]0.5135[/C][C]0.304617[/C][/ROW]
[ROW][C]28[/C][C]-0.134621[/C][C]-1.1183[/C][C]0.133669[/C][/ROW]
[ROW][C]29[/C][C]-0.043005[/C][C]-0.3572[/C][C]0.361005[/C][/ROW]
[ROW][C]30[/C][C]0.008289[/C][C]0.0689[/C][C]0.472652[/C][/ROW]
[ROW][C]31[/C][C]-0.082329[/C][C]-0.6839[/C][C]0.248171[/C][/ROW]
[ROW][C]32[/C][C]-0.023795[/C][C]-0.1977[/C][C]0.421948[/C][/ROW]
[ROW][C]33[/C][C]0.104704[/C][C]0.8697[/C][C]0.19373[/C][/ROW]
[ROW][C]34[/C][C]-0.004369[/C][C]-0.0363[/C][C]0.485578[/C][/ROW]
[ROW][C]35[/C][C]-0.11518[/C][C]-0.9568[/C][C]0.171016[/C][/ROW]
[ROW][C]36[/C][C]-0.095338[/C][C]-0.7919[/C][C]0.215556[/C][/ROW]
[/TABLE]
Source: https://freestatistics.org/blog/index.php?pk=33627&T=2

Globally Unique Identifier (entire table): ba.freestatistics.org/blog/index.php?pk=33627&T=2

As an alternative you can also use a QR Code:  

The GUIDs for individual cells are displayed in the table below:

Partial Autocorrelation Function
Time lag kPACF(k)T-STATP-value
10.3821723.17460.001121
20.2893662.40370.009462
30.0714250.59330.27746
40.078880.65520.25725
50.1316151.09330.139038
60.0604580.50220.308561
70.0138860.11530.454254
8-0.032664-0.27130.393473
90.1280451.06360.145604
100.0360310.29930.382807
11-0.095927-0.79680.214142
12-0.454826-3.77810.000166
130.0791210.65720.256609
140.0536060.44530.328754
150.0371730.30880.379207
160.1985381.64920.051828
170.0023980.01990.492082
18-0.071294-0.59220.277822
190.100930.83840.202355
20-0.026115-0.21690.414453
210.1151670.95670.171041
22-0.036759-0.30530.380513
23-0.042175-0.35030.363578
240.0037980.03150.487463
25-0.050531-0.41970.33799
260.0718080.59650.276403
270.0618190.51350.304617
28-0.134621-1.11830.133669
29-0.043005-0.35720.361005
300.0082890.06890.472652
31-0.082329-0.68390.248171
32-0.023795-0.19770.421948
330.1047040.86970.19373
34-0.004369-0.03630.485578
35-0.11518-0.95680.171016
36-0.095338-0.79190.215556


Parameters (Session):
par1 = 36 ; par2 = 0.3 ; par3 = 0 ; par4 = 1 ; par5 = 12 ;
Parameters (R input):
par1 = 36 ; par2 = 0.3 ; par3 = 0 ; par4 = 1 ; par5 = 12 ;
R code (references can be found in the software module):
if (par1 == 'Default') {
par1 = 10*log10(length(x))
} else {
par1 <- as.numeric(par1)
}
par2 <- as.numeric(par2)
par3 <- as.numeric(par3)
par4 <- as.numeric(par4)
par5 <- as.numeric(par5)
if (par2 == 0) {
x <- log(x)
} else {
x <- (x ^ par2 - 1) / par2
}
if (par3 > 0) x <- diff(x,lag=1,difference=par3)
if (par4 > 0) x <- diff(x,lag=par5,difference=par4)
bitmap(file='pic1.png')
racf <- acf(x,par1,main='Autocorrelation',xlab='lags',ylab='ACF')
dev.off()
bitmap(file='pic2.png')
rpacf <- pacf(x,par1,main='Partial Autocorrelation',xlab='lags',ylab='PACF')
dev.off()
(myacf <- c(racf$acf))
(mypacf <- c(rpacf$acf))
lengthx <- length(x)
sqrtn <- sqrt(lengthx)
load(file='createtable')
a<-table.start()
a<-table.row.start(a)
a<-table.element(a,'Autocorrelation Function',4,TRUE)
a<-table.row.end(a)
a<-table.row.start(a)
a<-table.element(a,'Time lag k',header=TRUE)
a<-table.element(a,hyperlink('basics.htm','ACF(k)','click here for more information about the Autocorrelation Function'),header=TRUE)
a<-table.element(a,'T-STAT',header=TRUE)
a<-table.element(a,'P-value',header=TRUE)
a<-table.row.end(a)
for (i in 2:(par1+1)) {
a<-table.row.start(a)
a<-table.element(a,i-1,header=TRUE)
a<-table.element(a,round(myacf[i],6))
mytstat <- myacf[i]*sqrtn
a<-table.element(a,round(mytstat,4))
a<-table.element(a,round(1-pt(abs(mytstat),lengthx),6))
a<-table.row.end(a)
}
a<-table.end(a)
table.save(a,file='mytable.tab')
a<-table.start()
a<-table.row.start(a)
a<-table.element(a,'Partial Autocorrelation Function',4,TRUE)
a<-table.row.end(a)
a<-table.row.start(a)
a<-table.element(a,'Time lag k',header=TRUE)
a<-table.element(a,hyperlink('basics.htm','PACF(k)','click here for more information about the Partial Autocorrelation Function'),header=TRUE)
a<-table.element(a,'T-STAT',header=TRUE)
a<-table.element(a,'P-value',header=TRUE)
a<-table.row.end(a)
for (i in 1:par1) {
a<-table.row.start(a)
a<-table.element(a,i,header=TRUE)
a<-table.element(a,round(mypacf[i],6))
mytstat <- mypacf[i]*sqrtn
a<-table.element(a,round(mytstat,4))
a<-table.element(a,round(1-pt(abs(mytstat),lengthx),6))
a<-table.row.end(a)
}
a<-table.end(a)
table.save(a,file='mytable1.tab')