Free Statistics

of Irreproducible Research!

Author's title

Author*The author of this computation has been verified*
R Software Modulerwasp_autocorrelation.wasp
Title produced by software(Partial) Autocorrelation Function
Date of computationSat, 13 Dec 2008 09:05:24 -0700
Cite this page as followsStatistical Computations at FreeStatistics.org, Office for Research Development and Education, URL https://freestatistics.org/blog/index.php?v=date/2008/Dec/13/t1229184366swi0aynpmmen7yp.htm/, Retrieved Sun, 19 May 2024 05:16:11 +0000
Statistical Computations at FreeStatistics.org, Office for Research Development and Education, URL https://freestatistics.org/blog/index.php?pk=33168, Retrieved Sun, 19 May 2024 05:16:11 +0000
QR Codes:

Original text written by user:
IsPrivate?No (this computation is public)
User-defined keywords
Estimated Impact171
Family? (F = Feedback message, R = changed R code, M = changed R Module, P = changed Parameters, D = changed Data)
-     [Maximum-likelihood Fitting - Normal Distribution] [Maximum-likelihoo...] [2008-12-10 19:35:16] [82d201ca7b4e7cd2c6f885d29b5b6937]
- RMP   [(Partial) Autocorrelation Function] [P(ACF)] [2008-12-10 20:35:05] [82d201ca7b4e7cd2c6f885d29b5b6937]
-   P     [(Partial) Autocorrelation Function] [ACF] [2008-12-13 15:48:44] [82d201ca7b4e7cd2c6f885d29b5b6937]
-   P         [(Partial) Autocorrelation Function] [ACF] [2008-12-13 16:05:24] [00a0a665d7a07edd2e460056b0c0c354] [Current]
-   PD          [(Partial) Autocorrelation Function] [ACF lambda 1: invoer] [2008-12-14 13:22:30] [82d201ca7b4e7cd2c6f885d29b5b6937]
Feedback Forum

Post a new message
Dataseries X:
11703.7
16283.6
16726.5
14968.9
14861
14583.3
15305.8
17903.9
16379.4
15420.3
17870.5
15912.8
13866.5
17823.2
17872
17420.4
16704.4
15991.2
16583.6
19123.5
17838.7
17209.4
18586.5
16258.1
15141.6
19202.1
17746.5
19090.1
18040.3
17515.5
17751.8
21072.4
17170
19439.5
19795.4
17574.9
16165.4
19464.6
19932.1
19961.2
17343.4
18924.2
18574.1
21350.6
18594.6
19823.1
20844.4
19640.2
17735.4
19813.6
22160
20664.3
17877.4
21211.2
21423.1
21688.7
23243.2
21490.2
22925.8
23184.8
18562.2


Summary of computational transaction
Raw Inputview raw input (R code)
Raw Outputview raw output of R engine
Computing time1 seconds
R Server'Gwilym Jenkins' @ 72.249.127.135

\begin{tabular}{lllllllll}
\hline
Summary of computational transaction \tabularnewline
Raw Input & view raw input (R code)  \tabularnewline
Raw Output & view raw output of R engine  \tabularnewline
Computing time & 1 seconds \tabularnewline
R Server & 'Gwilym Jenkins' @ 72.249.127.135 \tabularnewline
\hline
\end{tabular}
%Source: https://freestatistics.org/blog/index.php?pk=33168&T=0

[TABLE]
[ROW][C]Summary of computational transaction[/C][/ROW]
[ROW][C]Raw Input[/C][C]view raw input (R code) [/C][/ROW]
[ROW][C]Raw Output[/C][C]view raw output of R engine [/C][/ROW]
[ROW][C]Computing time[/C][C]1 seconds[/C][/ROW]
[ROW][C]R Server[/C][C]'Gwilym Jenkins' @ 72.249.127.135[/C][/ROW]
[/TABLE]
Source: https://freestatistics.org/blog/index.php?pk=33168&T=0

Globally Unique Identifier (entire table): ba.freestatistics.org/blog/index.php?pk=33168&T=0

As an alternative you can also use a QR Code:  

The GUIDs for individual cells are displayed in the table below:

Summary of computational transaction
Raw Inputview raw input (R code)
Raw Outputview raw output of R engine
Computing time1 seconds
R Server'Gwilym Jenkins' @ 72.249.127.135


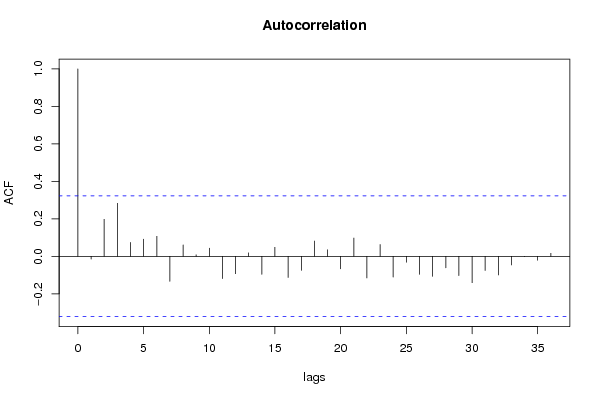
Autocorrelation Function
Time lag kACF(k)T-STATP-value
1-0.014984-0.09110.463934
20.1975281.20150.118593
30.283061.72180.04673
40.0737690.44870.328125
50.0912920.55530.291014
60.1069380.65050.259702
7-0.133837-0.81410.210398
80.0605820.36850.357298
90.0077630.04720.481295
100.0432410.2630.396994
11-0.119023-0.7240.236814
12-0.092589-0.56320.288349
130.0182470.1110.456111
14-0.096162-0.58490.281072
150.0478070.29080.386414
16-0.112841-0.68640.248375
17-0.075156-0.45720.325115
180.0810830.49320.312391
190.0345460.21010.417357
20-0.066706-0.40580.343629
210.097030.59020.279319
22-0.115808-0.70440.242787
230.0625320.38040.352924
24-0.110947-0.67490.251978
25-0.031294-0.19040.425036
26-0.09604-0.58420.28132
27-0.107142-0.65170.259306
28-0.061422-0.37360.355411
29-0.103118-0.62720.267175
30-0.14084-0.85670.198564
31-0.075476-0.45910.324423
32-0.09946-0.6050.274438
33-0.046513-0.28290.389405
34-0.001675-0.01020.495963
35-0.020594-0.12530.450493
360.016210.09860.460994
37NANANA
38NANANA
39NANANA
40NANANA
41NANANA
42NANANA
43NANANA
44NANANA
45NANANA
46NANANA
47NANANA
48NANANA

\begin{tabular}{lllllllll}
\hline
Autocorrelation Function \tabularnewline
Time lag k & ACF(k) & T-STAT & P-value \tabularnewline
1 & -0.014984 & -0.0911 & 0.463934 \tabularnewline
2 & 0.197528 & 1.2015 & 0.118593 \tabularnewline
3 & 0.28306 & 1.7218 & 0.04673 \tabularnewline
4 & 0.073769 & 0.4487 & 0.328125 \tabularnewline
5 & 0.091292 & 0.5553 & 0.291014 \tabularnewline
6 & 0.106938 & 0.6505 & 0.259702 \tabularnewline
7 & -0.133837 & -0.8141 & 0.210398 \tabularnewline
8 & 0.060582 & 0.3685 & 0.357298 \tabularnewline
9 & 0.007763 & 0.0472 & 0.481295 \tabularnewline
10 & 0.043241 & 0.263 & 0.396994 \tabularnewline
11 & -0.119023 & -0.724 & 0.236814 \tabularnewline
12 & -0.092589 & -0.5632 & 0.288349 \tabularnewline
13 & 0.018247 & 0.111 & 0.456111 \tabularnewline
14 & -0.096162 & -0.5849 & 0.281072 \tabularnewline
15 & 0.047807 & 0.2908 & 0.386414 \tabularnewline
16 & -0.112841 & -0.6864 & 0.248375 \tabularnewline
17 & -0.075156 & -0.4572 & 0.325115 \tabularnewline
18 & 0.081083 & 0.4932 & 0.312391 \tabularnewline
19 & 0.034546 & 0.2101 & 0.417357 \tabularnewline
20 & -0.066706 & -0.4058 & 0.343629 \tabularnewline
21 & 0.09703 & 0.5902 & 0.279319 \tabularnewline
22 & -0.115808 & -0.7044 & 0.242787 \tabularnewline
23 & 0.062532 & 0.3804 & 0.352924 \tabularnewline
24 & -0.110947 & -0.6749 & 0.251978 \tabularnewline
25 & -0.031294 & -0.1904 & 0.425036 \tabularnewline
26 & -0.09604 & -0.5842 & 0.28132 \tabularnewline
27 & -0.107142 & -0.6517 & 0.259306 \tabularnewline
28 & -0.061422 & -0.3736 & 0.355411 \tabularnewline
29 & -0.103118 & -0.6272 & 0.267175 \tabularnewline
30 & -0.14084 & -0.8567 & 0.198564 \tabularnewline
31 & -0.075476 & -0.4591 & 0.324423 \tabularnewline
32 & -0.09946 & -0.605 & 0.274438 \tabularnewline
33 & -0.046513 & -0.2829 & 0.389405 \tabularnewline
34 & -0.001675 & -0.0102 & 0.495963 \tabularnewline
35 & -0.020594 & -0.1253 & 0.450493 \tabularnewline
36 & 0.01621 & 0.0986 & 0.460994 \tabularnewline
37 & NA & NA & NA \tabularnewline
38 & NA & NA & NA \tabularnewline
39 & NA & NA & NA \tabularnewline
40 & NA & NA & NA \tabularnewline
41 & NA & NA & NA \tabularnewline
42 & NA & NA & NA \tabularnewline
43 & NA & NA & NA \tabularnewline
44 & NA & NA & NA \tabularnewline
45 & NA & NA & NA \tabularnewline
46 & NA & NA & NA \tabularnewline
47 & NA & NA & NA \tabularnewline
48 & NA & NA & NA \tabularnewline
\hline
\end{tabular}
%Source: https://freestatistics.org/blog/index.php?pk=33168&T=1

[TABLE]
[ROW][C]Autocorrelation Function[/C][/ROW]
[ROW][C]Time lag k[/C][C]ACF(k)[/C][C]T-STAT[/C][C]P-value[/C][/ROW]
[ROW][C]1[/C][C]-0.014984[/C][C]-0.0911[/C][C]0.463934[/C][/ROW]
[ROW][C]2[/C][C]0.197528[/C][C]1.2015[/C][C]0.118593[/C][/ROW]
[ROW][C]3[/C][C]0.28306[/C][C]1.7218[/C][C]0.04673[/C][/ROW]
[ROW][C]4[/C][C]0.073769[/C][C]0.4487[/C][C]0.328125[/C][/ROW]
[ROW][C]5[/C][C]0.091292[/C][C]0.5553[/C][C]0.291014[/C][/ROW]
[ROW][C]6[/C][C]0.106938[/C][C]0.6505[/C][C]0.259702[/C][/ROW]
[ROW][C]7[/C][C]-0.133837[/C][C]-0.8141[/C][C]0.210398[/C][/ROW]
[ROW][C]8[/C][C]0.060582[/C][C]0.3685[/C][C]0.357298[/C][/ROW]
[ROW][C]9[/C][C]0.007763[/C][C]0.0472[/C][C]0.481295[/C][/ROW]
[ROW][C]10[/C][C]0.043241[/C][C]0.263[/C][C]0.396994[/C][/ROW]
[ROW][C]11[/C][C]-0.119023[/C][C]-0.724[/C][C]0.236814[/C][/ROW]
[ROW][C]12[/C][C]-0.092589[/C][C]-0.5632[/C][C]0.288349[/C][/ROW]
[ROW][C]13[/C][C]0.018247[/C][C]0.111[/C][C]0.456111[/C][/ROW]
[ROW][C]14[/C][C]-0.096162[/C][C]-0.5849[/C][C]0.281072[/C][/ROW]
[ROW][C]15[/C][C]0.047807[/C][C]0.2908[/C][C]0.386414[/C][/ROW]
[ROW][C]16[/C][C]-0.112841[/C][C]-0.6864[/C][C]0.248375[/C][/ROW]
[ROW][C]17[/C][C]-0.075156[/C][C]-0.4572[/C][C]0.325115[/C][/ROW]
[ROW][C]18[/C][C]0.081083[/C][C]0.4932[/C][C]0.312391[/C][/ROW]
[ROW][C]19[/C][C]0.034546[/C][C]0.2101[/C][C]0.417357[/C][/ROW]
[ROW][C]20[/C][C]-0.066706[/C][C]-0.4058[/C][C]0.343629[/C][/ROW]
[ROW][C]21[/C][C]0.09703[/C][C]0.5902[/C][C]0.279319[/C][/ROW]
[ROW][C]22[/C][C]-0.115808[/C][C]-0.7044[/C][C]0.242787[/C][/ROW]
[ROW][C]23[/C][C]0.062532[/C][C]0.3804[/C][C]0.352924[/C][/ROW]
[ROW][C]24[/C][C]-0.110947[/C][C]-0.6749[/C][C]0.251978[/C][/ROW]
[ROW][C]25[/C][C]-0.031294[/C][C]-0.1904[/C][C]0.425036[/C][/ROW]
[ROW][C]26[/C][C]-0.09604[/C][C]-0.5842[/C][C]0.28132[/C][/ROW]
[ROW][C]27[/C][C]-0.107142[/C][C]-0.6517[/C][C]0.259306[/C][/ROW]
[ROW][C]28[/C][C]-0.061422[/C][C]-0.3736[/C][C]0.355411[/C][/ROW]
[ROW][C]29[/C][C]-0.103118[/C][C]-0.6272[/C][C]0.267175[/C][/ROW]
[ROW][C]30[/C][C]-0.14084[/C][C]-0.8567[/C][C]0.198564[/C][/ROW]
[ROW][C]31[/C][C]-0.075476[/C][C]-0.4591[/C][C]0.324423[/C][/ROW]
[ROW][C]32[/C][C]-0.09946[/C][C]-0.605[/C][C]0.274438[/C][/ROW]
[ROW][C]33[/C][C]-0.046513[/C][C]-0.2829[/C][C]0.389405[/C][/ROW]
[ROW][C]34[/C][C]-0.001675[/C][C]-0.0102[/C][C]0.495963[/C][/ROW]
[ROW][C]35[/C][C]-0.020594[/C][C]-0.1253[/C][C]0.450493[/C][/ROW]
[ROW][C]36[/C][C]0.01621[/C][C]0.0986[/C][C]0.460994[/C][/ROW]
[ROW][C]37[/C][C]NA[/C][C]NA[/C][C]NA[/C][/ROW]
[ROW][C]38[/C][C]NA[/C][C]NA[/C][C]NA[/C][/ROW]
[ROW][C]39[/C][C]NA[/C][C]NA[/C][C]NA[/C][/ROW]
[ROW][C]40[/C][C]NA[/C][C]NA[/C][C]NA[/C][/ROW]
[ROW][C]41[/C][C]NA[/C][C]NA[/C][C]NA[/C][/ROW]
[ROW][C]42[/C][C]NA[/C][C]NA[/C][C]NA[/C][/ROW]
[ROW][C]43[/C][C]NA[/C][C]NA[/C][C]NA[/C][/ROW]
[ROW][C]44[/C][C]NA[/C][C]NA[/C][C]NA[/C][/ROW]
[ROW][C]45[/C][C]NA[/C][C]NA[/C][C]NA[/C][/ROW]
[ROW][C]46[/C][C]NA[/C][C]NA[/C][C]NA[/C][/ROW]
[ROW][C]47[/C][C]NA[/C][C]NA[/C][C]NA[/C][/ROW]
[ROW][C]48[/C][C]NA[/C][C]NA[/C][C]NA[/C][/ROW]
[/TABLE]
Source: https://freestatistics.org/blog/index.php?pk=33168&T=1

Globally Unique Identifier (entire table): ba.freestatistics.org/blog/index.php?pk=33168&T=1

As an alternative you can also use a QR Code:  

The GUIDs for individual cells are displayed in the table below:

Autocorrelation Function
Time lag kACF(k)T-STATP-value
1-0.014984-0.09110.463934
20.1975281.20150.118593
30.283061.72180.04673
40.0737690.44870.328125
50.0912920.55530.291014
60.1069380.65050.259702
7-0.133837-0.81410.210398
80.0605820.36850.357298
90.0077630.04720.481295
100.0432410.2630.396994
11-0.119023-0.7240.236814
12-0.092589-0.56320.288349
130.0182470.1110.456111
14-0.096162-0.58490.281072
150.0478070.29080.386414
16-0.112841-0.68640.248375
17-0.075156-0.45720.325115
180.0810830.49320.312391
190.0345460.21010.417357
20-0.066706-0.40580.343629
210.097030.59020.279319
22-0.115808-0.70440.242787
230.0625320.38040.352924
24-0.110947-0.67490.251978
25-0.031294-0.19040.425036
26-0.09604-0.58420.28132
27-0.107142-0.65170.259306
28-0.061422-0.37360.355411
29-0.103118-0.62720.267175
30-0.14084-0.85670.198564
31-0.075476-0.45910.324423
32-0.09946-0.6050.274438
33-0.046513-0.28290.389405
34-0.001675-0.01020.495963
35-0.020594-0.12530.450493
360.016210.09860.460994
37NANANA
38NANANA
39NANANA
40NANANA
41NANANA
42NANANA
43NANANA
44NANANA
45NANANA
46NANANA
47NANANA
48NANANA


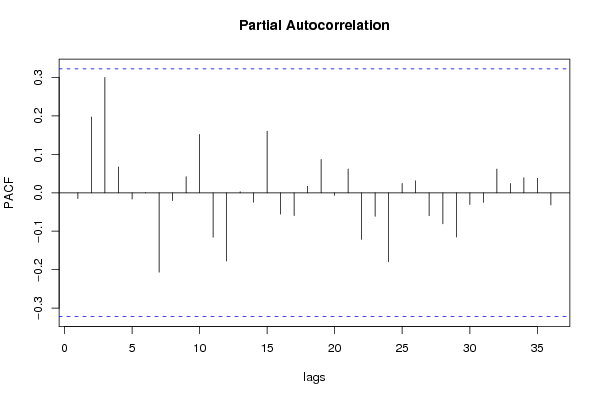
Partial Autocorrelation Function
Time lag kPACF(k)T-STATP-value
1-0.014984-0.09110.463934
20.1973471.20040.118803
30.3001471.82570.037986
40.067190.40870.342557
5-0.016375-0.09960.460599
60.0006680.00410.498389
7-0.206616-1.25680.108352
8-0.020101-0.12230.451674
90.0419970.25550.399891
100.1516940.92270.181066
11-0.115554-0.70290.243263
12-0.177444-1.07930.143709
130.0027550.01680.49336
14-0.024355-0.14810.441517
150.1602130.97450.168059
16-0.055425-0.33710.36896
17-0.059348-0.3610.360077
180.0169890.10330.459126
190.0868480.52830.30023
20-0.006883-0.04190.483415
210.0620850.37770.353924
22-0.121486-0.7390.232293
23-0.061242-0.37250.355816
24-0.179584-1.09240.140867
250.0242320.14740.441809
260.0311650.18960.425341
27-0.059395-0.36130.35997
28-0.08076-0.49120.313077
29-0.114991-0.69950.244319
30-0.030656-0.18650.426547
31-0.025226-0.15340.439442
320.0618790.37640.354387
330.0241030.14660.442117
340.0392260.23860.406366
350.0378060.230.409692
36-0.031478-0.19150.424601
37NANANA
38NANANA
39NANANA
40NANANA
41NANANA
42NANANA
43NANANA
44NANANA
45NANANA
46NANANA
47NANANA
48NANANA

\begin{tabular}{lllllllll}
\hline
Partial Autocorrelation Function \tabularnewline
Time lag k & PACF(k) & T-STAT & P-value \tabularnewline
1 & -0.014984 & -0.0911 & 0.463934 \tabularnewline
2 & 0.197347 & 1.2004 & 0.118803 \tabularnewline
3 & 0.300147 & 1.8257 & 0.037986 \tabularnewline
4 & 0.06719 & 0.4087 & 0.342557 \tabularnewline
5 & -0.016375 & -0.0996 & 0.460599 \tabularnewline
6 & 0.000668 & 0.0041 & 0.498389 \tabularnewline
7 & -0.206616 & -1.2568 & 0.108352 \tabularnewline
8 & -0.020101 & -0.1223 & 0.451674 \tabularnewline
9 & 0.041997 & 0.2555 & 0.399891 \tabularnewline
10 & 0.151694 & 0.9227 & 0.181066 \tabularnewline
11 & -0.115554 & -0.7029 & 0.243263 \tabularnewline
12 & -0.177444 & -1.0793 & 0.143709 \tabularnewline
13 & 0.002755 & 0.0168 & 0.49336 \tabularnewline
14 & -0.024355 & -0.1481 & 0.441517 \tabularnewline
15 & 0.160213 & 0.9745 & 0.168059 \tabularnewline
16 & -0.055425 & -0.3371 & 0.36896 \tabularnewline
17 & -0.059348 & -0.361 & 0.360077 \tabularnewline
18 & 0.016989 & 0.1033 & 0.459126 \tabularnewline
19 & 0.086848 & 0.5283 & 0.30023 \tabularnewline
20 & -0.006883 & -0.0419 & 0.483415 \tabularnewline
21 & 0.062085 & 0.3777 & 0.353924 \tabularnewline
22 & -0.121486 & -0.739 & 0.232293 \tabularnewline
23 & -0.061242 & -0.3725 & 0.355816 \tabularnewline
24 & -0.179584 & -1.0924 & 0.140867 \tabularnewline
25 & 0.024232 & 0.1474 & 0.441809 \tabularnewline
26 & 0.031165 & 0.1896 & 0.425341 \tabularnewline
27 & -0.059395 & -0.3613 & 0.35997 \tabularnewline
28 & -0.08076 & -0.4912 & 0.313077 \tabularnewline
29 & -0.114991 & -0.6995 & 0.244319 \tabularnewline
30 & -0.030656 & -0.1865 & 0.426547 \tabularnewline
31 & -0.025226 & -0.1534 & 0.439442 \tabularnewline
32 & 0.061879 & 0.3764 & 0.354387 \tabularnewline
33 & 0.024103 & 0.1466 & 0.442117 \tabularnewline
34 & 0.039226 & 0.2386 & 0.406366 \tabularnewline
35 & 0.037806 & 0.23 & 0.409692 \tabularnewline
36 & -0.031478 & -0.1915 & 0.424601 \tabularnewline
37 & NA & NA & NA \tabularnewline
38 & NA & NA & NA \tabularnewline
39 & NA & NA & NA \tabularnewline
40 & NA & NA & NA \tabularnewline
41 & NA & NA & NA \tabularnewline
42 & NA & NA & NA \tabularnewline
43 & NA & NA & NA \tabularnewline
44 & NA & NA & NA \tabularnewline
45 & NA & NA & NA \tabularnewline
46 & NA & NA & NA \tabularnewline
47 & NA & NA & NA \tabularnewline
48 & NA & NA & NA \tabularnewline
\hline
\end{tabular}
%Source: https://freestatistics.org/blog/index.php?pk=33168&T=2

[TABLE]
[ROW][C]Partial Autocorrelation Function[/C][/ROW]
[ROW][C]Time lag k[/C][C]PACF(k)[/C][C]T-STAT[/C][C]P-value[/C][/ROW]
[ROW][C]1[/C][C]-0.014984[/C][C]-0.0911[/C][C]0.463934[/C][/ROW]
[ROW][C]2[/C][C]0.197347[/C][C]1.2004[/C][C]0.118803[/C][/ROW]
[ROW][C]3[/C][C]0.300147[/C][C]1.8257[/C][C]0.037986[/C][/ROW]
[ROW][C]4[/C][C]0.06719[/C][C]0.4087[/C][C]0.342557[/C][/ROW]
[ROW][C]5[/C][C]-0.016375[/C][C]-0.0996[/C][C]0.460599[/C][/ROW]
[ROW][C]6[/C][C]0.000668[/C][C]0.0041[/C][C]0.498389[/C][/ROW]
[ROW][C]7[/C][C]-0.206616[/C][C]-1.2568[/C][C]0.108352[/C][/ROW]
[ROW][C]8[/C][C]-0.020101[/C][C]-0.1223[/C][C]0.451674[/C][/ROW]
[ROW][C]9[/C][C]0.041997[/C][C]0.2555[/C][C]0.399891[/C][/ROW]
[ROW][C]10[/C][C]0.151694[/C][C]0.9227[/C][C]0.181066[/C][/ROW]
[ROW][C]11[/C][C]-0.115554[/C][C]-0.7029[/C][C]0.243263[/C][/ROW]
[ROW][C]12[/C][C]-0.177444[/C][C]-1.0793[/C][C]0.143709[/C][/ROW]
[ROW][C]13[/C][C]0.002755[/C][C]0.0168[/C][C]0.49336[/C][/ROW]
[ROW][C]14[/C][C]-0.024355[/C][C]-0.1481[/C][C]0.441517[/C][/ROW]
[ROW][C]15[/C][C]0.160213[/C][C]0.9745[/C][C]0.168059[/C][/ROW]
[ROW][C]16[/C][C]-0.055425[/C][C]-0.3371[/C][C]0.36896[/C][/ROW]
[ROW][C]17[/C][C]-0.059348[/C][C]-0.361[/C][C]0.360077[/C][/ROW]
[ROW][C]18[/C][C]0.016989[/C][C]0.1033[/C][C]0.459126[/C][/ROW]
[ROW][C]19[/C][C]0.086848[/C][C]0.5283[/C][C]0.30023[/C][/ROW]
[ROW][C]20[/C][C]-0.006883[/C][C]-0.0419[/C][C]0.483415[/C][/ROW]
[ROW][C]21[/C][C]0.062085[/C][C]0.3777[/C][C]0.353924[/C][/ROW]
[ROW][C]22[/C][C]-0.121486[/C][C]-0.739[/C][C]0.232293[/C][/ROW]
[ROW][C]23[/C][C]-0.061242[/C][C]-0.3725[/C][C]0.355816[/C][/ROW]
[ROW][C]24[/C][C]-0.179584[/C][C]-1.0924[/C][C]0.140867[/C][/ROW]
[ROW][C]25[/C][C]0.024232[/C][C]0.1474[/C][C]0.441809[/C][/ROW]
[ROW][C]26[/C][C]0.031165[/C][C]0.1896[/C][C]0.425341[/C][/ROW]
[ROW][C]27[/C][C]-0.059395[/C][C]-0.3613[/C][C]0.35997[/C][/ROW]
[ROW][C]28[/C][C]-0.08076[/C][C]-0.4912[/C][C]0.313077[/C][/ROW]
[ROW][C]29[/C][C]-0.114991[/C][C]-0.6995[/C][C]0.244319[/C][/ROW]
[ROW][C]30[/C][C]-0.030656[/C][C]-0.1865[/C][C]0.426547[/C][/ROW]
[ROW][C]31[/C][C]-0.025226[/C][C]-0.1534[/C][C]0.439442[/C][/ROW]
[ROW][C]32[/C][C]0.061879[/C][C]0.3764[/C][C]0.354387[/C][/ROW]
[ROW][C]33[/C][C]0.024103[/C][C]0.1466[/C][C]0.442117[/C][/ROW]
[ROW][C]34[/C][C]0.039226[/C][C]0.2386[/C][C]0.406366[/C][/ROW]
[ROW][C]35[/C][C]0.037806[/C][C]0.23[/C][C]0.409692[/C][/ROW]
[ROW][C]36[/C][C]-0.031478[/C][C]-0.1915[/C][C]0.424601[/C][/ROW]
[ROW][C]37[/C][C]NA[/C][C]NA[/C][C]NA[/C][/ROW]
[ROW][C]38[/C][C]NA[/C][C]NA[/C][C]NA[/C][/ROW]
[ROW][C]39[/C][C]NA[/C][C]NA[/C][C]NA[/C][/ROW]
[ROW][C]40[/C][C]NA[/C][C]NA[/C][C]NA[/C][/ROW]
[ROW][C]41[/C][C]NA[/C][C]NA[/C][C]NA[/C][/ROW]
[ROW][C]42[/C][C]NA[/C][C]NA[/C][C]NA[/C][/ROW]
[ROW][C]43[/C][C]NA[/C][C]NA[/C][C]NA[/C][/ROW]
[ROW][C]44[/C][C]NA[/C][C]NA[/C][C]NA[/C][/ROW]
[ROW][C]45[/C][C]NA[/C][C]NA[/C][C]NA[/C][/ROW]
[ROW][C]46[/C][C]NA[/C][C]NA[/C][C]NA[/C][/ROW]
[ROW][C]47[/C][C]NA[/C][C]NA[/C][C]NA[/C][/ROW]
[ROW][C]48[/C][C]NA[/C][C]NA[/C][C]NA[/C][/ROW]
[/TABLE]
Source: https://freestatistics.org/blog/index.php?pk=33168&T=2

Globally Unique Identifier (entire table): ba.freestatistics.org/blog/index.php?pk=33168&T=2

As an alternative you can also use a QR Code:  

The GUIDs for individual cells are displayed in the table below:

Partial Autocorrelation Function
Time lag kPACF(k)T-STATP-value
1-0.014984-0.09110.463934
20.1973471.20040.118803
30.3001471.82570.037986
40.067190.40870.342557
5-0.016375-0.09960.460599
60.0006680.00410.498389
7-0.206616-1.25680.108352
8-0.020101-0.12230.451674
90.0419970.25550.399891
100.1516940.92270.181066
11-0.115554-0.70290.243263
12-0.177444-1.07930.143709
130.0027550.01680.49336
14-0.024355-0.14810.441517
150.1602130.97450.168059
16-0.055425-0.33710.36896
17-0.059348-0.3610.360077
180.0169890.10330.459126
190.0868480.52830.30023
20-0.006883-0.04190.483415
210.0620850.37770.353924
22-0.121486-0.7390.232293
23-0.061242-0.37250.355816
24-0.179584-1.09240.140867
250.0242320.14740.441809
260.0311650.18960.425341
27-0.059395-0.36130.35997
28-0.08076-0.49120.313077
29-0.114991-0.69950.244319
30-0.030656-0.18650.426547
31-0.025226-0.15340.439442
320.0618790.37640.354387
330.0241030.14660.442117
340.0392260.23860.406366
350.0378060.230.409692
36-0.031478-0.19150.424601
37NANANA
38NANANA
39NANANA
40NANANA
41NANANA
42NANANA
43NANANA
44NANANA
45NANANA
46NANANA
47NANANA
48NANANA


Parameters (Session):
par1 = 48 ; par2 = 1 ; par3 = 0 ; par4 = 2 ; par5 = 12 ;
Parameters (R input):
par1 = 48 ; par2 = 1 ; par3 = 0 ; par4 = 2 ; par5 = 12 ;
R code (references can be found in the software module):
if (par1 == 'Default') {
par1 = 10*log10(length(x))
} else {
par1 <- as.numeric(par1)
}
par2 <- as.numeric(par2)
par3 <- as.numeric(par3)
par4 <- as.numeric(par4)
par5 <- as.numeric(par5)
if (par2 == 0) {
x <- log(x)
} else {
x <- (x ^ par2 - 1) / par2
}
if (par3 > 0) x <- diff(x,lag=1,difference=par3)
if (par4 > 0) x <- diff(x,lag=par5,difference=par4)
bitmap(file='pic1.png')
racf <- acf(x,par1,main='Autocorrelation',xlab='lags',ylab='ACF')
dev.off()
bitmap(file='pic2.png')
rpacf <- pacf(x,par1,main='Partial Autocorrelation',xlab='lags',ylab='PACF')
dev.off()
(myacf <- c(racf$acf))
(mypacf <- c(rpacf$acf))
lengthx <- length(x)
sqrtn <- sqrt(lengthx)
load(file='createtable')
a<-table.start()
a<-table.row.start(a)
a<-table.element(a,'Autocorrelation Function',4,TRUE)
a<-table.row.end(a)
a<-table.row.start(a)
a<-table.element(a,'Time lag k',header=TRUE)
a<-table.element(a,hyperlink('basics.htm','ACF(k)','click here for more information about the Autocorrelation Function'),header=TRUE)
a<-table.element(a,'T-STAT',header=TRUE)
a<-table.element(a,'P-value',header=TRUE)
a<-table.row.end(a)
for (i in 2:(par1+1)) {
a<-table.row.start(a)
a<-table.element(a,i-1,header=TRUE)
a<-table.element(a,round(myacf[i],6))
mytstat <- myacf[i]*sqrtn
a<-table.element(a,round(mytstat,4))
a<-table.element(a,round(1-pt(abs(mytstat),lengthx),6))
a<-table.row.end(a)
}
a<-table.end(a)
table.save(a,file='mytable.tab')
a<-table.start()
a<-table.row.start(a)
a<-table.element(a,'Partial Autocorrelation Function',4,TRUE)
a<-table.row.end(a)
a<-table.row.start(a)
a<-table.element(a,'Time lag k',header=TRUE)
a<-table.element(a,hyperlink('basics.htm','PACF(k)','click here for more information about the Partial Autocorrelation Function'),header=TRUE)
a<-table.element(a,'T-STAT',header=TRUE)
a<-table.element(a,'P-value',header=TRUE)
a<-table.row.end(a)
for (i in 1:par1) {
a<-table.row.start(a)
a<-table.element(a,i,header=TRUE)
a<-table.element(a,round(mypacf[i],6))
mytstat <- mypacf[i]*sqrtn
a<-table.element(a,round(mytstat,4))
a<-table.element(a,round(1-pt(abs(mytstat),lengthx),6))
a<-table.row.end(a)
}
a<-table.end(a)
table.save(a,file='mytable1.tab')