Free Statistics
of Irreproducible Research!
Description of Statistical Computation | |
|---|---|
| Author's title | |
| Author | *The author of this computation has been verified* |
| R Software Module | Rscript (source code is shown below) |
| Title produced by software | R console |
| Date of computation | Sat, 13 Dec 2008 08:50:00 -0700 |
| Cite this page as follows | Statistical Computations at FreeStatistics.org, Office for Research Development and Education, URL https://freestatistics.org/blog/index.php?v=date/2008/Dec/13/t1229183402brrxio2szolqgxe.htm/, Retrieved Sun, 19 May 2024 03:58:25 +0000 |
| Statistical Computations at FreeStatistics.org, Office for Research Development and Education, URL https://freestatistics.org/blog/index.php?pk=33161, Retrieved Sun, 19 May 2024 03:58:25 +0000 | |
| QR Codes: | |
|
| |
| Original text written by user: | no comments |
| IsPrivate? | No (this computation is public) |
| User-defined keywords | key1,key2 |
| Estimated Impact | 134 |
Tree of Dependent Computations | |
| Family? (F = Feedback message, R = changed R code, M = changed R Module, P = changed Parameters, D = changed Data) | |
| - [R console] [test] [2008-12-13 15:50:00] [9871d3a2c554b27151cacf1422eec048] [Current] | |
| Feedback Forum | |
Post a new message | |
Dataset | |
| Dataseries X: | |
-0.443134845986966 0.348820827218245 1.51884963011547 -2.32285811249102 1.75883505415123 0.486393054521504 -0.558514318949694 0.616311601703021 -0.0734621217682086 -1.22332757382773 0.921900953169388 0.586498920016743 0.572766162444037 -0.0324762811292378 -0.224289228534804 0.788913917202604 -1.53852301950316 1.82086846149691 -0.199180675529879 -0.0356828746956288 0.508040138458684 -0.592092349580005 -1.60132559690406 0.573828406780764 -0.158129967419165 0.233368189299115 -0.628963393200056 -0.0681726482507766 0.984912842946145 -0.120078914111492 0.883118316991104 0.114907052439672 0.426579216809079 0.49573577284764 -2.60484930767872 1.67792491998533 0.385708303611437 -0.655292614674739 0.255118149676870 1.45491554910579 1.69654397331573 0.506917615695583 -1.70395506373733 -1.42423763612326 0.481928321765707 -0.377256663740654 0.178766852668148 -0.765321473170794 -0.187693821209947 1.10000177017115 -1.76937553195631 0.712749085322337 0.113270620720662 -0.996666999809798 -0.692586163789349 -0.0992275726604955 1.69301805020742 2.23237261712147 -0.208035987316241 0.949106072800868 -0.74321756386177 -0.229975263469847 1.02972494298261 0.317189348318531 0.308454678139745 0.606089111826616 1.06944365053069 0.173967249860784 -0.828159184979274 0.126097170773882 -0.152680619532189 -1.28033145096907 0.189729797488266 0.340379652134014 -1.11818847994502 -0.846435535527284 0.701022610811193 -0.880728532048593 1.19889853763853 0.970460273148775 1.77526622208689 0.0489912138430613 -0.497390807892202 0.63040980533415 -0.239507047723899 -0.836478721877383 1.18241171986920 -0.154787632364649 1.23944161288426 -0.851441372009932 -0.0762132004917064 0.162942195919548 -0.116929488491406 0.333409494395167 -0.452286192345506 -1.24507308984487 -0.00376655815757903 -2.55677363502496 -0.069066334972017 -0.743543271888442 | |
Tables (Output of Computation) | |
> first_number = 5
> second_number = 7
> strpar = 'hello'
> {
+ myfun <- function(x, y) {
+ x + y
+ }
+
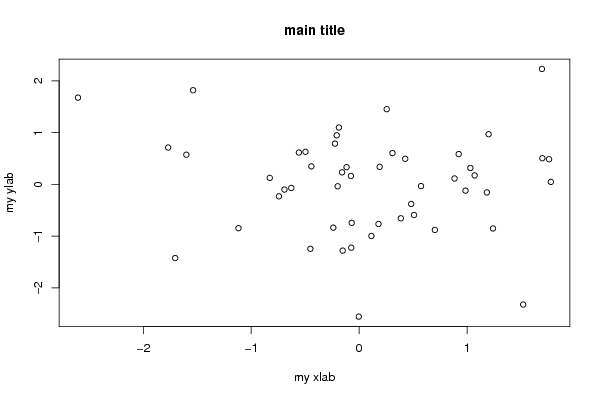
+ plot(RCx, main = 'main title', xlab = 'my xlab', ylab = 'my ylab')
+ .... [TRUNCATED]
[1] 12
| |
Figures (Output of Computation) | |
Input Parameters & R Code | |
| Parameters (Session): | |
| par1 = 5 ; par2 = 7 ; par3 = hello ; | |
| Parameters (R input): | |
| R code (body of R function): | |
{ | |